Abstract
Objectives
The purpose of this study was to investigate the feasibility of differentiating malignant prostate from benign prostatic hyperplasia (BPH) and normal prostate tissue by performing frequency domain analysis of photoacoustic images acquired at 2 different wavelengths.
Methods
We performed multiwavelength photoacoustic imaging on freshly excised human prostate specimens taken from a total of 30 patients undergoing prostatectomy for biopsy-confirmed prostate cancer. Histologic slides marked by a genitourinary pathologist were used as ground truth to define regions of interest (ROIs) in the photoacoustic images. Primarily, 3 different prostate tissue categories, namely malignant, BPH, and normal, were considered, while a fourth category named nonmalignant was formed by combining the ROIs corresponding to BPH and normal tissue together. We extracted 3 spectral parameters, namely slope, midband fit, and intercept, from power spectra of the radiofrequency photoacoustic signals corresponding to the 3 primary tissue categories.
Results
We analyzed data from 53 ROIs selected from the photoacoustic images of 30 patients. According to the histopathologic analysis, 19 ROIs were malignant, 8 were BPH, and 26 were normal. All the 3 spectral parameters and C-scan grayscale photo - acoustic image pixel values were found to be significantly different (P < .01) between malignant and nonmalignant prostate as well as malignant and normal prostate.
Conclusions
Preliminary results of our ex vivo human prostate study suggest that spectral parameters obtained by performing frequency domain analysis of photoacoustic signals can be used to differentiate between malignant and nonmalignant prostate.
Keywords: Frequency domain analysis, genitourinary ultrasound, multiwavelength, photoacoustic imaging, power spectrum, prostate cancer
INTRODUCTION
For American men, prostate cancer is the second leading cause of cancer-induced death, preceded by lung cancer. The American Cancer Society estimated that in the United States for the year 2015, about 220,800 new cases of prostate cancer would be diagnosed, with about 27,540 deaths.1 Typically, screening for the presence of prostate cancer is performed by checking prostate specific antigen levels and conducting a digital rectal examination. Persistent elevated prostate-specific antigen levels and suspicious lesions felt on the digital rectal examination often lead to transrectal ultrasound (US)-guided biopsy. Due to the isoechoic nature of approximately half of prostate cancer lesions and the similar appearances of some commonly occurring nonmalignant and malignant prostate conditions on US images, transrectal US has poor sensitivity for detecting prostate cancer.2 Prostate biopsies under transrectal US guidance are now largely systematic, with many popular schemes in use,3 and even with these procedures, there is a more than 30% chance of a misleading diagnosis because of sampling errors.4
To increase the sensitivity of transrectal US, ultrasoundbased techniques that can be easily integrated with the available technology to produce coregistered images have been investigated. Notable examples are contrast-enhanced US and real-time elastography, but they also could not improve the prostate cancer–detecting sensitivity to a reasonable level.2,5,6 Other imaging modalities, including magnetic resonance imaging, computed tomography, and positron emission tomography, have demonstrated limited use in the detection of prostate cancer and are primarily reserved for the evaluation and staging of advanced cancer.7,8 Clearly there is a need for a new imaging technique that accurately detects prostate cancer with high sensitivity.
Photoacoustic imaging promises to become a valuable tool in many clinical areas where there are unmet needs, as evidenced by several review articles.9–11 Photoacoustic imaging, which is based on the photoacoustic effect, is a hybrid noninvasive soft tissue imaging modality. The generation of a US wave by a light-absorbing material after the absorption of laser light is known as the photoacoustic effect. Inside the absorbing material, the absorbed light energy produces localized heating and subsequent rapid thermal expansion, which in turn produces an increase in pressure. This increased pressure is released in the form of broadband US waves, also known as photoacoustic waves.12 The photoacoustic wave depends on the absorbed light energy, which in turn depends on the product of the local optical absorption coefficient and the local exposure of optical energy in the tissue.13 Thus, photoacoustic image depicts the spatially varying optical absorption property of the tissue, provided the tissue is uniformly illuminated. Being a hybrid imaging modality, photoacoustic imaging retains some of the specific advantages of both the pure optical as well as US imaging modalities. As the variation of the optical absorption property is more pronounced than the weak echogenicity of the soft tissues, photoacoustic imaging can be used more efficiently than US imaging for tissue differentiation. At the same time, as with pure US imaging, it provides good spatial resolution at a considerable depth inside the tissue, in contrast with pure optical imaging, in which the resolution degrades substantially with increasing depth.12,14 Photoacoustic imaging can depict the optical absorption property of tissue constituents up to a few centimeters deep with submillimeter resolution.15
The tissue and its major constituents (water, oxyhemoglobin, and deoxyhemoglobin in blood, lipid, fat, melanin, collagen, etc) have widely varying absorption spectra10 in the near-infrared region that not only provide abundant contrast features but also open the door for photoacoustic imaging–based spectroscopy with multiwavelength photoacoustic imaging. In the case of multiwavelength photoacoustic imaging, different photoacoustic images of the same tissue sample are acquired by using different wavelengths of a tunable laser. Generally, the wavelengths are chosen in such a manner that each wavelength corresponds to the peak of the absorption spectrum of a particular light absorbing tissue constituent. The spectroscopic application of photoacoustic imaging lies in determination of the concentration of specific chromophores present in the tissue, which can be further used for functional imaging as well as noninvasive tissue characterization.15,16 Laufer et al17 determined the blood oxygen saturation in a cuvette from photo-acoustic spectra taken at multiple wavelengths in the range of 740 to 1040 nm. Allen et al18 performed spectroscopic photoacoustic imaging of human arterial tissue ex vivo to demonstrate the feasibility of detecting the presence of lipid in human aorta. Zhang et al19 measured dynamic blood oxygen saturation variation under different physiologic states from photoacoustic microscopic data acquired in vivo on Sprague Dawley rats.
Quantitative reconstruction of the chromophore concentration or optical absorption property of soft tissue from the multiwavelength photoacoustic image pixels is very difficult, as the pixel values depend on several factors, such as the optical absorption and scattering inside the tissue and frequency-dependent acoustic attenuation. Although there are several methods proposed by different research groups for quantitative recovery of the absorption property and chromophore concentration, some of the methods can be applied to only specific cases: ie, their application is limited by the assumption on which they have been built, whereas the more general methods have been tested only in simulation.20 An alternative approach for tissue characterization using photoacoustic data is analysis of the photoacoustic frequency spectrum, as it carries valuable information about the shape and size of the photoacoustic absorbers.13 Frequency domain analysis, in which spectral parameters, namely slope, midband fit, and intercept, are extracted from the power spectra of the time dependent signals within the usable bandwidth, is a widely used technique in pulse-echo US imaging for tissue characterization.21,22 Application of this technique on photo -acoustic image data is more recent. Using frequency domain analysis on a high-frequency photoacoustic signal generated by ex vivo ocular tissue, Silverman et al23 found that spectral slope and midband fit parameters were higher around the iris pigment epithelium. Kumon et al24 implemented a frequency domain analysis technique in an in vivo photoacoustic imaging study with a prostate cancer murine model involving 7 rats, and they showed that midband fit and intercept parameters were significantly different between malignant and normal tissue regions. In a phantom study, slope values corresponding to 2 different-diameter microsphere distributions were shown to be significantly different from each other by Yang et al.25 In a simulation study, a series of hypotheses relating the size and distribution of the spherical photoacoustic absorbers to extracted photoacoustic spectral parameters was derived by Xu et al,26 and they validated those hypotheses using a phantom study. Hysi et al27 studied the change in photo acoustic spectral parameters with the change in red blood cell aggregation and oxygenation using an experimentally acquired photoacoustic signal generated by porcine red blood cells along with a Monte Carlo–based theoretical model. In a phantom study with microspheres, Chitnis et al28 investigated the effect of effective absorber size extracted from the high-frequency photoacoustic spectrum, slope, and midband fit on the mean absorber diameter of the microspheres. Xu et al29 performed ex vivo as well as in situ experiments on mouse models to investigate the feasibility of differentiating fatty liver from normal liver using photo-acoustic spectral parameters. This article presents the results of a large-scale study of frequency analysis of photoacoustic signal data collected from biopsy-proven ex vivo prostate tissue samples. Although the frequency domain analysis is not entirely independent of light absorption and scattering inside the overlying tissue, we postulate that it may provide additional information about the dimensions of photo-acoustic absorbers, and that information may be used to differentiate different pathologic tissue types.
MATERIALS & METHODS
Before proceeding with the study, approval from the Institutional Review Board was obtained, along with consent from each patient. This study was in compliance with the Health Insurance Portability and Accountability Act. This experimental study consisted of frequency domain analysis performed on 3-dimensional (3D) photoacoustic data generated by freshly excised human prostate specimens collected from patients undergoing prostatectomy for biopsy-confirmed prostate cancer. The objective of the study was to verify the feasibility of differentiating among malignant prostate tissue, benign prostatic hyperplasia (BPH), and normal prostate tissue using frequency domain analysis of the 3D photoacoustic data. Although the experimental protocol and the experimental setup for acquiring photoacoustic data generated by the excised human prostate specimens were described in some of our earlier reports,30–32 here those things are described in a concise way for the sake of completeness and continuity.
Figure 1 shows the ex vivo photoacoustic imaging system developed in our laboratory. We used acoustic lensfocusing based transillumination geometry. In this setup, the light source and US transducer are placed on the opposite sides of the tissue specimen, and the acoustic lens focuses the photoacoustic wave on the transducer array. Figure 1A shows the concept behind our acoustic lens– based focusing approach. Once the prostate specimen was illuminated with a pulsed laser beam, the light-absorbing tissue constituents absorbed laser light and emitted photo - acoustic waves, which traveled in all directions. The portions of the photoacoustic waves collected by the acoustic lens were focused by the lens on the transducer array. To achieve unit magnification, the object distance (ie, the distance between the acoustic lens and the object plane) and the image distance (ie, the distance between the acoustic lens and the transducer array) were made equal to twice the focal length of the acoustic lens.
Figure 1.
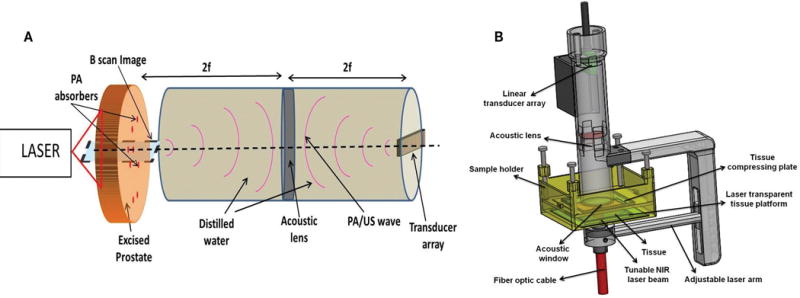
Ex vivo photoacoustic (PA) imaging system. A, Acoustic lens focusing-based photoacoustic image acquisition approach. B, The actual photoacoustic imaging probe with the tissue sample holder.
Figure 1B shows the actual ex vivo photoacoustic imaging setup developed in our laboratory. The adjustable laser arm holds the fiber bundle, which delivers the pulsed laser light from the tunable laser (wavelength, 700–1000 nm; pulse repetition frequency, 10 Hz; pulse duration, 5 nano - seconds; Ekspla, Vilnius, Lithuania) on the tissue sample holder. Although the physical dimensions of the sample holder allow it to accommodate tissue samples up to 4 cm thick, the maximum depth at which actual photoacoustic imaging can be performed inside the tissue is much less than 4 cm. The water-sealed cylinder suspended on the sample holder contains the custom-designed acoustic lens (focal length, 39.8 mm; diameter, 32 mm) and the 32 element 1-dimensional (1D) US transducer array (center frequency, 5 MHz; bandwidth, 60%; pitch, 0.7 mm; elevation, 1 mm; Olympus NDT, State College, PA). During photoacoustic imaging, both the cylinder and the sample holder were filled with saline water. The fiber bundle carrying arm and the cylindric container are attached to each other, and together they are referred to as the photoacoustic camera. The depth of the field of the lens is approximately ±0.5 cm around the focal plane. Figure 1A shows that if we receive the signal at each of the 32 elements of the 1D transducer array over a sufficiently long time gate and then map the corresponding arrival times to distances, then we will get 32 adjacent 1D radiofrequency photoacoustic signals or A-line photoacoustic signals, which can be further processed to produce a focused B-scan image representing a particular sagittal plane. To acquire photoacoustic data generated by an excised prostate specimen, the specimen was held stationary by the sample holder, and using dual-axis linear stepper motors, the photoacoustic camera raster scanned the specimen to acquire a set of photoacoustic A-line signals over a long time gate. A C-scan image (ie, image representing a particular cross-sectional plane) was formed by using the mean of each envelope-detected photoacoustic A-line signal over a small time gate. The transducer array is connected to a custom-designed data acquisition system (Apcon, Rochester, NY) to digitize and store the photoacoustic radiofrequency signals in the computer. We used our own MATLAB-based software (version 2012a; The MathWorks, Inc, Natick, MA) to form different C- or B-scan images from the stored photoacoustic data set.
Theoretically, the point spread function of the photo- acoustic imaging system can be expressed as convolution of the acoustic lens point spread function and transducer point spread function. We experimentally determined the point spread function of the photoacoustic system in the XZ plane using a lead pencil of 0.2 mm in diameter as target in a water bath. The pencil was placed perpendicular to the axis of the transducer array so that it behaved like a point source in the XZ plane. Figure 2 shows the experimental setup for measuring the point spread function of our ex vivo photoacoustic imaging probe. Here the lead pencil was placed in a water bath. Pulsed laser light from the tunable laser illuminated the pencil from the side. The probe was placed directly on top of the pencil in such a way that the pencil remained at a right angle to the X-axis or azimuth of the transducer array. The pencil was placed approximately below the center of the transducer array. The distance between the face of the probe and the pencil was kept very small (≈5 mm), so that an object distance approximately equal to twice the focal length of the acoustic lens could be maintained. Once the laser illuminated the pencil, it emitted a photoacoustic wave, which was focused by the acoustic lens on the transducer array. For determining the point spread function, an 800-nm wavelength for the tunable laser was used. Figure 3 shows the 2-dimensional (2D) point spread function of the ex vivo photoacoustic imaging probe in the XZ plane. The full width half maximum values of the 2D point spread function along lateral and axial directions were 2.45 and 0.34 mm, respectively.
Figure 2.
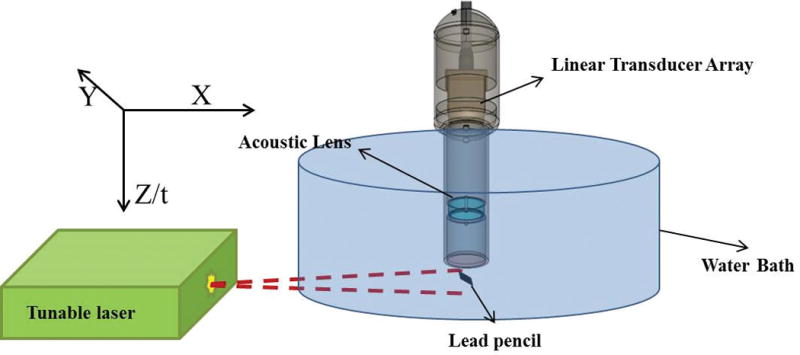
Experimental setup for measuring the point spread function in the XZ plane.
Figure 3.

A, Two-dimensional point spread function (PSF) of the ex vivo photoacoustic imaging probe in the XZ plane. B, Lateral cut (along azimuthal/X-axis) of the 2D point spread function in A. C, Axial cut (along time/Z-axis) of the 2D point spread function in A. The pair of red lines in B and C show the full width half maximum (FWHM) along the lateral and axial directions. The lateral full width half maximum is 2.45 mm, whereas the axial full width half maximum is 0.34 mm.
Photoacoustic imaging at multiple wavelengths was performed on freshly excised prostate specimens collected from patients undergoing prostatectomy for biopsy confirmed prostate cancer. Immediately after surgery, the excised prostate gland was sent to the surgical pathology laboratory, where it was inked and cut into thin sections (2–5 mm thick and 2–4 cm wide) by a genitourinary pathologist. One such section with a grossly visible nodule was selected, immersed in normal saline to prevent dryness, and sent to our laboratory, where we acquired photoacoustic images of it at multiple wavelengths. Once photoacoustic imaging was done, the prostate specimen was returned to the surgical pathology laboratory for histopathologic analysis. The complete process of sectioning the excised prostate gland, acquiring the photoacoustic images, and then returning the specimen to the surgical pathology laboratory was finished within 1 hour after surgery. The specimen was verified and approved by the genitourinary pathologist to ensure that the histopathologic procedure on the prostate specimen was not compromised. The laser intensity on the excised prostate specimen was maintained at around 5 mJ/cm2, which is well below the safe human exposure limit according to American National Standards Institute guidelines.33
Originally, the photoacoustic imaging was performed at 5 different wavelengths. Among them, signals acquired at 2 different wavelengths were analyzed and are presented here. The original 5 wavelengths were chosen in such a way that each wavelength corresponded to the peak of the absorption spectrum of a particular chromophore in the 700- to 1000-nm wavelength range. Chromophores are the light-absorbing tissue constituents. Following are the pairs of selected wavelengths and chromophores with peak absorption at the selected wavelength: 760 nm, deoxyhemoglobin; 850 nm, oxyhemoglobin; 930 nm, fat; and 970 nm, water.34–36 A wavelength of 800 nm was chosen, as at this wavelength, the absorption coefficients of both deoxyhemoglobin and oxyhemoglobin are equal.15,35 Figure 4 shows the absorption spectra of 4 different chromophores in the 700- to 1000-nm wavelength range. As it can be seen from Figure 4, absorption spectra of fat and water are 1 order magnitude smaller than those of deoxyhemoglobin and oxyhemoglobin. Due to the small values of fat and water absorption spectra, we hypothesize that the photoacoustic signal acquired within the 700- to 1000-nm wavelength range would be primarily composed of the contributions from deoxyhemoglobin and oxyhemoglobin. Here, photoacoustic signals acquired only at 760 and 800 nm were analyzed as at these 2 wavelengths; absorption coefficients of deoxyhemoglobin and oxyhemoglobin were fairly high among the 5 wavelengths at which ex vivo photoacoustic images were acquired. The genitourinary pathologist performed a histopathologic analysis on each excised prostate specimen, which was imaged in our laboratory. The marked histologic slides were used as ground truth in this study. The scanned images of the marked slides were coregistered manually with the Cscan photoacoustic images of the specimens to identify the regions of interest (ROIs) corresponding to different pathologic tissue types.
Figure 4.
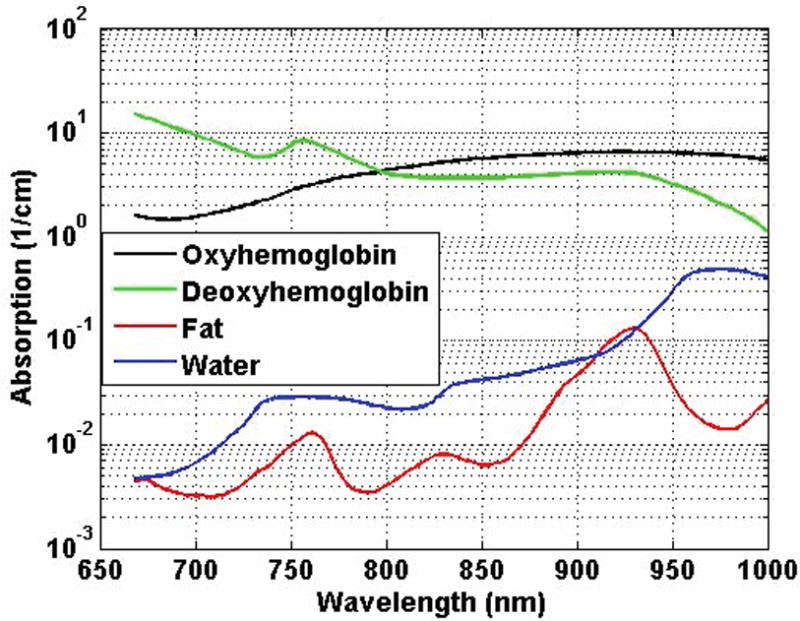
Absorption spectra of different chromophores in the 700- to 1000-nm wavelength range.36
Figure 5B shows the scanned histologic slide of the prostate specimen in Figure 5A. Two C-scan photoacoustic images, formed by using the photoacoustic data acquired at 760- and 800-nm wavelengths, are shown in Figure 5, C and D. In Figure 5, B–D, the ROIs corresponding to malignant prostate regions are shown by blue circles, whereas the adjacent normal prostate regions are shown by white circles.
Figure 5.
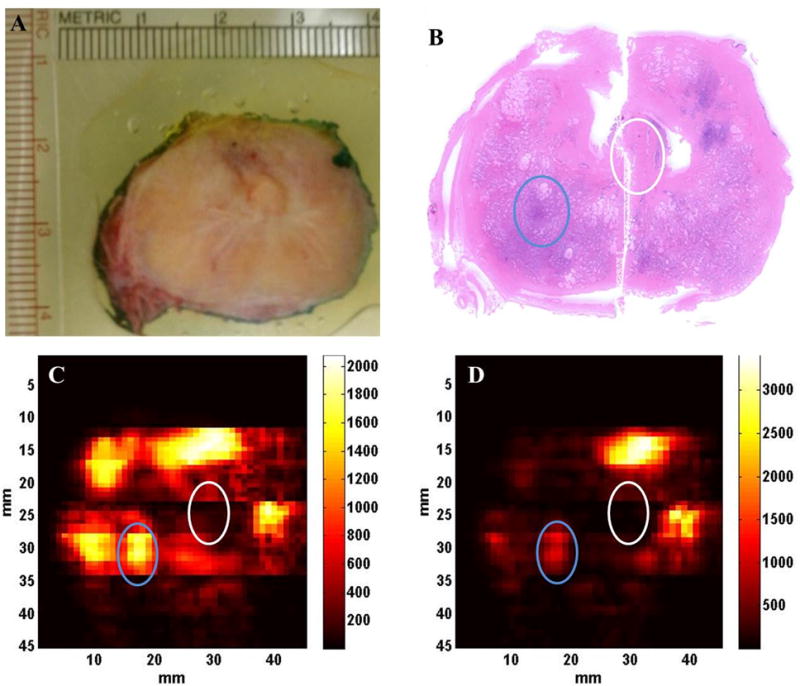
C-scan photoacoustic images of a freshly excised human prostate tissue sample taken at 2 different wavelengths. A, Prostate tissue sample. B, Histologic slide of the prostate tissue sample. C, Photoacoustic image at 760 nm. D, Photoacoustic image at 800 nm. Regions of interest corresponding to the malignant prostate are marked by the blue circles, whereas the adjacent normal ROIs are marked by the white circles in B, C, and D.
Once ROI selection was completed, power spectra of the preprocessed and windowed photoacoustic A-line signals within the ROI were computed. In this step, the photoacoustic A-line signals were corrected for the wavelength dependent laser input intensity variation using the input laser intensity measurements taken before each experiment. Then the wavelength-dependent attenuation of laser light during its propagation inside the tissue was corrected. The laser light gets attenuated while propagating through the tissue because of the optical absorption and scattering properties of the tissue. Using the Beer- Lambert law, 1D light attenuation was computed along the depth (Z-axis) inside the tissue for the 2 different wavelengths, and these computations were used to correct the photoacoustic A-line signals for the light attenuation at different depths inside the tissue:
| (1) |
Equation 1 represents the Beer-Lambert law used to compute the light attenuation inside the tissue along the depth. Here μeff, μa, and μs/ are the effective attenuation coefficient, absorption coefficient, and reduced scattering coefficient of the tissue, respectively. Φz and Φ0 are the light fluence at depth z inside the tissue and at the surface of the tissue. The values of the effective optical attenuation at the wavelengths were calculated by using the corresponding values of μa, and μs/ as reported for human prostate.37 The different values of μeff used here were 1.91 cm−1 at 760 nm and 1.79cm–1 at 800 nm. Once these corrections were done, the photoacoustic A-line signals were time gated to small sections using a series of sliding Hamming windows. Each of the Hamming windows was 1 microsecond long. The power spectrum of each time-gated A-line photoacoustic signal was computed by calculating the square of the fast Fourier transform of the windowed signal. During windowing, 30% overlap between Hamming windows on successive segments of every A-line was used as a compromise between reducing truncation artifacts in the fast Fourier transform and minimizing overlap. Each computed power spectrum was divided by the 1-way power spectrum of the transducer array to remove the artifacts due to the finite bandwidth of the transducer in the usable bandwidth. The usable bandwidth (2.4–7.4 MHz) is the frequency region within –10 dB of the peak of the 1-way power spectrum of the transducer array. The 1-way power spectrum of the transducer array was retrieved from the 2-way (pulse-echo) transfer function of the transducer array provided by the manufacturer. The calibrated power spectrum was converted to a decibel scale. Linear regression was performed to find the straight line best fit to the calibrated power spectrum in the usable bandwidth. The 3 spectral parameters, slope (decibels per megahertz), midband fit (decibels), and intercept (decibels), were extracted from each best-fit straight line. Figure 6 shows an example of the power spectrum analysis applied on a particular photoacoustic A-line signal. Figure 6A shows the C-scan photoacoustic image of the prostate specimen shown in Figure 5A. Each pixel in the C-scan image corresponds to a photoacoustic A-line signal. In Figure 6B, the photoacoustic A-line signal corresponding to the pixel marked by blue in Figure 6A is shown. Figure 6C shows the windowed photoacoustic signal obtained by applying a Hamming window on photoacoustic signal in Figure 6B. The Hamming window has the same length as that of the photoacoustic A-line signal. Figure 6D shows the normalized amplitude spectrum of the photoacoustic A-line signal along with the 1-way normalized amplitude spectrum of the transducer array. Figure 6E shows the best-fit straight line to the calibrated power spectrum of the A-line signal in the usable bandwidth along with the calibrated power spectrum. The spectral parameters slope and intercept are the slope and intercept of the best-fit straight line, whereas the midband fit is the height of the straight line at 5 MHz (ie, the middle point in the usable bandwidth).
Figure 6.
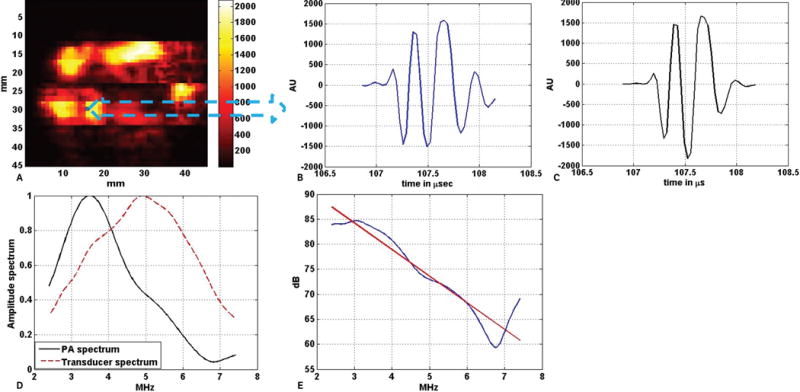
Example of power spectrum analysis on a single photoacoustic A-line signal. A, C-scan photoacoustic image of the excised prostate specimen shown in Figure 5A. B, Photoacoustic A-line signal generated by the tissue corresponding to the blue pixel in A. C, Windowed photoacoustic signal: ie, the photoacoustic signal in B was multiplied with a Hamming window of the same length. D, Amplitude spectrum of the windowed photoacoustic (PA) A-line signal along with the 1-way amplitude spectrum of the transducer (both normalized) in the useable bandwidth region (2.4–7.4 MHz). E, Calibrated power spectrum fitted to the linear model. The red line in E is the best fit straight line to the power spectrum of the windowed photoacoustic A-line, which is shown by the blue line. AU indicates arbitrary unit.
RESULTS
Thirty patients were involved in this study. Data from 53 ROIs were analyzed. According to the histopathologic analysis performed by the genitourinary pathologist, among the 53 ROIs, 19 were malignant, 8 were BPH, and 26 were normal. Another tissue category, named nonmalignant, was introduced here, and under this category all ROIs corresponding to normal and BPH tissue were combined.
Figure 7 shows 4 different bar plots where mean values of 4 different parameters corresponding to 3 different types of ROIs are plotted for the wavelengths of 760 and 800 nm. The 4 parameters consist of 3 spectral parameters and pixel values. The pixel values represent the values of the pixels in the C-scan photoacoustic images. The mean values were computed over the respective number of ROIs that were included in the study corresponding to malignant, BPH, and normal prostate tissue. On each bar representing the mean value of a particular parameter, the error bar represents the standard deviation of the corresponding parameter over the total number of photoacoustic A-lines belonging to the ROIs of a particular tissue type. The ROIs corresponding to BPH and normal prostate tissue are grouped into the nonmalignant category. Similar to Figure 7, the mean values of the 4 parameters corresponding to nonmalignant and malignant ROIs are plotted for both wavelengths in Figure 8.
Figure 7.
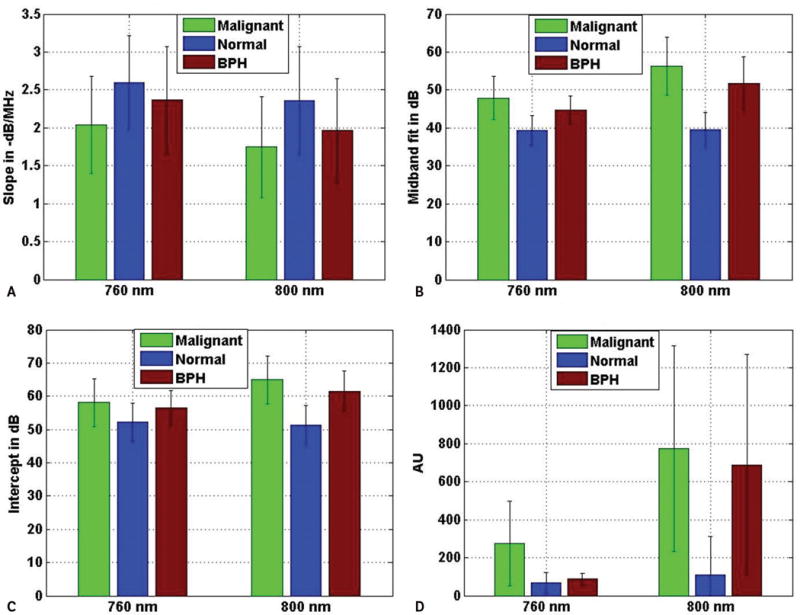
Average values of slope (A), midband fit (B), intercept (C), and photoacoustic pixel (D) corresponding to different tissue types at 2 different wavelengths. The error bars are the standard deviations of the corresponding parameters over the ROIs belonging to particular tissue types. AU indicates arbitrary unit.
Figure 8.
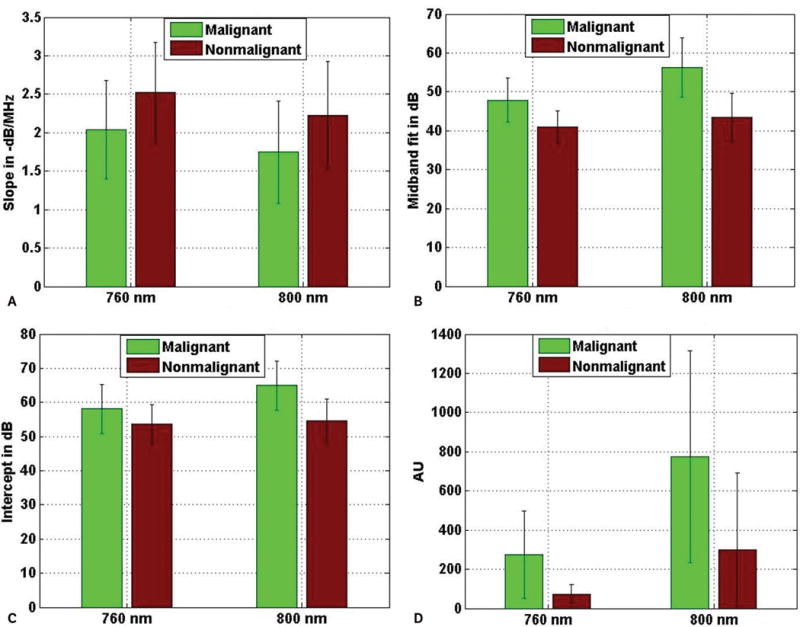
Average values of slope (A), midband fit (B), intercept (C), and photoacoustic pixel (D) corresponding to different tissue types at 2 different wavelengths. The error bars are the standard deviations of the corresponding parameters over the ROIs belonging to particular tissue types.
A 2-sample, 2-tailed t test was performed with the parameter values to find out whether there was a statistically significant difference between the parameters corresponding to ROIs of different tissue types. Figure 9 shows the results of the t test performed at a 5% significance level with the values of the 4 parameters corresponding to malignant versus normal, malignant versus BPH, BPH versus normal, and malignant versus nonmalignant.
Figure 9.
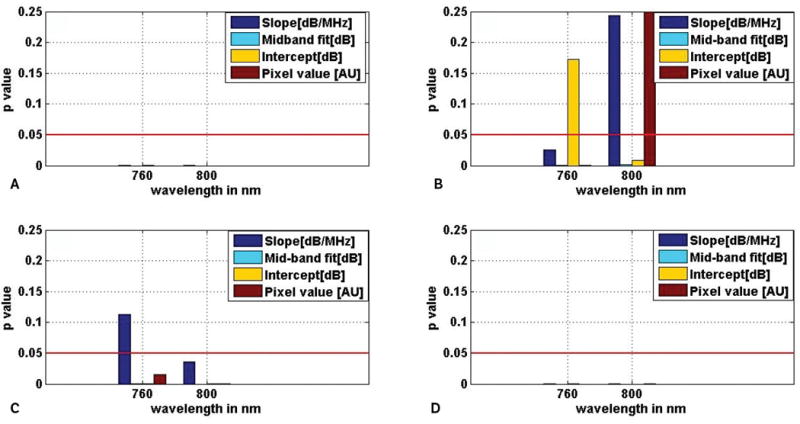
Comparison of spectral parameters between different prostate tissue types: malignant versus normal (A), malignant versus BPH (B), BPH versus normal (C), and malignant versus nonmalignant (D), using a 2-sample, 2-tailed t test. The red lines show the levels corresponding to the decision criterion (P = .05).
From Figure 9, it can be seen that between malignant and normal prostate tissue, all 4 parameters were significantly different (P < .05) at the 760 and 800 nm wavelengths. Between malignant prostate and BPH tissue, other than slope and pixel values at 800 nm and intercept at 760 nm, the remaining parameters were significantly different (P < .05) at both wavelengths. For BPH versus normal prostate, only the slope at 760 nm was not significantly different (P > .05) among the 4 different parameters at the different wavelengths. Between malignant and nonmalignant prostate, all 4 parameters at both wavelengths were significantly different (P < .05).
DISCUSSION
In this study, 2-sample, 2-tailed t tests were performed to test whether the parameters were significantly different for different tissue categories. For ease of discussion, each of the 4 parameters (slope, midband fit, intercept, and pixel value) at a particular wavelength is referred as a separate parameter. Therefore, for each pair of different tissue types, 2-sample, 2-tailed t tests were performed for 8 different parameters (4 parameters at 2 different wavelengths). Primarily, 3 pairs of tissue types, namely malignant versus normal prostate, malignant versus BPH, and BPH versus normal prostate, are considered here. For malignant versus normal prostate tissue, 8 of 8 parameters were significantly different (P < .05). For malignant versus BPH, 5 of 8 parameters were significantly different (P < .05), whereas for BPH versus normal prostate, 7 of 8 parameters were significantly different (P < .05). Since the primary focus of this study was to differentiate malignant prostate tissue from other types of prostate tissue, a separate tissue category called nonmalignant was created by combining all of the normal as well as BPH ROIs, and a statistical analysis was performed to determine whether the 8 parameters were significantly different between the 2 different tissue categories. In this case, all 8 parameters were found to be significantly different between malignant and nonmalignant prostate tissue. As far as the number of significantly different parameters are concerned, it is evident that the frequency domain analysis in this study was most effective in differentiating malignant from normal prostate, whereas it was least effective in differentiating malignant prostate from BPH. The tissue-type pair malignant versus nonmalignant could be differentiated with equal effectiveness as tissue-type pair malignant versus normal, as for these pairs of tissue types, the number of significantly different parameters was 8.
As mentioned earlier, 3 different spectral parameters, namely slope, midband fit and intercept, were used in this study to differentiate between different tissue types. For tissue characterization using photoacoustic imaging, the typical practice is to form grayscale photoacoustic images from the amplitudes of the envelope-detected radiofrequency photoacoustic data.38 Regions of interest corresponding to different tissue categories are compared by using the pixel values of the grayscale photoacoustic images. In this study, along with the spectral parameters, we tested whether the grayscale photoacoustic pixel values were significantly different between different tissue categories. When the performances of the parameters (slope, midband fit, intercept, and pixel value) were compared for differentiating between separate tissue categories, it was found that performance of midband fit was the best, as it was significantly different for all of the 4 tissue category pairs at both wavelengths. The corresponding Pvalues were very small also (maximum P = .0021; minimum P = 5.53 × 10−56). Performances of both photoacoustic pixel value and intercept were in second place after midband fit, as both of these parameters failed to differentiate between a pair of different tissue categories once. The performance of slope came in at third place, as it failed to differentiate between a pair of different tissue categories thrice.
As mentioned earlier, in this study, frequency domain analysis was performed on photoacoustic signals acquired at 2 wavelengths: 760 and 800 nm. If the performance of frequency domain analysis is compared between the wavelengths, from Figure 9, it is evident that the performance at 800 nm was better than that at 760 nm. Between malignant and BPH prostate, both at 760 and 800 nm, 1 spectral parameter was not significantly different. Between normal and BPH prostate, all 3 spectral parameters were significantly different at 800 nm, whereas slope was not significantly different at 760 nm. As for the tissue pairs malignant versus normal and malignant versus nonmalignant, all 3 spectral parameters were significantly different at both 760 and 800 nm. Therefore, considering all 4 different tissue pairs, performance of frequency domain analysis for tissue characterization was better at 800 than at 760 nm.
Figures 7 and 8 show that the average photoacoustic pixel value corresponding to malignant tissue was greater than that of nonmalignant tissue. Generally, malignant tissue growth is associated with extra growth of blood vessels,15 and this extra blood content, due to its high optical absorption property, produces photoacoustic signals with higher amplitudes than photoacoustic signals generated by normal tissue. It is also evident from Figures 7 and 8, that average values of midband fit and intercept corresponding to malignant tissue were also greater than that corresponding to normal tissue. As explained in the following section, both midband fit and intercept depend on the optical absorption property of the tissue constituents, which may be the reason why average values of theses parameters were greater for malignant tissue than normal tissue. On the other hand, slope is independent of the optical absorption property. Here, the average slope values corresponding to normal tissue were greater than that corresponding to malignant tissue.
Using the analytical expression for the time-dependent photoacoustic signal generated by spherical photoacoustic absorber, we can try to discuss the importance of the spectral parameters for tissue characterization:
| (2) |
Equation 2 gives the analytical expression of the time dependent PA signal generated by a spherical PA absorber where μa, β and Cp represent optical absorption coefficient, isobaric volume expansion coefficient and heat capacity per unit mass of the absorber, while c and E0 represent the velocity of PA wave inside the absorber and input laser fluence received by the absorber. Radius of the absorber and the distance between the observation point and the center of the absorber are represented by r and rd. The time dependent PA amplitude is represented by p(t). The amplitude spectrum of the PA signal can be found out by taking Fourier transform of Equation 2.
| (3) |
Equation 3 represents the amplitude spectrum of the photoacoustic signal generated by a spherical absorber, where P(f) represents the amplitude spectrum of the timedependent photoacoustic signal.
The power spectrum of the photoacoustic signal in dB scale is given by Equation 4:
| (4) |
Combining Equations 3 and 4, a more elaborate expression for the power spectrum of the photoacoustic signal, represented by Equation 5, can be obtained:
| (5) |
Where
Now, for computing the spectral parameters, the right side of Equation 5 is fitted to a straight line, and the slope, intercept, and midband fit are extracted from the straight line. It is evident that slope only depends on log[g(f)], as the remaining terms of Equation 5 are independent of frequency; thus, slope is independent of the absorption coefficient μa of the absorber. Intercept is determined by the frequency-independent terms: ie, log[μa] and log[r2]. Along with log[g(f)], midband fit depends on log[μa] and log[r2]. As slope is independent of the absorption property and only depends on the dimension of the absorber, it is generally regarded as the most useful among the 3 spectral parameters for providing information about the size of the absorber and consequently differentiating between different pathologic tissue types, assuming absorber size changes with the tissue type. According to Equation 2, the photoacoustic pixel values of a grayscale photoacoustic image are generally considered to be dependent on the absorption coefficient of the tissue but independent of the absorber diameter. Therefore, for tissue characterization, midband fit and intercept parameters may be regarded as superior to the photoacoustic pixel value because of their combined dependence on both the absorption coefficient and absorber diameter through the terms log[μa] and log[r2].
In this study, we performed experiments with freshly excised human prostate samples. Although the potential for tissue differentiation has been demonstrated ex vivo, we believe it can be extended to in vivo situations also but with certain caveats. For an in vivo study, the corresponding photoacoustic spectral parameters may change from those of the ex vivo study because of the changes in tissue physiologic characteristics and the presence of overlying tissue on the ROI. Due to the optical scattering and absorption properties, the overlying tissue substantially affects the input laser fluence, which in turn affects the photoacoustic signal generated by the ROI. For our experimental study, we incorporated a 1D model to correct for the wavelength dependent laser light attenuation inside the tissue. Since we performed experiments with thin excised tissue specimens, the 1D correction model is sufficient. For an in vivo study, however, a detailed 2D or 3D model-based optical inversion scheme20,39 may be required to correct for the effect of the overlying tissue on the input laser fluence. For in vivo human prostate imaging, instead of transillumination mode photoacoustic imaging, reflection mode photoacoustic imaging has to be implemented. In that case, noninvasive laser light delivery to the human prostate is always a challenge.40,41 As mentioned earlier, an elaborate data correction scheme has to be implemented for in vivo prostate imaging to correct for the nonuniform laser illumination caused by the overlying tissue. This study was limited to an analysis of photoacoustic signal frequencies in the range of 2.4 to 7.4 MHz. This range is compatible with what is used in clinical US imaging, and we believe this limitation will also apply to clinical photoacoustic imaging.
In conclusion, we can say that the results of this experimental study indicate that the spectral parameters as well as the photoacoustic pixel values extracted from 3D photoacoustic data generated by freshly excised human prostates can differentiate malignant prostate tissue from BPH as well as normal prostate tissue.
Acknowledgments
We thank Jorge L. Yao, MD, for histologic analysis and Maria Helguera, PhD, for providing essential guidance for implementing statistical analysis of the data. This work was partially supported by a research seed grant awarded by the Radiological Society of North America and an instrumentation grant from the Lang Memorial Foundation.
References
- 1.American Cancer Society. Key statistics for prostate cancer. American Cancer Society Website. http://www.cancer.org/cancer/prostatecancer/detailedguide/prostate-cancer-key-statistics. Accessed May 17, 2015.
- 2.Halpern EJ. Contrast-enhanced ultrasound imaging of prostate cancer. Rev Urol. 2006;8(suppl 1):S29–S37. [PMC free article] [PubMed] [Google Scholar]
- 3.Presti JC. Prostate biopsy: current status and limitations. Rev Urol. 2007;9:93–98. [PMC free article] [PubMed] [Google Scholar]
- 4.Patel U. TRUS and prostate biopsy: current status. Prostate Cancer Prostatic Dis. 2004;7:208–210. doi: 10.1038/sj.pcan.4500728. [DOI] [PubMed] [Google Scholar]
- 5.Brock M, von Bodman C, Palisaar RJ, et al. The impact of real-time elastography guiding a systematic prostate biopsy to improve cancer detection rate: a prospective study of 353 patients. J Urol. 2012;187:2039–2043. doi: 10.1016/j.juro.2012.01.063. [DOI] [PubMed] [Google Scholar]
- 6.Yi A, Kim JK, Park SH, et al. Contrast-enhanced sonography for prostate cancer detection in patients with indeterminate clinical findings. AJR Am J Roentgenol. 2006;186:1431–1435. doi: 10.2214/AJR.04.1959. [DOI] [PubMed] [Google Scholar]
- 7.Hou AH, Swanson D, Barqawi AB. Modalities for imaging of prostate cancer. Adv Urol. 2009;818065:1–12. doi: 10.1155/2009/818065. [DOI] [PMC free article] [PubMed] [Google Scholar]
- 8.Hricak H, Choyke PL, Eberhardt SC, Leibel SA, Scardino PT. Imaging prostate cancer: a multidisciplinary perspective. Radiology. 2007;243:28–53. doi: 10.1148/radiol.2431030580. [DOI] [PubMed] [Google Scholar]
- 9.Zackrisson S, van de Ven SM, Gambhir SS. Light in and sound out: emerging translational strategies for photoacoustic imaging. Cancer Res. 2014;74:979–1004. doi: 10.1158/0008-5472.CAN-13-2387. [DOI] [PMC free article] [PubMed] [Google Scholar]
- 10.Valluru KS, Chinni BK, Rao NA. Photoacoustic imaging: opening new frontiers in medical imaging. J Clin Imaging Sci. 2011;1:1–24. doi: 10.4103/2156-7514.80522. [DOI] [PMC free article] [PubMed] [Google Scholar]
- 11.Xu M, Wang LV. Photoacoustic imaging in biomedicine. Rev Sci Instrum. 2006;77:041101-1–041101-22. [Google Scholar]
- 12.Beard P. Biomedical photoacoustic imaging. Interface Focus. 2011;1:602–631. doi: 10.1098/rsfs.2011.0028. [DOI] [PMC free article] [PubMed] [Google Scholar]
- 13.Diebold GJ, Sun T. Properties of photoacoustic waves in one, two, and three dimensions. Acta Acust. 1994;80:339–351. [Google Scholar]
- 14.Valluru KS, Chinni BK, Rao NA, Bhatt S, Dogra VS. Basics and clinical applications of photoacoustic imaging. Ultrasound Clin. 2009;4:403–429. [Google Scholar]
- 15.Wang L, editor. Photoacoustic Imaging and Spectroscopy. Boca Raton, FL: CRC Press; 2009. [Google Scholar]
- 16.Hu S, Wang LV. Photoacoustic imaging and characterization of the microvasculature. J Biomed Opt. 2010;15:011101. doi: 10.1117/1.3281673. [DOI] [PMC free article] [PubMed] [Google Scholar]
- 17.Laufer J, Elwell C, Delpy D, Beard P. In vitro measurements of absolute blood oxygen saturation using pulsed near-infrared photoacoustic spectroscopy: accuracy and resolution. Phys Med Biol. 2005;50:4409–4428. doi: 10.1088/0031-9155/50/18/011. [DOI] [PubMed] [Google Scholar]
- 18.Allen TJ, Hall A, Dhillon AP, Owen JS, Beard PC. Spectroscopic photoacoustic imaging of lipid-rich plaques in the human aorta in the 740 to 1400 nm wavelength range. J Biomed Opt. 2012;17:0612091. doi: 10.1117/1.JBO.17.6.061209. [DOI] [PubMed] [Google Scholar]
- 19.Zhang HF, Maslov K, Sivaramakrishnan M, Stoica G, Wang LV. Imaging of hemoglobin oxygen saturation variations in single vessels in vivo using photoacoustic microscopy. Appl Phys Lett. 2007;90:053901. [Google Scholar]
- 20.Cox B, Laufer JG, Arridge SR, Beard PC. Quantitative spectroscopic photoacoustic imaging: review. J Biomed Opt. 2012;17:0612021. doi: 10.1117/1.JBO.17.6.061202. [DOI] [PubMed] [Google Scholar]
- 21.Lizzi FL. Ultrasonic scatterer-property images of the eye and prostate. Proc IEEE Ultrason Symp. 1997;2:1109–1117. [Google Scholar]
- 22.Lizzi FL, Feleppa EJ, Alam SK, Deng CX. Ultrasonic spectrum analysis for tissue evaluation. Pattern Recogn Lett. 2003;24:637–658. [Google Scholar]
- 23.Silverman RH, Kong F, Lloyd HO, Chen YC. Proceedings of the BiOS International Society for Optics and Photonics Conference. Bellingham, WA: International Society for Optics and Photonics; 2010. Fine-resolution photoacoustic imaging of the eye; p. 75640Y. [Google Scholar]
- 24.Kumon RE, Deng CX, Wang X. Frequency-domain analysis of photoacoustic imaging data from prostate adenocarcinoma tumors in a murine model. Ultrasound Med Biol. 2011;37:834–839. doi: 10.1016/j.ultrasmedbio.2011.01.012. [DOI] [PMC free article] [PubMed] [Google Scholar]
- 25.Yang Y, Wang S, Tao C, Wang X, Liu X. Photoacoustic tomography of tissue subwavelength microstructure with a narrowband and low frequency system. Appl Phys Lett. 2012;101:034105. [Google Scholar]
- 26.Xu G, Dar IA, Tao C, Liu X, Deng CX, Wang X. Photoacoustic spectrum analysis for microstructure characterization in biological tissue: a feasibility study. Appl Phys Lett. 2012;101:221102. doi: 10.1063/1.4768703. [DOI] [PMC free article] [PubMed] [Google Scholar]
- 27.Hysi E, Saha RK, Kolios MC. Photoacoustic ultrasound spectroscopy for assessing red blood cell aggregation and oxygenation. J Biomed Opt. 2008;17:125006. doi: 10.1117/1.JBO.17.12.125006. [DOI] [PubMed] [Google Scholar]
- 28.Chitnis PV, Mamou J, Sampathkumar A, Feleppa EJ. Proceedings of the BiOS International Society for Optics and Photonics Conference. Bellingham, WA: International Society for Optics and Photonics; 2014. Spectrum analysis of photoacoustic signals for tissue classification; p. 89432J. [Google Scholar]
- 29.Xu G, Meng Z, Lin J, Carson P, Wang X. Proceedings of the BiOS International Society for Optics and Photonics Conference. Bellingham, WA: International Society for Optics and Photonics; 2014. Functional pitch of a liver: fatty liver disease diagnosis with photoacoustic spectrum analysis; p. 89431G. [Google Scholar]
- 30.Dogra VS, Chinni BK, Valluru KS, et al. Multispectral photoacoustic imaging of prostate cancer: preliminary ex vivo results. J Clin Imaging Sci. 2013;3:41. doi: 10.4103/2156-7514.119139. [DOI] [PMC free article] [PubMed] [Google Scholar]
- 31.Sinha S, Rao NA, Valluru KS, Chinni BK, Dogra VS, Helguera M. Proceedings of the SPIE Medical Imaging Conference. Bellingham, WA: International Society for Optics and Photonics; 2014. Frequency analysis of multispectral photoacoustic images for differentiating malignant region from normal region in excised human prostate; p. 90400. [Google Scholar]
- 32.Sinha S, Rao NA, Chinni B, Moalem J, Giampolli EJ, Dogra V. Proceedings of the Western New York Image Processing Workshop. Piscataway, NJ: Institute of Electrical and Electronics Engineers; 2013. Differentiation between malignant and normal human thyroid tissue using frequency analysis of multispectral photoacoustic images; pp. 5–8. [Google Scholar]
- 33.American National Standards Institute. ANSI Z136.1: American National Standard for the Safe Use of Lasers. Washington, DC: American National Standards Institute; 2007. [Google Scholar]
- 34.Nachabé R, Harbers R, Desjardins AE, van der Voort M, Braun GA, Hendriks BH. Proceedings of the BiOS International Society for Optics and Photonics Conference. Bellingham, WA: International Society for Optics and Photonics; 2009. Extracting optical properties from diffuse optical spectroscopy; p. 71871C. [Google Scholar]
- 35.Vogel A, Venugopalan V. Mechanisms of pulsed laser ablation of biological tissues. Chem Rev. 2003;103:577–644. doi: 10.1021/cr010379n. [DOI] [PubMed] [Google Scholar]
- 36.Oregon Medical Laser Center. Optical properties spectra. Oregon Medical Laser Center website. http://omlc.org. Accessed May 14, 2015.
- 37.Svensson T, Alerstam E, Einarsdottir M, Svanberg K, Andersson-Engels S. Towards accurate in vivo spectroscopy of the human prostate. J Biophoton. 2008;1:200–203. doi: 10.1002/jbio.200710025. [DOI] [PubMed] [Google Scholar]
- 38.Oraevsky AA, Savateeva EV, Solomatin SV, et al. Proceedings of the International Symposium on Biomedical Optics. Bellingham, WA: International Society for Optics and Photonics; 2002. Optoacoustic imaging of blood for visualization and diagnostics of breast cancer; pp. 81–94. [Google Scholar]
- 39.Cox BT, Arridge SR, Beard PC. Estimating chromophore distributions from multiwavelength photoacoustic images. J Opt Soc Am A Opt Image Sci Vis. 2009;26:443–455. doi: 10.1364/josaa.26.000443. [DOI] [PubMed] [Google Scholar]
- 40.Wang X, Roberts WW, Carson PL, et al. Photoacoustic tomography: a potential new tool for prostate cancer. Biomed Opt Express. 2010;1:1117–1126. doi: 10.1364/BOE.1.001117. [DOI] [PMC free article] [PubMed] [Google Scholar]
- 41.Yaseen MA, Sergey AE, Hans-Peter B, et al. Optoacoustic imaging of the prostate: development toward image-guided biopsy. J Biomed Opt. 2010;15:021310. doi: 10.1117/1.3333548. [DOI] [PMC free article] [PubMed] [Google Scholar]


