

Abstract
Diffuse optical imaging through centimeters of tissue has emerged as a powerful tool in biomedical research. However, applications in the operating theater have been limited in part due to data set requirements and computational burden. We present an approach that uses a small number of optical source-detector pairs that allows for the fast localization of arteries in the roof of the mouth and has the potential to reduce complications during oral surgery. The arteries are modeled as multiple-point absorbers, allowing localization of their complex shapes. The method is demonstrated using a printed tissue-simulating mouth phantom. Furthermore, we use the extracted position information to fabricate a custom surgical guide using 3D printing that could protect the arteries during surgery.
OCIS codes: (170.1850) Dentistry, (170.3880) Medical and biological imaging, (110.0113) Imaging through turbid media, (100.3010) Image reconstruction techniques, (100.3190) Inverse problems, (160.5470) Polymers
1. INTRODUCTION
Diffuse optical imaging (DOI) is the extraction of information from measurements of light that has traveled through scattering media such as tissue [1,2]. Instrumentation for DOI is typically inexpensive and safe, and related technology has been used to develop the highly successful pulse oximetry devices [3]. In DOI methods such as diffuse optical tomography (DOT), near-infrared or visible light is used to form volumetric images in deep (>1 cm) tissue by treating photons as diffusing particles [4–6]. However, this is a computationally intensive process, limiting its application in surgery, where information is often needed in real time. For this reason, fast localization methods are an attractive alternative, where information about the location only is extracted using a small measurement data set [7,8]. Here, we present optical localization as a means for finding the greater palatine artery (GPA) in the roof of the mouth, thereby addressing the need for this information in dental surgery. We also describe use of this information to 3D print a surgical guide to aid the surgeon.
The GPA is an important imaging target because it is an anatomical landmark for oral surgery. The depth of the GPA varies, but it is about 5 mm into the roof of the mouth [9], and is not visible with the naked eye. Along with the greater palatine nerve (GPN), it forms the greater palatine neurovascular bundle (GPB), which emerges from the pterygopalatine fossa through the greater palatine foramen and runs anteriorly and anastomoses with branches of the nasopalatine bundle from the nasopalatine canal [10]. The location of the GPB is associated with the height of the palatal vault, ranging from 7 to 17 mm from the cementoenamel junctions of the maxillary premolars and molars [11]. Currently, a surgeon must rely on prior knowledge of the GPB location to avoid damaging it. However, a recent study with human cadavers showed a discrepancy in the location of the GPB of up to 4 mm [12]. For these reasons, localization of the GPA in a patient will assist clinicians in pre-surgical planning and reduce complications during surgeries such as a periodontal and oral surgeries, sinus and ridge augmentations, GPN block, soft tissue biopsies, dental implant, and wisdom teeth removal.
In Section 2, we describe the localization procedure used to find the GPA, as well as the mouth phantom fabrication method and the experimental setup. In Section 3, we present results for the localization of the GPA in the mouth phantom, and we use this information to print a surgical guide for assisting a surgeon.
2. METHODS
A. Optical Localization
The optical parameters of interest in DOI are the absorption coefficient μa and the reduced scattering coefficient . These parameters characterize a diffusion equation that can describe the propagation of light within a highly scattering medium [1,5]. For an unmodulated or CW light source, the diffusion equation reduces to
| (1) |
where r denotes the position, ϕ (W/mm2) is the photon flux density, is the diffusion coefficient, and a unit amplitude Dirac delta function optical excitation (with implied scaling) at position rs is assumed.
Localization of the GPA is possible because the μa of the blood in the GPA is higher than the background tissue [13]. The problem then becomes an estimation of the position of an absorption inhomogeneity. Previously, Cao et al. [8] described localization of a point absorber, and we extend this treatment to the localization of absorption inhomogeneities with complex geometries. We accomplish this by modeling the absorption inhomogeneity with multiple point absorbers instead of just one.
We assume the inhomogeneity is embedded in a locally homogeneous background having known parameters μao and Do such that μa(r) = μao + Δμa(r), where Δμa is a change in the absorption due to the inhomogeneity. After substitution into Eq. (1), moving the Δμa term to the right-hand side, assuming that , and applying the Born approximation [14], the photon flux becomes
| (2) |
where ϕi is the photon flux in a homogeneous background and g(r; r′; μao) is the Green’s function for the homogeneous diffusion equation with (Dirac) source location r′. In order to form an analytical solution for fast computation [8], we assume that the inhomogeneity has constant Δμa and can be represented by L point absorbers at positions ral such that
| (3) |
The forward model for a measurement at position r can then be written as
| (4) |
where yo=ϕi(r;μao ), and Ra contains the L positions ral. f ′(Ra) is a compact Fréchet derivative representing sensitivity at the detector to variations in absorption at the discrete points over which the absorbing inhomogeneity is described.
The maximum likelihood (ML) estimate of the positions describing the inhomogeneity, Ra, can be formulated as the minimization of the cost function
| (5) |
where y is a vector of N measurements, yo is a vector of N expected measurements yo, f ′(Ra) is a vector of N expected f ′(Ra), Λ−1 = α diag[|y1|;…; |yN |] is the noise covariance matrix, for which we assume a shot noise model characterized by α [5], and for an arbitrary vector v, , where H denotes the Hermitian transpose.
A two-step procedure can be used to solve this optimization problem [7,8], where for each combination of positions ral within a region of interest estimates are formed as
| (6) |
| (7) |
The ML estimates become
| (8) |
| (9) |
In practice, constraints are required in order to reduce the complexity of the minimization. Because R̂a is the parameter of interest, all linear dependencies in the problem are encapsulated in Δμ̂a, including the excitation power, Green’s function scalars, source-detector coupling into the medium, and the system parameter α [5,7].
We consider the reflection measurement geometry of Fig. 1, where a detector is at position r. In a typical experiment, there are multiple sources and detectors, resulting in N measurements. For simplicity and fast computation, we use an analytical solution to Eq. (1) in an infinite homogeneous domain as the forward model [7], giving
Fig. 1.

Localization geometry for a single point absorber (●) used to derive the forward model. An isotropic excitation source (X) and detector (O) are placed one scattering length, l* = 3Do, below the boundary [7].
| (10) |
| (11) |
where , r1l is the distance from the excitation source to the lth point absorber, and r2l is the distance from the l th point absorber to the detector.
A more sophisticated analytical forward model could be implemented for improved localization accuracy [15]. For example, an extrapolated zero flux (ϕ = 0) boundary condition (describing the scattering medium interface with free space) can be enforced with the placement of image excitation and absorption sources [16–18]. Numerical methods such as the finite element method would allow for better solutions in complex, heterogeneous scattering media [19]. Additionally, the laser beam profile could be included in the model. However, for the work presented here, we found that Eqs. (10) and (11) were sufficient for demonstrating the localization method.
B. Mouth Phantom Fabrication
To test our approach for the localization of the GPA, we fabricated a mouth phantom using a Form 1+ 3D printer (Formlabs). The phantom was printed using standard white photopolymer resin. By printing a slab of material and fitting experimental time-gated measurements to the analytical transmittance [20], we found the optical parameters to be μao = 0.0076 mm−1 and Do = 0.166 mm at 633 nm (similar to other tissues, such as those in the breast and brain [21,22]). To our knowledge, these parameters have not been measured for bulk gingiva tissue. However, if they were known, there is a procedure to fabricate the appropriate phantom [23].
The phantom was designed with planar cylindrical cavities of diameter 2.65 mm to simulate the GPA [9,10], as shown in Fig. 2(a). The cavities were filled with a mixture of water and India ink (Higgins, 0.0018 (g/mL) density) [24], simulating the absorption of blood at 633 nm, which is 0.7 mm−1 for a 40% hematocrit level [13]. Figure 2(b) shows the printed mouth phantom. Visual inspection of Fig. 2(b) suggests that μao of the mouth phantom is less than gum tissue because the absorption inhomogeneities are visible under room light. However, the phantom is still useful for development of the localization approach.
Fig. 2.

3D printed mouth phantom. (a) Slice of the printing profile showing the planar cylindrical cavities. The phantom was printed in approximately 6 h. (b) Phantom with absorbing inhomogeneities simulating the GPA.
C. Experimental Setup
We measured scattered light at 633 nm reflected from the mouth phantom using the experimental setup shown in Fig. 3. The laser spot had a diameter of about 1 mm. For high signal levels, quasi-CW data (repetition rate 20 MHz, camera exposure time 25 ms) was detected using a filtered pulsed supercontinuum laser. The average power of the laser was about 15 mW. The CCD camera allows for more measurements (detectors) compared with a fiber-based system. A laser line scanner was used to measure the surface topography and project the camera pixels (detectors) to the phantom’s surface for the reconstruction [20,25]. A motorized mirror enables automation of the data capture and repeated measurements with the same source location.
Fig. 3.

DOI experimental setup. An EXR-20 pulsed supercontinuum fiber laser and VARIA tunable filter (NKT Photonics) emit light at 633 nm with 10 nm bandwidth. The scattered light is detected by a CCD camera (Roper PIMAX). The motorized mirror (Zaber) is used to control the source location.
Referring to Fig. 2, two measurement sets were acquired, one with sources and detectors in the vicinity of the left absorption inhomogeneity and the other with sources and detectors in the vicinity of the right. These two measurement sets were used to localize the left and right arteries, respectively. Source-detector pairs with rsd < 10l*, where l*= 3Do, were excluded in order to minimize the contribution of the ballistic light. Using this procedure, the left measurement set contained NL = 473 measurements using 7 sources and 80 detectors, and the right measurement set contained NR = 407 measurements using 7 sources and 60 detectors. The number of detectors could be minimized using a sensitivity analysis [8], reducing the computational time.
Both the left and right measurement data sets (referring to Fig. 2) were calibrated in order to account for the source and detector coupling to the scattering medium [20]. Data , where n is the data index, was captured from the mouth phantom before the India ink and water were added. Then, the left and right uncalibrated measurement sets were calibrated according to , where are uncalibrated data from either the left or right measurement set and are corresponding simulated data (in this case equal to yo). For a simple geometry, [ ] may be approximately constant for each n. In this case, the calibration becomes , where β is a constant that can be absorbed into Δμ̂a, in Eq. (9), removing the need for measuring . However, we found that calibration was necessary for localization in the phantom of Fig. 2. In the clinic, data from the phantom in Fig. 2 could be captured a priori and used for the calibration.
3. RESULTS
A. Constrained Localization
In order to localize the absorption inhomogeneities in the mouth phantom, we constrained the problem to the localization of absorbing line sources. Each line source is represented by L = 10 point absorbers and is characterized by its starting position (xa; ya; za), its azimuthal angle ψ, and its length R, as shown in Fig. 4. We further constrained the problem by selecting ya = 0 and R = 30 mm, and used the left and right calibrated data sets to localize the left and right absorbing line sources, respectively. Specifically, Eq. (6) and then Eq. (7) were calculated for each (xa; za; ψ) in a region of interest for each absorbing line source. The position of each absorbing line source was then estimated using Eq. (8). The result of this localization procedure is shown in Fig. 5. Figures 5(a) and 5(b) show plots of Eq. (7), over the region of interest, for the left and right absorbing line sources, respectively. In order to show two dimensional plots, ψ was fixed such that the x–z planes contained the minimum of Eq. (7). Figures 5(c) and 5(d) show the localized absorbing line sources plotted with the surface profile used to fabricate the mouth phantom. The minimum distance between the estimated and actual positions is about 0.8 mm, and the maximum distance is about 3.9 mm. The better quality of the data set involved with Fig. 5(a) produced a better localization result than that for Fig. 5(b), consistently the case, possibly due to the accuracy of the laser line scan profile used to determine the detector positions. The result is promising given the approximations made in the forward model, the complicated geometry, and the high absorption of the simulated blood.
Fig. 4.
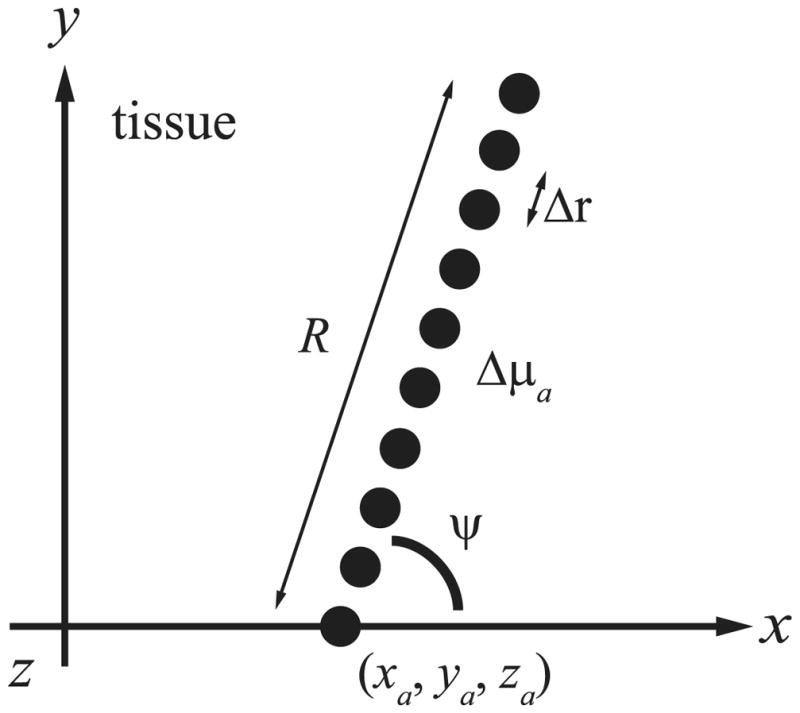
Constrained geometry for the localization of an absorbing line source represented by L = 10 point absorbers. The positions ralof the point absorbers (●) are separated by Δr along a line of length R starting at (xa; ya; za) with azimuthal angle ψ. The polar angle (not shown) is fixed at π/2 rad.
Fig. 5.

Localizations using data captured above the left and right absorption inhomogeneities in the printed mouth phantom. (a) Plot of Eq. (7) with ψ = 1.14 rad using the left data set. (b) Plot of Eq. (7) with ψ = 1.73 rad using the right data set. The plots show the x–z planes that contained the minimum of Eq. (7). From Eq. (8), the position that minimizes Eq. (7) is the estimated location. The black dots show the actual positions. For each (xa; za) shown, Eq. (7) was evaluated for ψ from 0 to π/2 rad in (a) and π/2 to π in (b). Note that, from Fig. 4, we have selected ya = 0. (c)Mouth phantom boundary plotted with the localized absorption line sources (red dots) and the true locations (dashed black lines). (d) Another view. The localization error is likely due to assumptions in the forward model and the high μa of the simulated blood.
The localization in Fig. 5 is based on a model constrained to an absorbing line source, but the constraint could be relaxed or modified to extract the more complicated vascular structure of the GPA in a real patient. Alternatively, point absorbers within the vascular structure could be localized individually [8,26], for example, by using a borescope.
B. Printed Surgical Guide
Surgical guides can improve the success rate of surgery by transferring anatomical information to the operating theater. For example, surgical guides have found widespread use in the placement of dental implants, where they facilitate proper positioning in the bone and can assist in diagnosis and treatment planning [27]. Methods include 3D printing of surgical guides from CT scans using stereolithography, which was found to improve implant placement compared with conventional methods [28]. However, to our knowledge, surgical guides have not been fabricated for protecting the GPA. We demonstrate in Fig. 6 that the data extracted using localization can be used to fabricate such a guide. The guide was designed by projecting the localized absorption line sources to the mouth phantom surface and selecting points on the surface less than the radial distance of the GPA away from the projected line. Additional points were added in the +z direction above these points to increase the thickness, and the resulting surface profile was converted into a stereolithography (STL) file, which was used to 3D print the design. This surgical guide could assist with oral surgery by providing information on the location of the GPA and obstructing its location so that it and the GPN cannot be damaged. Practically, the guide should be improved so that it can be fastened to the roof of the mouth in a patient.
Fig. 6.

3D printed surgical guide to protect the GPA. (a) Surgical guide design. Blue lines are the estimated locations of the absorption line sources, and the dark blue isoimage is the surgical guide. The isoimage was formed by projecting the blue lines to the phantom surface. (b) Photo of the mouth phantom and 3D printed surgical guide. The lateral space in the roof of the mouth is occluded by the guide so that the surgeon does not accidentally cut the GPA/GPN.
C. Conclusion
We have presented a DOI method for fast 3D localization of obscured absorption inhomogeneities. The inhomogeneities are treated as a superposition of point absorbers with locations that can be constrained using prior information in order to reduce the computational burden. We showed that it is possible to localize absorbing line inhomogeneities within a highly scattering 3D printed mouth phantom from calibrated experimental data, which has relevance for oral surgery. Furthermore, we showed that the position information can be used to fabricate a surgical guide using 3D printing to protect the GPA during surgery. In principle, the method could be employed in a clinic using a bright light source and a camera or small probe. Images of the arteries could be viewed in real time, and a custom surgical guide could be fabricated for a return visit. It is possible to localize lesions in addition to blood vessels, and the specificity could be improved with topical fluorescence or absorption contrast agents. The method also may be useful for identifying operative and postoperative bleeding [29].
Acknowledgments
Funding. National Science Foundation (NSF) (CBET-0854249, CISE-1218909, CISE-1618908); National Institutes of Health (NIH) (1R21CA182235-01A1).
We thank Alfonso Costas and Jose M. Garcia for printing the surgical guide in Fig. 6, and the BoilerMAKER Lab at Purdue University. We also would like to thank Adam B. Milstein for his valuable input.
References
- 1.Gibson AP, Hebden JC, Arridge SR. Recent advances in diffuse optical imaging. Phys Med Biol. 2005;50:R1–R43. doi: 10.1088/0031-9155/50/4/r01. [DOI] [PubMed] [Google Scholar]
- 2.Ntziachristos V. Going deeper than microscopy: the optical imaging frontier in biology. Nat Methods. 2010;7:603–614. doi: 10.1038/nmeth.1483. [DOI] [PubMed] [Google Scholar]
- 3.Tremper KK. Pulse oximetry. Chest. 1989;95:713–715. doi: 10.1378/chest.95.4.713. [DOI] [PubMed] [Google Scholar]
- 4.Arridge SR. Optical tomography in medical imaging. Inverse Prob. 1999;15:R41–R93. [Google Scholar]
- 5.Ye JC, Webb KJ, Bouman CA, Millane RP. Optical diffusion tomography by iterative-coordinate-descent optimization in a Bayesian framework. J Opt Soc Am A. 1999;16:2400–2412. [Google Scholar]
- 6.Tsai EHR, Bentz BZ, Chelvam V, Gaind V, Webb KJ, Low PS. In vivo mouse fluorescence imaging for folate-targeted delivery and release kinetics. Biomed Opt Express. 2014;5:2662–2678. doi: 10.1364/BOE.5.002662. [DOI] [PMC free article] [PubMed] [Google Scholar]
- 7.Milstein AB, Kennedy MD, Low PS, Bouman CA, Webb KJ. Statistical approach for detection and localization of a fluorescing mouse tumor in Intralipid. Appl Opt. 2005;44:2300–2310. doi: 10.1364/ao.44.002300. [DOI] [PubMed] [Google Scholar]
- 8.Cao G, Gaind V, Bouman CA, Webb KJ. Localization of an absorbing inhomogeneity in a scattering medium in a statistical framework. Opt Lett. 2007;32:3026–3028. doi: 10.1364/ol.32.003026. [DOI] [PubMed] [Google Scholar]
- 9.Cho KH, Yu SK, Lee MH, Lee DS, Kim HJ. Histological assessment of the palatal mucosa and greater palatine artery with reference to subepithelial connective tissue grafting. Anat Cell Biol. 2013;46:171–176. doi: 10.5115/acb.2013.46.3.171. [DOI] [PMC free article] [PubMed] [Google Scholar]
- 10.Klosek SK, Rungruang T. Anatomical study of the greater palatine artery and related structures of the palatal vault: considerations for palate as the subepithelial connective tissue graft donor site. Surg Radiol Anat. 2009;31:245–250. doi: 10.1007/s00276-008-0432-4. [DOI] [PubMed] [Google Scholar]
- 11.Reiser GM, Bruno JF, Mahan PE, Larkin LH. The subepithelial connective tissue graft palatal donor site: anatomic considerations for surgeons. Int J Periodontics Restor Dent. 1996;16:130–137. [PubMed] [Google Scholar]
- 12.Fu JH, Hasso DG, Yeh CY, Leong DJ, Chan HL, Wang HL. The accuracy of identifying the greater palatine neurovascular bundle: a cadaver study. J Periodontol. 2011;82:1000–1006. doi: 10.1902/jop.2011.100619. [DOI] [PubMed] [Google Scholar]
- 13.Roggan A, Friebel M, Dörschel K, Hahn A, Muller G. Optical properties of circulating human blood in the wavelength range 400–2500 nm. J Biomed Opt. 1999;4:36–46. doi: 10.1117/1.429919. [DOI] [PubMed] [Google Scholar]
- 14.Ye J, Webb K, Millane R, Downar T. Modified distorted Born iterative method with an approximate Fréchet derivative for optical diffusion tomography. J Opt Soc Am A. 1999;16:1814–1826. [Google Scholar]
- 15.Ripoll J, Ntziachristos V, Carminati R, Nieto-Vesperinas M. Kirchhoff approximation for diffusive waves. Phys Rev E. 2001;64:051917. doi: 10.1103/PhysRevE.64.051917. [DOI] [PubMed] [Google Scholar]
- 16.Patterson MS, Chance B, Wilson BC. Time resolved reflectance and transmittance for the non-invasive measurement of tissue optical properties. Appl Opt. 1989;28:2331–2336. doi: 10.1364/AO.28.002331. [DOI] [PubMed] [Google Scholar]
- 17.Haskell RC, Svaasand LO, Tsay TT, Feng TC, Tromberg BJ, McAdams MS. Boundary conditions for the diffusion equation in radiative transfer. J Opt Soc Am A. 1994;11:2727–2741. doi: 10.1364/josaa.11.002727. [DOI] [PubMed] [Google Scholar]
- 18.Zhang A, Piao D, Bunting CF, Pogue BW. Photon diffusion in a homogeneous medium bounded externally or internally by an infinitely long circular cylindrical applicator. I. Steady-state theory. J Opt Soc Am A. 2010;27:648–662. doi: 10.1364/JOSAA.27.000648. [DOI] [PubMed] [Google Scholar]
- 19.Schweiger M, Arridge S. The Toast++ software suite for forward and inverse modeling in optical tomography. J Biomed Opt. 2014;19:040801. doi: 10.1117/1.JBO.19.4.040801. [DOI] [PubMed] [Google Scholar]
- 20.Bentz BZ, Chavan AV, Lin D, Tsai EH, Webb KJ. Fabrication and application of heterogeneous printed mouse phantoms for whole animal optical imaging. Appl Opt. 2016;55:280–287. doi: 10.1364/AO.55.000280. [DOI] [PMC free article] [PubMed] [Google Scholar]
- 21.Nguyen TT, Le HN, Vo M, Wang Z, Luu L, Ramella-Roman JC. Three-dimensional phantoms for curvature correction in spatial frequency domain imaging. Biomed Opt Express. 2012;3:1200–1214. doi: 10.1364/BOE.3.001200. [DOI] [PMC free article] [PubMed] [Google Scholar]
- 22.Jacques SL. Optical properties of biological tissues: a review. Phys Med Biol. 2013;58:R37–R61. doi: 10.1088/0031-9155/58/11/R37. [DOI] [PubMed] [Google Scholar]
- 23.Bentz BZ, Bowen AG, Lin D, Ysselstein D, Huston DH, Rochet JC, Webb KJ. Printed optics: phantoms for quantitative deep tissue fluorescence imaging. Opt Lett. 2016;41:5230–5233. doi: 10.1364/OL.41.005230. [DOI] [PMC free article] [PubMed] [Google Scholar]
- 24.Di Ninni P, Martelli F, Zaccanti G. The use of India ink in tissue-simulating phantoms. Opt Express. 2010;18:26854–26865. doi: 10.1364/OE.18.026854. [DOI] [PubMed] [Google Scholar]
- 25.https://sourceforge.net/projects/toastpp-printed-mouse-phantoms.
- 26.Bentz BZ, Costas A, Gaind V, Garcia JM, Webb KJ. 3D printed optical phantoms and deep tissue imaging for in vivo applications including oral surgery. Proc SPIE. 2017;10056:1005607. [Google Scholar]
- 27.D’Souza KM, Aras MA. Types of implant surgical guides in dentistry: a review. J Oral Implantol. 2012;38:643–652. doi: 10.1563/AAID-JOI-D-11-00018. [DOI] [PubMed] [Google Scholar]
- 28.Sarment DP, Sukovic P, Clinthorne N. Accuracy of implant placement with a stereolithographic surgical guide. Int J Oral Maxillofac Implants. 2003;18:571–577. [PubMed] [Google Scholar]
- 29.Windfuhr JP. Malpractice claims and unintentional outcome of tonsil surgery and other standard procedures in otorhinolaryngology. GMS Curr Top Otorhinolaryngol Head Neck Surg. 2013;12:1–37. doi: 10.3205/cto000100. [DOI] [PMC free article] [PubMed] [Google Scholar]