Abstract
Objective
We have previously used a 12-lead, signal-processed ECG to calculate blood potassium levels. We now assess the feasibility of doing so with a smartphone-enabled single lead, to permit remote monitoring.
Patients and methods
Twenty-one hemodialysis patients held a smartphone equipped with inexpensive FDA-approved electrodes for three 2 min intervals during hemodialysis. Individualized potassium estimation models were generated for each patient. ECG-calculated potassium values were compared to blood potassium results at subsequent visits to evaluate the accuracy of the potassium estimation models.
Results
The mean absolute error between the estimated potassium and blood potassium 0.38 ± 0.32 mEq/L (9% of average potassium level) decreasing to 0.6 mEq/L using predictors of poor signal.
Conclusions
A single-lead ECG acquired using electrodes attached to a smartphone device can be processed to calculate the serum potassium with an error of 9% in patients undergoing hemodialysis.
Summary
A single-lead ECG acquired using electrodes attached to a smartphone can be processed to calculate the serum potassium in patients undergoing hemodialysis remotely.
Keywords: Hyperkalemia, Potassium, Electrocardiogram, End-Stage Renal Disease, Hemodialysis
Introduction
Patients with end-stage renal disease are prone to hyperkalemia. In these patients, the rate of sudden death approaches 30% [1–4] with the highest risk immediately before scheduled dialysis following a two-day hiatus (e.g. in the 12 h before Monday dialysis in patients undergoing Mon-Wed-Fri dialysis), suggesting that hyperkalemia may play a role [1–3]. In the United States, potassium is typically measured once monthly in dialysis patients. Since potassium derangements are generally asymptomatic, neither patients nor their medical caregivers have any way to know the potassium concentrations at other times. A convenient, non-invasive means of determining potassium, especially at home, could detect potassium abnormalities and permit interventions before cardiac arrhythmias occurred.
Currently, patients have access only to phlebotomy-based potassium measurement. These tests are painful, invasive and require trained technicians and expensive laboratory facilities. To overcome these barriers, we developed a non-invasive approach to estimate potassium levels using the 12-lead, surface electrocardiogram (ECG). It has been previously demonstrated that several features of the T-wave on surface ECG are associated potassium levels [5]. Moreover, ECG models were shown to be useful in the diagnosis of hyperkalemia [6]. We previously demonstrated that, with ECG filtering and signal processing, subclinical changes in the surface ECG can be detected and used to calculate serum potassium levels in patients undergoing hemodialysis [7,8]. More recently, we used signal-processed ECG data derived from a band-aid-like, single lead device, attached to the chest, to calculate potassium values to within 10% of blood test results in dialysis patients [8]. Our previous work utilized standard 12-lead ECG machines. In one trial [8], we simulated single-lead potassium measurement by using the lead with the greatest-amplitude T wave among leads V3–V6. Since the 12-lead ECG is impractical for home use, in the current study we assessed the feasibility of using a handheld smartphone with inexpensive, commercially available electrodes affixed to it to acquire single-lead ECG signals, of transmitting these signals to a remote server, and of digitally processing the signals to estimate potassium levels in a prospective cohort of dialysis patients.
Materials and methods
Patient population
Patients aged ≥18 years undergoing chronic hemodialysis at the Mayo Clinic in Rochester, Minnesota were recruited as part of larger project for noninvasive measurement of potassium. We did this in hemodialysis patients because their potassium levels change in a relatively predictable manner over the course of the dialysis cycle. Exclusion criteria included presence of an implantable pacemaker and/or defibrillator or a bed partner with one of these devices, pregnancy or the possibility of becoming pregnant, and hemoglobin <8 mg/dl in the last 30 days before recruitment. Twenty-one patients were enrolled for potassium measurement using a Kardia smartphone-based device (described below), under an institutional review board-approved protocol, after providing written informed consent.
Serum potassium measurement
Serum potassium was measured at three separate dialysis visits for each patient. A fourth optional non-dialysis phlebotomy session was also offered. For the dialysis sessions, phlebotomy was performed before and after dialysis at all three visits. In addition, during the first and third visits, two additional phlebotomies were added at approximately 30 and 60 min after starting dialysis. The blood obtained before dialysis was acquired from the arterial tubing prior to initiating dialysis. To minimize the effect the intra-dialysis potassium, pH and other electrolyte fluctuations from our affecting the measured potassium, we obtained the blood during and after dialysis from the arterial tubing after clamping the heparin line (if in use), temporarily stopping dialysate flow and decreasing the blood flow rate to 100 ml/min for 15 s.
Electrocardiogram acquisition
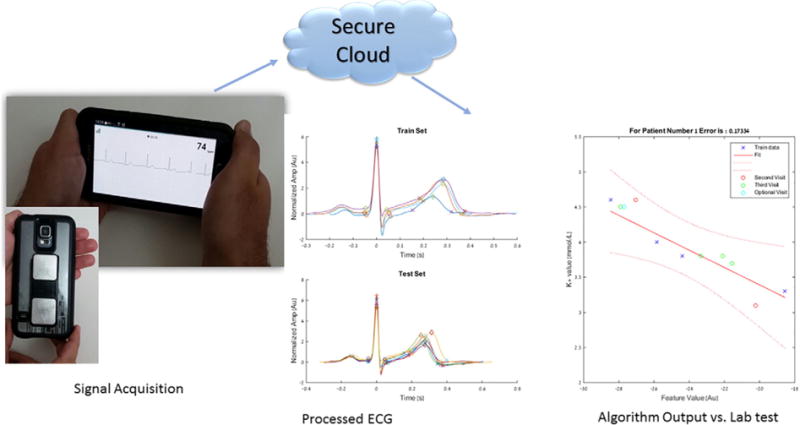
Commercially-available electrodes (Kardia, AliveCor, San Francisco, CA) were affixed to the back of a Samsung 5 Android smartphone to record a single channel ECG (lead I) for 2 min prior to each blood draw at each visit, with the subject holding the smartphone in both hands with each hand touching one of the two electrodes (Fig. 1). The electrodes transmitted the ECG to the smartphone, which, after preprocessing by the Kardia android app, uploaded the digitized signals to a secure server. The anonymized data were then downloaded from the Kardia servers by the research team for analysis (Fig. 1).
Fig. 1.

Electrocardiogram acquisition and signal processing. An illustration of the Kardia smartphone device recording an electrocardiogram signal (bottom left), electrocardiogram processing output of averaged ECG complexes at different time points during the training and testing phases (middle graphs), and linear regression model for potassium estimation by plotting Feature value against measured potassium with 95% the confidence interval (bottom right).
Training period, electrocardiogram processing and model generation
ECG processing - Analysis of the ECG data was performed in a numerical computing environment (Matlab, R2015b, MathWorks). ECG signals were filtered using a custom-developed, automated processing algorithm. The filtered complexes were signal averaged using the R-peak as the fiducial point to eliminate noise. The averaged processed ECG complex was normalized to have a variance of one to adjust for the differences related to gain, fluid shifts, or skin impedance) [7,8] and was used for feature extraction for analysis. T wave peak and end points were selected in an automated manner. The algorithm then automatically selected a representative section of the descending T wave to estimate its slope (T-right slope) using the mean derivative approach [9–11]. T wave amplitude (T-amp) was measured as the difference in amplitude between the T wave peak and end. Any ECG samples for which the automatic detection software could not reliably extract the relevant ECG features were rejected [7,8].
Model generation: Previous work identified several T-wave features on ECG that correlate with measured potassium including slope of the T-wave, T-wave duration and amplitude [5,6,8]. Based on our previous analysis, we used the to create a personalized potassium prediction model that was unique to each individual patient [8]. In the training phase, we used four data points from patients’ first dialysis session to create a linear regression model of measured potassium versus (Fig. 1). If a sample was missing during the first visit, the third visit was used to create the model and the other visits used to test it. Calculations were made using SAS software version 9.4 for windows (Copyright (c) 2002–2012 by SAS Institute Inc., Cary, NC, USA) and with Matlab. The equation of the regression line was generated in the form of y = mx + b. where m is the slope, b is the intercept, x is the calculated feature of interest and y is the estimated potassium in mEq/L. The calculated linear regression equation served as our potassium estimation model for each patient.
Testing period, model validation
ECG data and potassium levels from subsequent visits were used to evaluate the accuracy of the generated potassium estimation models. An estimated potassium level was calculated from acquired ECG data using the corresponding patient-specific potassium prediction model that was generated during the training period. To assess accuracy, we calculated the mean absolute error, which is the mean of the absolute value of the difference between the estimated and measured potassium for each patient. In addition, to qualitatively assess precision, we constructed a Bland-Altman plot for our best model to visually depict the mean difference and standard deviation of the error between our estimated and measured potassium. Additionally, we used ECG characteristics to qualitatively identify factors that could preclude individuals from using this single-lead technology.
Results
Twenty-one patients completed the study between 10/15/2015 and 8/1/2016 and had data available for analysis. The automatic detection software could not reliably detect the ECG relevant features in three subjects: all three had rapidly conducted atrial fibrillation or flutter with average ventricular rates above 100 beats per minute. Potassium estimation models were created for all 18 patients with analyzable ECG signals.
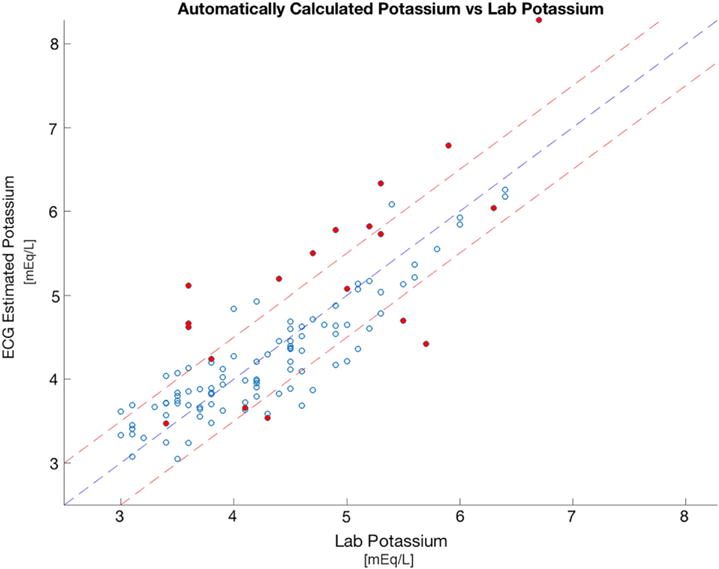
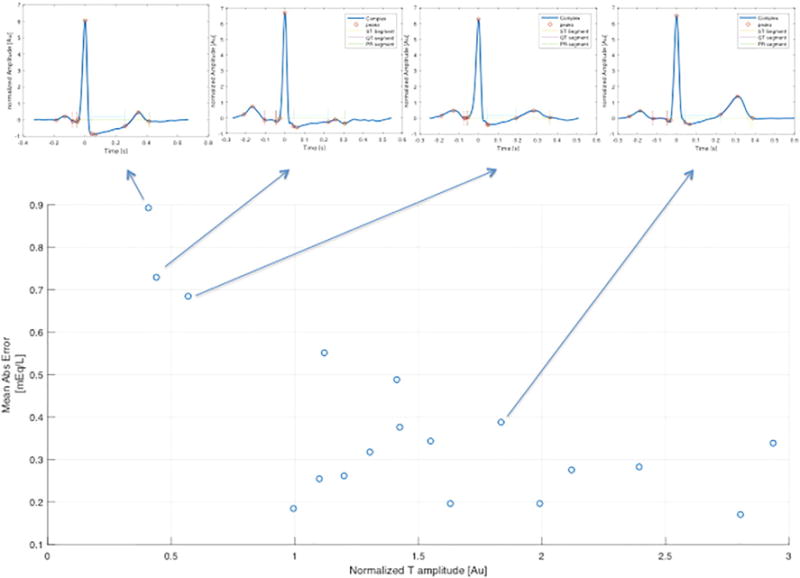
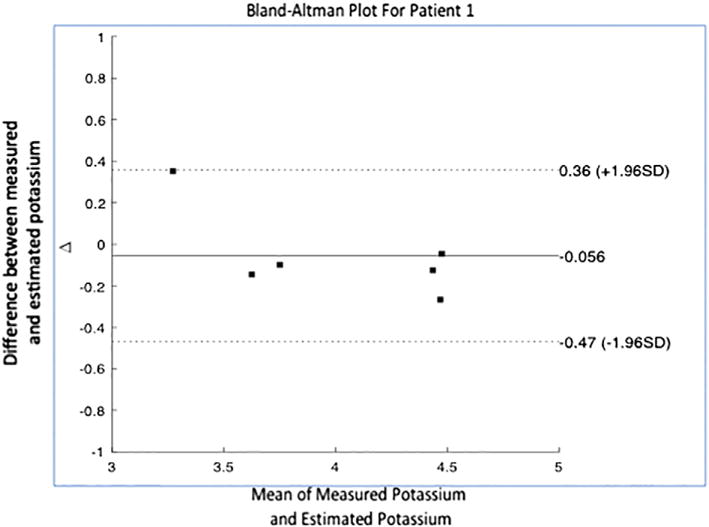
Of the 18 patients, there were 12 men (66.6%) and 6 (33.3%) woman. The mean age was 45.5 years. Of these patients, 39% had coronary artery disease, 17% previous myocardial infarction, 17% previous coronary intervention, 11% prior bypass surgery, and 45% had diabetes mellitus. The average measured blood potassium value was 4.3 +/− 0.8 mEq/L. Overall, the mean absolute error between the estimated potassium and blood potassium was 0.38 ± 0.32 mEq/L across the two subsequent visits (6–7 blood tests per patient). The median absolute error was 0.29 mEq/L, and the average percentage error was 9% of the serum potassium blood test result (Fig. 2). Qualitatively, more estimated potassium values fell under the line of equality at highter potassium measurements and above the line at low measurements (Fig. 2). When analyzing the data for each patient, the mean absolute error ranged from 0.2 to 0.9 mEq/L (Table 1). In 15 of the 18 patients the mean absolute error was <0.5 mEq/L (mean error 7 %) and the standard deviation of the absolute error was <0.22 mEq/L. The three remaining subjects had a normalized T wave amplitude <1.0 during the training visit, as compared to all of the other subjects in whom it was >1.0 (Fig. 3). In the Bland-Altman plot analysis, the mean difference between estimated and measured potassium was 0.06 (Fig. 4). Descriptive statistics describing the measured potassium by time point during dialysis and train versus test phases are shown in Table 2.
Fig. 2.

Measured potassium vs. estimated potassium for all patients. Scatter plot of the measured potassium on x-axis (Lab K) vs. the estimated potassium obtained from our algorithm on the y-axis (Estimated K). Middle yellow line represents the line of equality (Lab K = Estimated K). Outer lines represent the mean absolute error of 0.5 mmol/k, Closed circles represent points that would be eliminated if an automated T wave screen were applied to eliminate training visits in which the maximum normalized T wave amplitude <1 before potassium estimation. Open circles represent points that would not be eliminated by an automated T wave screen. (For interpretation of the references to color in this figure legend, the reader is referred to the web version of this article.)
Table 1.
Patient-specific estimation.
| Patient number | Mean error percentage | Mean abs error | Max train K | Min train K | Max test K | Min test K |
|---|---|---|---|---|---|---|
| 1 | 5% | 0.17 | 4.6 | 3.3 | 4.6 | 3.1 |
| 2 | 10% | 0.38 | 4.9 | 3.1 | 4.9 | 3.1 |
| 3 | 19% | 0.89 | 6.4 | 3.5 | 6.7 | 3.6 |
| 4 | 7% | 0.28 | 5.8 | 3.6 | 5.6 | 3.5 |
| 5 | 5% | 0.19 | 4.6 | 3.7 | 4.5 | 3.1 |
| 6 | 7% | 0.33 | 5.7 | 4.2 | 6 | 3.8 |
| 7 | 10% | 0.37 | 4.3 | 3.1 | 4.6 | 3 |
| 8 | 14% | 0.68 | 5.2 | 3.6 | 5.3 | 3.8 |
| 9 | 6% | 0.26 | 4.6 | 3.2 | 5.1 | 3.1 |
| 10 | 10% | 0.38 | 5.8 | 3.7 | 4.8 | 3.5 |
| 11 | 16% | 0.72 | 5.6 | 3.2 | 5.7 | 3.4 |
| 12 | 8% | 0.31 | 4.5 | 3.4 | 5 | 3.4 |
| 13 | 3% | 0.19 | 5.8 | 3.6 | 6.4 | 3.8 |
| 14 | 12% | 0.48 | 5.3 | 4.4 | 5.2 | 3.4 |
| 15 | 8% | 0.27 | 4.2 | 3.7 | 4.5 | 3 |
| 16 | 7% | 0.34 | 5.3 | 3.9 | 5.3 | 4.2 |
| 17 | 4% | 0.18 | 4.9 | 3.7 | 4.9 | 3.8 |
| 18 | 7% | 0.25 | 3.8 | 3.6 | 4.3 | 3.4 |
K = potassium. Min Train K and Max Train K are the minimum and maximum potassium values recorded during the training period, respectively; Min Test K and Max Test K are the minimum and maximum potassium values recorded during the validation (testing) period.
Fig. 3.

Association between T-wave amplitude and mean error. Scatter plot of T-wave amplitude on x-axis (energy normalized Max T amplitude in training) vs. the mean absolute error on y-axis (mean abs error). Arrows pointing to the corresponding averaged ECG signals visually demonstrate the T-wave morphology.
Fig. 4.

Bland-Altman Plot for patient 1. Scatter plot of mean value of the measured potassium and estimated potassium per time point on x-axis vs. difference between the two values on y-axis. Graph also depicts the mean difference (solid line) and interval in which 95% of the differences lie (dotted line).
Table 2.
Descriptive statistics of measured potassium by time point during dialysis and train versus test phases.
| Set | Phase | Median K (Q1,Q3) | Min K | Max K |
|---|---|---|---|---|
| Train | Pre Dialysis | 5.3 (4.5, 5.8) | 3.7 | 6.4 |
| Dialysis | 4.4 (3.9, 5.1) | 3.4 | 5.8 | |
| Post Dialysis | 3.4 (3.2, 3.7) | 3.1 | 4.2 | |
| Overall | 4.3 (3.7, 5.2) | 3.1 | 6.4 | |
| Test | Pre Dialysis | 5.0 (4.5, 5.4) | 3.7 | 6.4 |
| Dialysis | 4.1 (3.8, 4.6) | 3.3 | 5.1 | |
| Post Dialysis | 3.6 (3.2, 3.7) | 3.0 | 4.2 | |
| Overall | 4.1 (3.6, 4.8) | 3.0 | 6.4 |
Discussion
In this study we demonstrated the feasibility of non-invasively estimating potassium in hemodialysis patients using inexpensive electrodes affixed to a smartphone [12,13]. By having a subject simply hold a smartphone, touching the electrodes mounted on its case, we were able to acquire an ECG and employ advanced filtering and processing to determine blood potassium to within 9% of the blood test result (7% when excluding electrocardiographically identifiable outliers). Moreover, the fact that data were recorded by the smartphone, transmitted wirelessly to a secure server and then downloaded and processed on the back end, demonstrates the integrity and reliability of the entire data transmission system for managing and processing medical-grade data. Additionally, we recorded only two minutes of ECG for each measurement, a short enough time interval to be convenient for repeated patient use.
Of the 21 patients studied, three had rapidly conducted atrial flutter or atrial fibrillation and were not analyzable by the automated algorithm. While we previously analyzed patients with atrial fibrillation successfully by adjusting for R-R interval variability, rapidly conducted atrial fibrillation and flutter are special cases in which atrial signals achieve amplitudes that interfere with T-wave patterns. The electrodes used provided excellent signals, but only in lead I (when held with both hands), which in approximately 14% of dialysis patients results in low T wave energy (unpublished observation), and thus record a signal not suitable for our analysis. The use of modified electrodes that can make contact with a patient’s leg, chest, or other region will likely overcome this limitation, based on previous observations [7]. With multi-lead devices, automated analysis tools can determine in advance whether a signal is suitable for analysis, and enable selection of an optimal ECG source. Additionally, this early version of the algorithm has not been adapted to permit analysis of uncommon variations of ECG morphology or small T-waves. ECG features other than the T-wave may permit analysis in patients with small repolarization energy.
In this feasibility study, we used a personalized approach by creating a potassium estimation model that is unique for each patient. Adding more data points when clinically indicated blood tests are performed allows for continuous refinement of the estimation model as it can recalibrate when the patient gets more potassium level measurements, further improving accuracy. While a personalized model is particularly well suited to dialysis patients in whom access to blood to “seed” a personalized algorithm may be easily performed, for other at-risk populations, such as patients with heart failure, an approach that requires no blood may be attractive. We have previously demonstrated potassium estimation with no blood samples using population-based data to seed the algorithm that reliably predicted potassium with only a minor decrease in the accuracy (2%) compared to the personalized, seeded approach [8]. In this early assessment, we did not collect sufficient data to support a fully “bloodless blood test” (no seeding samples required), but we are in the process of doing so.
Our study is best interpreted within the context of its limitations. We used a laboratory based serum potassium test as our gold standard. However, serum potassium tests are subject to numerous conditions that can lead to error, including mechanical (sample hemolysis), chemical, and temperature factors [14]. Moreover, the delay in sample processing can exhaust cellular glucose, impair the sodium-potassium membrane pump and lead to potassium leakage from cells. Crying or hyperventilation at the time of phlebotomy is associated with acute respiratory alkalosis and hypokalemia [15]. Since we measured the body’s response to potassium levels rather than a chemical concentration based on population norms, it is possible that ECG-based potassium values may have different normal values and greater physiologic significance than blood tests especially when significant potassium, pH and other electrolytes are in flux during dialysis, but validation is required. In its current, early, state, although the error is small, our model tends to underestimate higher potassium levels and overestimate lower potassium levels (Fig. 2). Fortunately for our patients, we did not have enough data points at the extreme ends of the spectrum to allow us to refine our algorithm’s accuracy for hyper and hypokalemia. Our study was limited by a low number of patients and few data points per patient. Nevertheless, we were able to estimate potassium with a relatively low absolute mean error. Our population’s potassium levels were largely within the normal range, but prospectively identifying patients with low or high potassium blood levels is difficult. We studied patients with end stage renal disease. This approach might be applicable to other populations, but this requires confirmation.
Conclusions
In this feasibility study, we found that an ECG signal acquired using a hand-held, single lead device could be processed to calculate the serum potassium concentration with an accuracy of 9% in patients undergoing hemodialysis. With further validation, such a tool would permit convenient, noninvasive, frequent, remote, monitoring of potassium, including home-based potassium monitoring. This could enhance patient home care and enable early detection of asymptomatic and potentially dangerous potassium abnormalities.
Acknowledgments
Financial support
Research reported in this publication was supported by the National Institute of Biomedical Imaging and Bioengineering of the National Institutes of Health under Award Number R21EB017649. The content is solely the responsibility of the authors and does not necessarily represent the official views of the National Institutes of Health.
Abbreviations
- ECG
electrocardiogram
- mEq/L
milliEquivalents per Liter
Footnotes
Conflict of interest
Drs. Dillon, Somers, Ackerman, Asirvatham, Friedman, Kevin Bennet and Dorothy Ladewig, Jennifer Dugan, Zachi Attia, Mayo Clinic and Profs. Dan Sadot, Amir Geva, and Yehu Sapir, and Ben Gurion University have a financial interest related to this research.
References
- 1.Bleyer AJ, Hartman J, Brannon PC, Reeves-Daniel A, Satko SG, Russell G. Characteristics of sudden death in hemodialysis patients. Kidney Int. 2006;69:2268–73. doi: 10.1038/sj.ki.5000446. [DOI] [PubMed] [Google Scholar]
- 2.Bleyer AJ, Russell GB, Satko SG. Sudden and cardiac death rates in hemodialysis patients. Kidney Int. 1999;55:1553–9. doi: 10.1046/j.1523-1755.1999.00391.x. [DOI] [PubMed] [Google Scholar]
- 3.Perl J, Chan CT. Timing of sudden death relative to the hemodialysis procedure. Nat Clin Pract Nephrol. 2006;2:668–9. doi: 10.1038/ncpneph0345. [DOI] [PubMed] [Google Scholar]
- 4.Nakhoul GN, Huang H, Arrigain S, Jolly SE, Schold JD, Nally JV, Jr, et al. Serum Potassium, End-Stage Renal Disease and Mortality in Chronic Kidney Disease. Nephrol. 2015;41:456–63. doi: 10.1159/000437151. [DOI] [PMC free article] [PubMed] [Google Scholar]
- 5.Frohnert PP, Giuliani ER, Friedberg M, Johnson WJ, Tauxe WN. Statistical investigation of correlations between serum potassium levels and electrocardiographic findings in patients on intermittent hemodialysis therapy. Circulation. 1970;41:667–76. doi: 10.1161/01.cir.41.4.667. [DOI] [PubMed] [Google Scholar]
- 6.Velagapudi V, O’Horo JC, Vellanki A, Baker SP, Pidikiti R, Stoff JS, et al. Computer-assisted image processing 12 lead ECG model to diagnose hyperkalemia. J Electrocardiol. 2017;50:131–8. doi: 10.1016/j.jelectrocard.2016.09.001. [DOI] [PubMed] [Google Scholar]
- 7.Dillon JJ, DeSimone CV, Sapir Y, Somers VK, Dugan JL, Bruce CJ, et al. Noninvasive potassium determination using a mathematically processed ECG: proof of concept for a novel “blood-less, blood test”. J Electrocardiol. 2015;48:12–8. doi: 10.1016/j.jelectrocard.2014.10.002. [DOI] [PMC free article] [PubMed] [Google Scholar]
- 8.Attia ZI, DeSimone CV, Dillon JJ, Sapir Y, Somers VK, Dugan JL, et al. Novel Bloodless Potassium Determination Using a Signal-Processed Single-Lead ECG. J Am Heart Assoc. 2016;5 doi: 10.1161/JAHA.115.002746. [DOI] [PMC free article] [PubMed] [Google Scholar]
- 9.Helfenbein ED, Ackerman MJ, Rautaharju PM, Zhou SH, Gregg RE, Lindauer JM, et al. An algorithm for QT interval monitoring in neonatal intensive care units. J Electrocardiol. 2007;40:S103–10. doi: 10.1016/j.jelectrocard.2007.06.019. [DOI] [PubMed] [Google Scholar]
- 10.Zhang Q, Manriquez AI, Medigue C, Papelier Y, Sorine M. An algorithm for robust and efficient location of T-wave ends in electrocardiograms. IEEE Trans Biomed Eng. 2006;53:2544–52. doi: 10.1109/TBME.2006.884644. [DOI] [PubMed] [Google Scholar]
- 11.Hamming RW. Numerical Methods for Scientists and Engineers. New York: Dover Publications; 2012. [Google Scholar]
- 12.Kraus MS, Brewer FC, Rishniw M, Gelzer AR. Comparison of the AliveCor® ECG device for the iPhone with a reference standard electrocardiogram. ACVIM Seattle. 2013 [Google Scholar]
- 13.Volgman C, Wang S, Mehta D, Nazir N, Alexander S, Krishnan K, et al. O016 AliveCor Heart Monitoring: Is it a practical alternative to a traditional ECG monitor for a developing nation? Glob Heart. 2014;9:e4–5. [Google Scholar]
- 14.Asirvatham JR, Moses V, Bjornson L. Errors in potassium measurement: a laboratory perspective for the clinician. Med Sci. 2013;5:255–9. doi: 10.4103/1947-2714.110426. [DOI] [PMC free article] [PubMed] [Google Scholar]
- 15.Krapf R, Caduff P, Wagdi P, Staubli M, Hulter HN. Plasma potassium response to acute respiratory alkalosis. Kidney Int. 1995;47:217–24. doi: 10.1038/ki.1995.26. [DOI] [PubMed] [Google Scholar]


