

Abstract
BACKGROUND AND PURPOSE:
The chronic cerebrospinal venous insufficiency hypothesis raises interest in cerebrospinal venous blood flow imaging, which is more complex and less established than in arteries. For accurate assessment of venous flow in chronic cerebrospinal venous insufficiency diagnosis and research, we must account for physiologic changes in flow patterns. This study examines day-to-day flow variability in cerebrospinal veins by use of 4D MR flow and contrast-enhanced MRA under typical, uncontrolled conditions in healthy individuals.
MATERIALS AND METHODS:
Ten healthy volunteers were scanned in a test-retest fashion by use of a 4D flow MR imaging technique and contrast-enhanced MRA. Flow parameters obtained from phase contrast-vastly undersampled isotropic projection reconstruction and contrast-enhanced MRA scoring measurements in the head, neck, and chest veins were analyzed for internal consistency and interscan reproducibility.
RESULTS:
Internal consistency was satisfied at the torcular herophili, with an input-output difference of 2.2%. Percentages of variations in flow were 20.3%, internal jugular vein; 20.4%, azygos vein; 6.8%, transverse sinus; and 5.1%, common carotid artery. Retrograde flow was found in the lower internal jugular vein (4.8%) and azygos vein (7.2%). Contrast-enhanced MRA interscan κ values for the internal jugular vein (left: 0.474, right: 0.366) and azygos vein (−0.053) showed poor interscan agreement.
CONCLUSIONS:
Phase contrast–vastly undersampled isotropic projection reconstruction blood flow measurements are reliable and highly reproducible in intracranial veins and in the common carotid artery but not in veins of the neck (internal jugular vein) and chest (azygos vein) because of normal physiologic variation. Retrograde flow normally may be observed in the lower internal jugular vein and azygos vein. Low interrater agreement in contrast-enhanced MRA scans was observed. These findings have important implications for imaging diagnosis and experimental research of chronic cerebrospinal venous insufficiency.
In the hypothesis attributed to Zamboni et al1 known as chronic cerebrospinal venous insufficiency (CCSVI),1 obstructed venous outflow from the brain and spinal cord promotes tissue iron deposition that triggers the neuroinflammation characteristic of MS. Zamboni reported results of 100% sensitivity and specificity in distinguishing subjects with MS from non-MS subjects by use of cerebrospinal venous flow–specific criteria.2 This hypothesis in the diagnosis and potential treatment of MS has increased interest in both intra- and extracranial venous flow measurements, namely in the deep cerebral veins, the internal jugular veins (IJVs), and the azygos vein (AV). In the wake of invasive venoplasty and “liberation” stent placement procedures being conducted and published results that are contrary to Zamboni's findings,3,4 the CCSVI hypothesis has prompted much interest in the accuracy and reproducibility of cerebrospinal venous flow measurements, which have not yet been established.
The diagnosis of CCSVI uses duplex (gray-scale and color Doppler) ultrasonography. Intracranial arterial blood flow measurements have well-known limitations including “acoustic window” issues and operator dependence. Special training for Zamboni's examination is required, and blinding of examiners to the disease status of subjects is difficult, potentially leading to study bias. MR can be implemented in the diagnosis of CCSVI to overcome these issues and is being used at some sites.5 It has benefits compared with ultrasonography: it is established in MS diagnosis; acquires fewer user-dependent measurements with repeatable protocols from patient to patient; entire vessels can be assessed, including those inaccessible to sonography; and examiner bias can be removed through blinding. Drawbacks of MR imaging include non–real-time, electrocardiography-gated acquisitions that last several cardiac cycles, giving much lower temporal resolution compared with 2D ultrasonography. Additionally, all measurements must be conducted in the supine position, in which positional flow changes cannot be assessed.2
Phase contrast–vastly undersampled isotropic projection reconstruction (PC-VIPR)6,7 is a 4D MR flow-sensitive technique that uses a 3D time-resolved radial acquisition scheme. The outer portions of k-space are undersampled, allowing for faster acquisition compared with a standard 3D Cartesian sampling scheme. Because of high image contrast and sparse signal representation, PC-VIPR has relatively benign undersampling artifacts that yield high temporal resolution capabilities, important in assessing blood velocity changes. PC-VIPR covers a large volume with high, isotropic spatial resolution. The acquisition allows for retrospective selection of flow analysis planes,8 as detailed below. The accuracy and reproducibility of PC-VIPR has been established in arteries, specifically for velocity measurements in the carotid and cerebral arteries,7 aorta,9 liver,10 and renal arteries11 and for pulsatility in large cerebral arteries.12 Venous PC-VIPR accuracy and reproducibility had yet to be investigated at the time of this study.
Although much has been made of potential diagnosis and treatment possibilities that CCSVI has to offer, relatively little effort has been made to investigate the reproducibility of venous blood flow measurements and luminography, especially by use of MR.13 MR flow imaging and MRA have historically concentrated on arteries; therefore relatively little is known about the accuracy and reproducibility of venous flow assessment with phase-contrast MR and lumen assessment with MRA. Previous studies have shown that venous flow (particularly in the neck) is sensitive to body position,14 head position/rotation,15,16 respiratory state,17 hydration level,16 and other contributing factors.14 Venous luminography is additionally difficult to accomplish because, unlike rigid, muscular arteries, veins have thin, nonmuscular walls that make for an easily compressible or distensible lumen.
The aims of this study were 3-fold: First, internal consistency of PC-VIPR venous blood flow measurements was evaluated in cerebral veins. Second, test-retest reproducibility of venous blood flow measurements by use of PC-VIPR was assessed in a healthy volunteer population and compared with arterial blood flow measurements. Finally, image quality and reproducibility of venous luminography by use of contrast-enhanced MRA (CE-MRA) were assessed.
MATERIALS AND METHODS
Experimental Subjects and Study Design
Under an institutional review board–approved protocol, 10 healthy adult volunteers (7 women; age, 36 ± 14 years) underwent anatomic CE-MRA and flow-sensitive (PC-VIPR) MR imaging on a 3T clinical scanner (Discovery MR750; GE Healthcare, Milwaukee, Wisconsin). Each subject was scanned twice on separate days in a test-retest fashion (14 ± 9 days between scans), yielding 10 matched pairs of acquired examinations. Subjects were selected to exclude any known vascular, neurologic, or psychiatric disorders.
Data Acquisition
A 3-station PC-VIPR examination was performed in the head, neck, and chest to obtain flow measurements in the cerebral veins, IJVs, and AV, respectively. To limit coil switching time, a high-definition 8-channel neurovascular coil (USA Instruments, Aurora, Ohio) was used for the head and neck scans. Cardiac triggers were recorded for retrospective cardiac gating. Sample MR imaging parameters for the PC-VIPR head scan were 3D radial free-breathing acquisition, TR = 15.9 ms, flip angle α = 25°, FOV = 24 × 24 × 16 cm3, acquired spatial resolution = (0.6 mm)3, 7:30 scan time. Similar parameters were used for the neck and chest scans; velocity encoding sensitization was set at 20 cm/s for the head and chest and 70 cm/s for the neck. These values were chosen to capture maximum possible velocities determined by test scans in the veins of interest in a healthy population. Because the purpose of this study was to examine the reproducibility of cerebrospinal venous blood flows under normal conditions, potential confounds were not controlled.
A 2-station CE-MRA neck and chest examination consisted of a single injection of gadofosveset trisodium (Ablavar; Lantheus Medical Imaging, North Billerica, Massachusetts) at a dose of 0.03–0.05 mmol/kg and rate of 3 mL/s. Ablavar binds to serum albumin, giving longer intravascular presence and allowing for a single injection to be used for all CE-MRA and PC-VIPR examinations. This requires less contrast volume than would be needed with the use of extravascular contrast agents.
Data Analysis
PC-VIPR datasets were reconstructed by use of a temporal filter as previously described for time-resolved CE-MRA with a 3D radial acquisition,18 similar to view sharing in a Cartesian acquisition.19 High frequency k-space contributions from neighboring timeframes increase the ability to visualize small vessels, but blood flow is captured almost entirely by low frequency and central k-space, collected during each TR with a radial acquisition. Twenty cardiac timeframes were reconstructed for each scan, giving velocity and magnitude images gated to the cardiac cycle. Temporal resolution is determined from the heart rate. For instance, a heart rate of 60 bpm gives 1 second per heartbeat divided by 20 frames per heartbeat or temporal resolution equal to 50 ms. Image sets were segmented by use of commercial software (Mimics; Materialise, Leuven, Belgium) and exported by use of an in-house magnitude and velocity conversion tool (Matlab; MathWorks, Natick, Massachusetts). Velocity data were then visualized (Ensight; CEI Software, Apex, North Carolina) and measured over the cardiac cycle20 at specific 2D cut planes, retrospectively selected. PC-VIPR encodes velocity in 3D plus time, so that flow rate is integrated velocity within vessel area for a given cardiac timeframe. Vessel boundaries are hand-drawn over complex-difference 2D cut planes. To quantify reflux, percent retrograde flow (%RF) was calculated as total negatively directed flow (away from the heart) divided by total positively directed flow (toward the heart) over the cardiac cycle. Total flow (Q, in mL) was also calculated as the integration of flow rate over the cardiac cycle.
Cerebral Veins
As a test of internal consistency, a conservation of mass (COM) criterion was applied at the confluence of venous sinuses, or torcular herophili. COM requires that total flow entering and exiting the confluence must be equal. Figure 1A shows the placement of 2D cut planes used for these COM measurements: straight sinus, superior sagittal sinus, and left and right transverse sinuses (TS). Example blood flow waveforms for these 4 vessels are shown in Fig 1B. Thus, the COM formula to test becomes:
Twenty inflow and outflow measurements were compared to internally validate this equation, with mean percent difference between inflow and outflow averaged over all volunteers. Interscan reproducibility of Q in the same 4 veins was tested by use of Bland-Altman analysis.21 A modification of Bland-Altman analysis accounting for repeated measurements within a subject was used for limits of agreement (LOA) calculations. The modification sums the between-subjects and within-subject variances to find single differences between pairs of measurements, slightly increasing the LOA. Finally, %RF over the cardiac cycle was determined for the same 4 veins as well as for the visualized deep cerebral veins.
Fig 1.

Example of flow visualization for COM (A). Arrows: yellow indicates left/right transverse sinus; red, sagittal sinus; green, straight sinus; blue, vein of Galen; internal cerebral veins: left (orange), right (white). Planes mark location of flow measurement. Blood flow waveforms (B) exemplify COM at the torcular herophili, with total flow measurements differing by only 0.37%.
Internal Jugular Veins
IJV flow measurement reproducibility was assessed. Similar to the analysis performed by Haacke (ms-mri.com), 3 measurement planes were placed along the length of a centerline cubic spline. Measurements were taken at the level just below the jugular bulb (upper), at the midpoint of the spline (mid), and just above the IJV junction with the subclavian vein (lower). An example 3D rendering and placement of planes along the spline are shown in Fig 2 (left). Interscan Bland-Altman 95% LOA and biases across all levels and volunteers were calculated. Figure 2 (right) shows sample IJV blood flow waveforms for each location (left), with detection of retrograde flow in the lower measurement plane. Comparing this lower waveform with a Doppler ultrasound–acquired jugular flow waveform (Fig 3), PC-VIPR is capable of resolving, both spatially and temporally, the triphasic flow waveform typical in the IJV.
Fig 2.

Left: Example placement of measurement planes in the right IJV down a centerline cubic spline and in the left common carotid artery. Right: Blood flow waveforms over the cardiac cycle indicate increasing pulsatility proximal to the heart, with a portion of the lower waveform showing retrograde flow (arrow). A indicates atrial systole; X, atrial relaxation; V, ventricular systole; Y, tricuspid reopening; H, atrial refilling.
Fig 3.

Left: B-mode anatomic location of right IJV blood flow. Right: Doppler ultrasonography displays triphasic IJV blood flow waveform as indicated in Fig 2. Arrow indicates minor normal reflux during the tricuspid valve reopening.
Azygos Vein
As the primary outflow route of blood from the spinal cord in the upright position, Zamboni considered the detection of narrowing in the AV by use of invasive venography to be an inherent corollary of CCSVI.1 From the chest PC-VIPR scan, measurements of %RF were taken 2 cm from the AV junction with the superior vena cava and were compared between scans within each volunteer.
Venous/Arterial Comparison
To compare blood flow changes from one scan to the next throughout the cerebrospinal venous system, Q was measured in several locations: transverse sinuses, upper and lower IJV, and AV. To summarize flow in the cerebrospinal venous system, total flows were added from left and right transverse sinus and IJVs, providing total venous drainage at a single axial location. Flows through the common left and right carotid arteries were similarly analyzed to compare arterial and venous flow reproducibility across all volunteers. Percent change, calculated as interscan difference in total flow normalized to scan one flow, was calculated at all locations. Average percent difference between scans and paired t test P values were calculated across all volunteers.
Contrast-Enhanced MRA
To assess the reproducibility of semi-quantitative assessments of venous caliber, CE-MRAs were scored by 2 experienced radiologists blinded to subject identity, date/sequence of scan, and each other's scores. The scoring followed the scale introduced by Zivadinov et al23: ability to assess the IJV and AV (1, poor; 2, acceptable; 3, good; 4, excellent), AV morphology (1, diffusely irregular/narrowed; 2, focally narrowed at central aspect; 3, caliber increasing from peripheral to central), and IJV morphology at its narrowest point (1, absent; 2, pinpoint; 3, flattened; 4, crescentic; 5, ellipsoidal/round). Cohen κ with linear weights was used to assess agreement between ratings in scan 1 and scan 2 (with both readers combined) and between readers (both scans combined). Kappa values were computed by means of the irr package, R statistical computing software (http://www.r-project.org/).
Results
Cerebral Veins
Bland-Altman plots of cerebral venous flow measurements between scans within an individual volunteer and for individual vessels are shown in Fig 4. Interscan LOA for Q across all 20 scans (40 vessels) were small with respect to the mean (−2.924, 3.369 mL). Figure 5 displays Bland-Altman plots for COM analysis. Pooled COM LOA across both scans were also small (−1.985, 1.443 mL), with the average percent difference between inflow and outflow equal to 2.2%. All visualized deep cerebral veins and large cerebral veins (Fig 1) yielded zero retrograde flow (%RF = 0).
Fig 4.
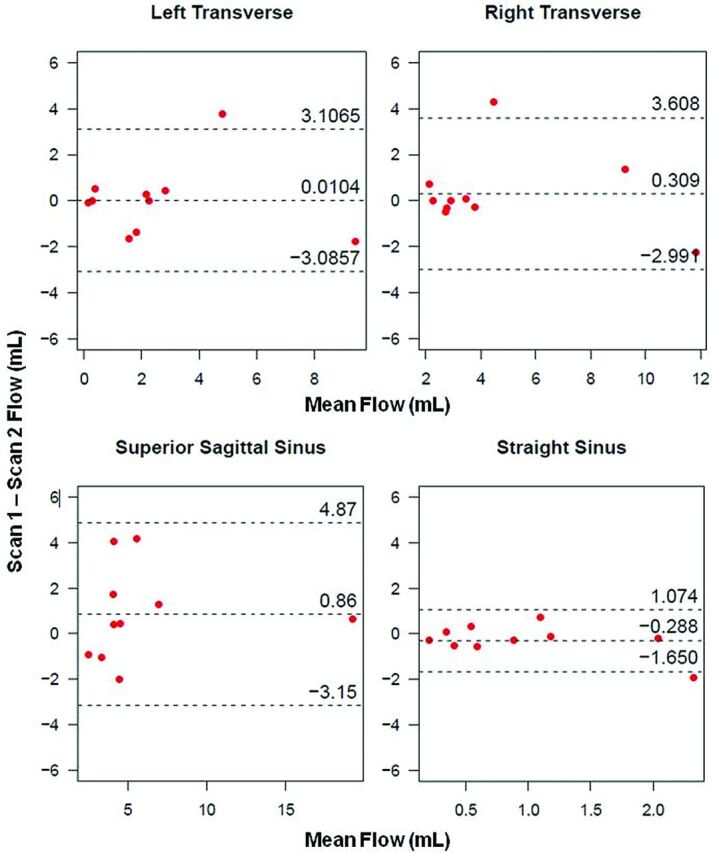
Interscan Bland-Altman plots for cerebral vein analysis within individual veins. Small biases and LOA indicate reproducibility of PC-VIPR in assessment of cerebral venous flow.
Fig 5.

Bland-Altman plots of COM analysis for scan 1 (left) and scan 2 (right), showing small biases and LOA.
Internal Jugular Veins
Measurements of Q at the 3 measurement planes along the length of each IJV are presented in Table 1. “Zeroes” indicate no (or negligible) detection of flow. Large differences can be observed within single volunteers between scans. Asymmetric flow patterns were observed, with complete side dominance in volunteers 1, 3, and 9. Average and peak %RF calculations over all volunteers are shown (bottom row). Both increase as blood nears the heart. Bland-Altman analysis across all measurement planes yielded interscan large LOA in the left IJV (−2.06, 2.48 mL, bias: 0.21 mL) and in the right IJV (−5.08, 3.92 mL, bias: −0.58 mL). Interscan LOA for %RF in the left IJV were −14.187, 13.023%, bias: −0.58%; and in the right IJV were −10.130, 9.143%, bias: −0.49%. Large LOA relative to the mean are observed, indicating high variability between scan 1 and scan 2 and across all measurement locations.
Table 1:
Total flow (mL/cardiac cycle), delineated by side, measurement level, and scan, in all volunteers
| Volunteer | Left IJV |
Right IJV |
||||||||||
|---|---|---|---|---|---|---|---|---|---|---|---|---|
| Upper |
Mid |
Lower |
Upper |
Mid |
Lower |
|||||||
| S1 | S2 | S1 | S2 | S1 | S2 | S1 | S2 | S1 | S2 | S1 | S2 | |
| 1 | 0 | 0 | 0 | 0 | 0 | 0 | 1.90 | 8.36 | 2.00 | 7.15 | 3.95 | 3.07 |
| 2 | 4.36 | 4.42 | 4.45 | 2.80 | 4.63 | 4.11 | 6.03 | 6.40 | 4.56 | 3.34 | 9.59 | 8.47 |
| 3 | 3.35 | 2.63 | 4.39 | 1.41 | 1.99 | 0.31 | 0 | 0 | 0 | 0 | 0 | 0 |
| 4 | 2.09 | 2.82 | 0.80 | 3.34 | 2.14 | 3.70 | 3.40 | 3.02 | 2.99 | 6.53 | 2.78 | 8.75 |
| 5 | 3.89 | 2.03 | 1.84 | 1.74 | 2.46 | 1.09 | 2.37 | 0.46 | 2.73 | 1.86 | 1.47 | 0.37 |
| 6 | 1.00 | 1.68 | 0.98 | 1.44 | 2.26 | 2.82 | 3.53 | 5.37 | 2.90 | 4.27 | 1.39 | 3.48 |
| 7 | 0.49 | 0.46 | 0.82 | 0.33 | 0.57 | 0.50 | 6.35 | 4.31 | 4.91 | 2.82 | 5.25 | 3.63 |
| 8 | 4.18 | 4.77 | 3.60 | 4.01 | 2.95 | 4.24 | 4.54 | 5.39 | 3.42 | 5.72 | 2.69 | 5.53 |
| 9 | 2.87 | 0.74 | 2.54 | 1.14 | 0.64 | 0.34 | 0 | 0 | 0 | 0 | 0 | 0 |
| 10 | 3.09 | 3.25 | 2.60 | 2.59 | 1.03 | 0.99 | 3.99 | 3.33 | 3.75 | 2.35 | 1.28 | 1.19 |
| Average/Max %RF | 0.79/6.15 | 2.98/14.39 | 6.02/24.59 | 0.30/4.83 | 1.19/12.31 | 3.52/29.46 | ||||||
Note:—Average and maximum retrograde flow percentages are presented (bottom row).
Azygos Vein
For both scan 1 and scan 2, we were unable to visualize the AV for volunteers 8 and 10. From the remaining 16 measurements, 10 had significant (>1%) retrograde flow. The average detected %RF among the 8 visualized veins was 7.2%.
Venous/Arterial Comparison
Figure 6 includes boxplots of Q, with average percent differences from scan 1 to scan 2. Day-to-day variation in flow in the common carotid artery as measured by PC-VIPR is low (5.1 ± 4.2%). The venous flow measurements in the IJV and AV show much larger variations, whereas variations in the transverse sinus are comparable to those in the common carotid artery (6.8 ± 7.6%). Figure 7 displays percent change in total flows across all head/neck/chest veins and volunteers. Eight of 10 volunteers exhibited similar changes (increase/positive or decrease/negative) for 3 of the 4 venous flow measurements.
Fig 6.

Boxplot results for all measurement locations. Individual changes (blue lines) show high variation in both the IJV and AV from scan to scan. No differences were considered significant (P < .05).
Fig 7.

Percent change in total flow from scan 1 to scan 2 across volunteers. Volunteers 5–10 have similar directional changes in all measurements.
Contrast-Enhanced MRA
Scoring average for all acquired scores and Cohen κ for the blinded radiologist scoring of the CE-MRA are presented in Table 2. Higher variations for morphology scores are observed. Interscan results pooled for both radiologists indicate fair agreement for left IJV and right IJV morphology and slight to no agreement for the other 3 scores. Interrater results pooled for all scans show slight to no agreement across all scores.
Table 2:
Average (± standard deviation) scores from CE-MRA from both radiologists and across all scans
| IJV Image Quality | Left IJV Morphology | Right IJV Morphology | AV Image Quality | AV Morphology | |
|---|---|---|---|---|---|
| Scoring, average ± standard deviation | 3.70 ± 0.56 | 2.93 ± 1.00 | 3.40 ± 1.26 | 3.08 ± 0.89 | 2.95 ± 0.22 |
| Interscan κ | −0.064 | 0.474 | 0.366 | 0.202 | −0.053 |
| Interrater κ | −0.042 | −0.055 | 0.281 | 0.104 | − |
Note:—Interscan and interrater agreement is slight or nonexistent across scoring; κ <0 indicates no agreement; 0–0.20, slight; 0.21–0.40, fair; 0.41–0.60, moderate; 0.61–0.80, substantial; 0.81–1, almost perfect.
Discussion
Although it is well known that phase-contrast MRA has intravoxel dephasing because of the relatively long TE used,24 PC-VIPR has isotropic resolution and small voxels. This allows for flow visualization and quantification in the cerebral venous system, including the relatively small deep cerebral veins such as the internal cerebral veins, as demonstrated in Fig 1. With PC-VIPR, the user can retrospectively select vessels to interrogate, unlike traditional MRV methods that require selecting a limited subset of vessels a priori. Sample cerebral venous flow waveforms in Fig 1B satisfy COM over the cardiac cycle. Waveforms show little variation through time, indicating low pulsatility far from the heart in the cerebral veins. This work confirms earlier 2D phase-contrast MR work in the cerebral veins performed by Stoquart-El Sankari et al.25 The lack of retrograde flow in all deep cerebral veins and intracranial veins substantiates the work of Wattjes et al,26 in which 2D phase-contrast MR was used to measure flow in the straight sinus and internal cerebral veins in both healthy control subjects and patients with MS.
From Bland-Altman analysis in each cerebral vessel (Fig 4), biases fall near the difference of zero, indicating that no consistent bias from the 2 independent measurements of vessel flow was detected. Tight interscan LOA with respect to mean values across all vessels provide evidence of reproducibility in PC-VIPR measurements of cerebral venous blood flow. In the Bland-Altman COM analysis (Fig 5), small interscan difference in cerebral vessels (2.2%) and tight LOA are further evidence of reproducibility of intracranial venous blood flow measurements by use of PC-VIPR. To our knowledge, this validation of internal consistency by use of a COM test is the first of its kind in venous vasculature by use of PC-VIPR. It points to the use of PC-VIPR as a reliable measurement tool for venous blood flow. Our findings indicate minimal day-to-day effect on the reproducibility of intracranial venous flow. This may be useful in future CCSVI studies or in other venous blood flow–related pathologies such as cerebral venous sinus thrombosis or idiopathic intracranial hypertension.
The tortuous and varied nature of the IJV causes difficulty in measuring blood flow at various locations along its length. PC-VIPR is ideal as a 4D flow measurement tool for this vascular territory. Figure 2 (left) demonstrates the use of a centerline cubic spline in the placement of measurement planes, permitting measurements orthogonal to the expected direction of flow. Figure 2 (right) reveals differing pulsatility that axial locations along the IJV exhibit. Each flow waveform is triphasic in nature. As we move closer toward the beating heart, and incidentally to locations in which the IJV is adjacent to and often physically touching the common carotid artery, the IJV exhibits greater pulsatility. The lower waveform of Fig 2 (right) exhibits retrograde flow over a short period of the cardiac cycle. The triphasic waveform is expected, corresponding to variations in carotid pulsatile motion.27 An independent Doppler ultrasonographic examination of the jugular vein (Fig 3) confirms the triphasic waveform and minor retrograde flow seen in a healthy volunteer.
In analyzing %RF over the cardiac cycle (Table 1, bottom row), average and peak values increase as we measure in the superior to inferior direction. This larger %RF is in part caused by the greater pulsatility observed in “lower” measurement planes across and may reflect a normal result of greater oscillations in blood flow proximal to the beating heart. Larger %RF and slow flow also factor into Q values for a given axial location within a single IJV. We see a general lack of consistency within subject and between scan locations as a result of varying %RF and territories with slow flow, both appreciably affecting Q calculations. Other factors may contribute to retrograde flow seen in a healthy population, such as IJV valve incompetence.28 Despite this finding, most measurement planes had less than 1% retrograde flow for all locations (81/120), indicating the strong tendency of constantly anterograde blood flow.
Table 1 illustrates the wide variance of Q values and varying side dominance in the IJV in a healthy control population, confirming earlier work29 including flow measured by MR imaging.25 The unpredictable nature of venous anatomy and blood flow characteristics are relevant because they convey difficulties that are likely to be encountered in clinical situations. Considering the variables that were not accounted for in this study, the interscan heterogeneity within a volunteer should be expected. These results are contrary to a previous work in ultrasonography30 yet agree with a 3D MRV study.26 This work points to the need for controlling of variables that may affect venous return.
The Bland-Altman results for the IJVs indicate that there are no systematic differences between test occasions. The small biases (left: 0.209, right: −0.58) between scans again lend support to the reproducibility of PC-VIPR; however, skewed distribution in the data indicate that IJV flow is not repeatable within subjects. Error proportional to the mean was observed in the interscan %RF Bland-Altman analysis.
In the AV, high variability in %RF was seen. AV visualization by means of PC-VIPR is difficult because of cardiorespiratory-induced motion. Of the 20 chest PC-VIPR scans taken, the AV was reliably visualized 80% of the time. The significant average %RF (7%) additionally suggests that retrograde flow may be a normal supine attribute of the AV measured 2 cm from its junction with the superior vena cava. This noninvasive probing of AV flow exemplifies another benefit of the use of PC-VIPR.
Individual variations of flow exhibited on the boxplots (Fig 6) reveal consistency in common carotid artery flow from one scan to the next while also showing the many varied venous changes. Low arterial variation (5.1 ± 4.2%) confirms both physiologic reproducibility of arterial flow and technical reproducibility of PC-VIPR. Small variation (6.8 ± 7.6%) was also observed in the transverse sinuses. In contrast, large variations in neck and chest venous flow (>20%) were observed, probably resulting from interscan physiologic changes. Whereas total venous outflow from the brain does not change, alternative drainage pathways probably arise for a certain physiologic state.25 Figure 7 confirms these changes systemically affecting cerebrospinal venous blood flow. The number of similar, one-sided changes across veins indicate a physiologic (ie, not technical) change. These results strongly point to the necessity of controlling for venous flow-altering variables.
The scoring results from the CE-MRA analysis (Table 2) indicate good image quality for both the IJV and AV, with higher values for IJV (3.70 ± 0.56 versus 3.08 ± 0.89). This probably is a result of the mitigating motion in the chest during prospectively gated respiratory examinations versus the stationary neck examinations. AV caliber increased as it neared the junction with the superior vena cava. Turbulent flow from the much larger superior vena cava naturally increases the venous lumen in the AV near its junction with the superior vena cava. Left and right IJV morphology scores had higher variances and averaged to a flattened or crescentic appearance (3.0 ± 1.1 and 3.7 ± 1.3). Single volunteer variation is again corroborated by observing the low agreement from the interscan κ values. Low interrater agreement in the presence of good image quality points to a lack of reproducible identification of IJV and AV morphology, in large part caused by the varied sizes and shapes of venous structures across a healthy population.
This study is not without its limitations. First, for the sake of simplicity in measuring and presentation of data, vertebral veins were not included. Second, although our larger CCSVI study collects both ultrasonographic and PC-VIPR scans, this study did not use ultrasonography as a reference standard. The method of acquisition further limited the study not to investigate the “forced exhalation” that Zamboni uses to determine retrograde flow. This was planned because this study aimed to determine changes occurring in the cerebrospinal venous system under a normal physiologic state. Third, some of the chest scans and resulting AV image quality were poor. This is a direct result of respiratory motion effects purposefully not accounted for in each of the PC-VIPR scans. Fourth, to mitigate on the table scan time (and number of breath-holds) for each volunteer, Venc optimization scans were not performed before PC-VIPR scans. Although no phase aliasing was observed for any of the 60 PC-VIPR scans, low velocity in some of the IJVs caused both image quality- and the velocity-to-noise ratio to suffer, which would have been improved with a lower Venc setting. Finally, despite good image quality, CE-MRA results from this study differ from extracranial venous scoring by McTaggart et al,31 in which a linearly increasing flattening scale32 was used to assess the IJV caliber. Our semi-quantitative approach to venous lumen morphology, though borrowed from the literature, made decisions between available choices difficult. This may have led to poor interobserver and interscan agreement (Table 2), explaining the difference between this study's results and those of McTaggart et al. These results indicate that for venous CE-MRA to be valuable in assessing the CCSVI hypothesis, a set scoring system must be in place.
CONCLUSIONS
The use of PC-VIPR as a reliable measurement tool for venous flow has been demonstrated. Intracranial veins showed day-to-day reproducibility on the order of arteries. Normal venous flow in the neck (IJV) and chest (AV) has been shown to be much more variable, presumably because of confounding variables related to normal cardiorespiratory and positional effects that are dampened in the intracranial veins. The detection of retrograde flow has been shown to be a normal finding in the lower IJV and AV of healthy volunteers. CE-MRA scoring interrater agreement was low, indicating a need for a robust venous scoring system with added information gained through flow measurements. These findings have important implications in CCSVI in which normal variation in venous flow may be construed as diagnostically relevant.
ABBREVIATIONS:
- CCSVI
chronic cerebrospinal venous insufficiency
- IJV
internal jugular vein
- AV
azygos vein
- PC-VIPR
phase contrast–vastly undersampled isotropic projection reconstruction
- COM
conservation of mass
- LOA
limits of agreement
- CE
contrast-enhanced
Footnotes
Disclosure: Eric Schrauben—RELATED: Other: University of Wisconson-Madison Radiology R and D,* Comments: Study funded by the UW-Madison's Radiology Research and Development Funding. Kevin M. Johnson—RELATED: Grant: Multiple Sclerosis Society.* Alejandro Munoz del Rio—RELATED: Grant: National Multiple Sclerosis Society,* Comments: http://www.nationalmssociety.org/research/intriguing-leads-on-the-horizon/ccsvi/ccsvi-study-by-field-team/index.aspx; UNRELATED: Consultancy: Lippincott Williams & Wilkins, Comments: LWW publish Annals of Surgery, for which I am a statistical reviewer; Grants/Grants Pending: NIH, UW-Madison (Wisconsin Alumni Research Foundation), Comments: I am listed on several federally-funded research grants as a biostatistician. Aaron Field—RELATED: Grant: National Multiple Sclerosis Society,* Comments: Research grant (PI: Field). Oliver Wieben—RELATED: Other: GE Healthcare,* Comments: Research support from GE Healthcare.
Previously presented as “Reproducibility of Venous Luminography and Flow Quantification Related to the CCSVI Hypothesis” at: Annual Meeting of the International Society of Magnetic Resonance in Medicine, Melbourne, Australia, May 2012 and “Cerebrospinal Arterial and Venous Blood Flow Variability Assessed with 4D Flow MRI” at Annual Meeting of the ISMRM, Salt Lake City, Utah May 2013.
Grant support was provided by NMSS fund RC1003-A-one, NIH grant R01HL072260, and GE Healthcare.
REFERENCES
- 1. Zamboni P, Galeotti R, Menegatti E, et al. Chronic cerebrospinal venous insufficiency in patients with multiple sclerosis. J Neurol Neurosurg Psychiatry 2009;80:392–99 [DOI] [PMC free article] [PubMed] [Google Scholar]
- 2. Zamboni P, Galeotti R. The chronic cerebrospinal venous insufficiency syndrome. Phlebology 2010;25:269–79 [DOI] [PubMed] [Google Scholar]
- 3. Baracchini C, Perini P, Causin F, et al. Progressive multiple sclerosis is not associated with chronic cerebrospinal venous insufficiency. Neurology 2011;77:844–50 [DOI] [PubMed] [Google Scholar]
- 4. Centonze D, Floris R, Stefanini M, et al. Proposed chronic cerebrospinal venous insufficiency criteria do not predict multiple sclerosis risk or severity. Ann Neurol 2011;70:51–58 [DOI] [PubMed] [Google Scholar]
- 5. Utriainen D, Feng W, Elias S, et al. Using magnetic resonance imaging as a means to study chronic cerebral spinal venous insufficiency in multiple sclerosis patients. Tech Vasc Interv Radiol 2012;15:101–12 [DOI] [PubMed] [Google Scholar]
- 6. Johnson KM, Lum DP, Turski PA, et al. Improved 3D phase contrast MRI with off-resonance corrected dual echo VIPR. Magn Reson Med 2008;60:1329–36 [DOI] [PMC free article] [PubMed] [Google Scholar]
- 7. Gu T, Korosec FR, Block WF, et al. PC VIPR: a high-speed 3D phase-contrast method for flow quantification and high-resolution angiography. AJNR Am J Neuroradiol 2005;26:743–49 [PMC free article] [PubMed] [Google Scholar]
- 8. Markl M, Frydrychowicz A, Kozerke S, et al. 4D flow MRI. J Magn Reson Imaging 2012;36:1015–36 [DOI] [PubMed] [Google Scholar]
- 9. Frydrychowicz A, Niespodzany E, Reeder SB, et al. Validation of 4D velocity mapping using 5-point PC-VIPR for blood flow quantification in the thoracic aorta and main pulmonary artery. In: Proceedings of the American Society of Neuroradiology 50th Annual Meeting Meeting & the Foundation of the ASNR Symposium, New York, New York. April 21–26, 2012 [Google Scholar]
- 10. Roldan-Alzate A, Frydrychowicz A, Niespodzany E, et al. In vivo validation of 4D flow MRI for assessing the hemodynamics of portal hypertension. J Magn Reson Imaging 2013;37:1100–08 [DOI] [PMC free article] [PubMed] [Google Scholar]
- 11. Wentland AL, Grist TM, Wieben O. Repeatability and internal consistency of abdominal 2D and 4D PC MR flow measurements. In: 15th Annual SCMR Scientific Sessions. 2012. Orlando, Florida [DOI] [PMC free article] [PubMed] [Google Scholar]
- 12. Wahlin A, Ambarki K, Birgander R, et al. Measuring pulsatile flow in cerebral arteries using 4D phase-contrast MR imaging. AJNR Am J Neuroradiol 2013;34:1740–45 [DOI] [PMC free article] [PubMed] [Google Scholar]
- 13. Menegatti E, Genova V, Tessari M, et al. The reproducibility of colour Doppler in chronic cerebrospinal venous insufficiency associated with multiple sclerosis. Int Angiol 2010;29:121–26 [PubMed] [Google Scholar]
- 14. Klabunde RE. Cardiovascular Physiology Concepts. 2nd ed. Philadelphia: Lippincott Williams & Wilkins/Wolters Kluwer; 2012:243 [Google Scholar]
- 15. Khatri VP, Wagner-Sevy S, Espinosa MH, et al. The internal jugular vein maintains its regional anatomy and patency after carotid endarterectomy: a prospective study. Ann Surg 2001;233:282–86 [DOI] [PMC free article] [PubMed] [Google Scholar]
- 16. Lu M, Raber L, Baus L, et al. Ultrasound evaluations of chronic cerebrospinal venous insufficiency (CCSVI): important factors to consider. In: AAN Annual Meeting. 2011. Honolulu, Hawaii [Google Scholar]
- 17. Nordenstrom B, Norhagen A. Effect of respiration on venous return to the heart. Am J Roentgenol Radium Ther Nucl Med 1965;95:655–61 [DOI] [PubMed] [Google Scholar]
- 18. Barger AV, Block WF, Toropov Y, et al. Time-resolved contrast-enhanced imaging with isotropic resolution and broad coverage using an undersampled 3D projection trajectory. Magn Reson Med 2002;48:297–305 [DOI] [PubMed] [Google Scholar]
- 19. Markl M, J Hennig J. Phase contrast MRI with improved temporal resolution by view sharing: k-space related velocity mapping properties. Magn Reson Imaging 2001;19:669–76 [DOI] [PubMed] [Google Scholar]
- 20. Stalder AF, Russe MF, Frydrychowicz A, et al. Quantitative 2D and 3D phase contrast MRI: optimized analysis of blood flow and vessel wall parameters. Magn Reson Med 2008;60:1218–31 [DOI] [PubMed] [Google Scholar]
- 21. Bland JM, Altman DG. Agreement between methods of measurement with multiple observations per individual. J Biopharmaceutical Stat 2007;17:571–82 [DOI] [PubMed] [Google Scholar]
- 22. Feng W, Utriainen D, Trifan G, et al. Characteristics of flow through the internal jugular veins at cervical C2/C3 and C5/C6 levels for multiple sclerosis patients using MR phase contrast imaging. Neurol Res 2012;34:802–09 [DOI] [PubMed] [Google Scholar]
- 23. Zivadinov R, Marr K, Cutter G, et al. Prevalence, sensitivity, and specificity of chronic cerebrospinal venous insufficiency in MS. Neurology 2011;77:138–44 [DOI] [PubMed] [Google Scholar]
- 24. Kim AC, Vu DG, Gonzalez RG, et al. Conventional MRI and MR angiography of stroke. In: Acute Ischemic Stroke: Imaging and Intervention. Springer-Verlag, Heidelberg, Germany: 2011:123–44 [Google Scholar]
- 25. Stoquart-Elsankari S, Legmann P, Villette A, et al. A phase-contrast MRI study of physiologic cerebral venous flow. J Cereb Blood Flow Metab 2009;29:1208–15 [DOI] [PubMed] [Google Scholar]
- 26. Wattjes MP, van Oosten VW, de Graaf WL, et al. No association of abnormal cranial venous drainage with multiple sclerosis: a magnetic resonance venography and flow-quantification study. J Neurol Neurosurg Psychiatry 2011;82:429–35 [DOI] [PubMed] [Google Scholar]
- 27. Garg N, Garg N. Jugular venous pulse: an appraisal. Ind Acad Clin Med 2000;1:260–69 [Google Scholar]
- 28. Lin SK, Chang YJ, Yang FY. Hemodynamics of the internal jugular vein: an ultrasonographic study. Tzu Chin Med J 2009;21:317–22 [Google Scholar]
- 29. Chung CP, Hsu HY, Chao AC, et al. Flow volume in the jugular vein and related hemodynamics in the branches of the jugular vein. Ultrasound Med Biol 2007;33:500–05 [DOI] [PubMed] [Google Scholar]
- 30. De Diego JI, Prim MP, Garcia-Raya P, et al. Reproducibility of ultrasonographic measures in internal jugular veins of normal subjects. Auris Nasus Larynx 2001;28:71–74 [DOI] [PubMed] [Google Scholar]
- 31. McTaggart RA, Fischbein NJ, Elkins CJ, et al. Extracranial venous drainage patterns in patients with multiple sclerosis and healthy controls. AJNR Am J Neuroradiol 2012;33:1615–20 [DOI] [PMC free article] [PubMed] [Google Scholar]
- 32. Zaharchuk G, Fischbein NJ, Rosenberg J, et al. Comparison of MR and contrast venography of the cervical venous system in multiple sclerosis. AJNR Am J Neuroradiol 2011;32:1482–89 [DOI] [PMC free article] [PubMed] [Google Scholar]