

Abstract
In the present work, the conformational dynamics and folding pathways of i-motif DNA were studied in solution and in the gas-phase as a function of the solution pH conditions using circular dichroism (CD), photoacoustic calorimetry analysis (PAC), trapped ion mobility spectrometry - mass spectrometry (TIMS-MS), and molecular dynamics (MD). Solution studies showed at thermodynamic equilibrium the existence of a two-state folding mechanism, whereas during the pH = 7.0 → 4.5 transition a fast and slow phase (ΔHfast+ ΔHslow = 43 ± 7 kcal mol−1) with a volume change associated with the formation of hemiprotonated cytosine base pairs and concomitant collapse of the i-motif oligonucleotide into a compact conformation were observed. TIMS-MS experiments showed that gas-phase, kinetically trapped i-motif DNA intermediates produced by nanoESI are preserved, with relative abundances depending on the solution pH conditions. In particular, a folded i-motif DNA structure was observed in nanoESI-TIMS-MS for low charge states in both positive and negative ion mode (e.g., z = +/− 3 to +/−5) at low pH conditions. As solution pH increases, the cytosine deprotonation leads to the loss of cytosine-cytosine+ (C•CH+) base pairing in the CCC strands and in those conditions we observe partially unfolded i-motif DNA conformations in nanoESI-TIMS-MS for higher charge states (e.g., z = − 6 to −9). Collisional induced activation prior TIMS-MS showed the existence of multiple local free energy minima, associated with the i-motif DNA unfolding at z = −6 charge state. For the first time, candidate gas-phase structures are proposed based on mobility measurements of the i-motif DNA unfolding pathway. Moreover, the inspection of partially unfolded i-motif DNA structures (z = −7 and z = −8 charge states) showed that the presence of inner cations may or may not induce conformational changes in the gas-phase. For example, incorporation of ammonium adducts does not lead to major conformational changes while sodium adducts may lead to the formation of sodium mediated bonds between two negatively charged sides inducing the stabilization towards more compact structures in new local, free energy minima in the gas-phase.
Graphical Abstract
INTRODUCTION
Recent innovations in speed, accuracy, and sensitivity have established Mass Spectrometry (MS) based methods as a key technology in the field of structural biology.1 Over the last two decades, native MS of intact biomolecules and biomolecular complexes has permitted structural interrogation at biologically relevant conditions that are not accessible by other methods.2–6 Most common gas-phase structural probes are based on (or a combination of) tandem mass spectrometry (ergodic and non-ergodic), gas-phase hydrogen-deuterium exchange, ion spectroscopy, and ion mobility spectrometry. In particular, ion mobility spectrometry combined with mass spectrometry (IMS-MS), can be a multifaceted approach that quickly provides insight into both the stable and intermediate structures of biomolecules in the gas-phase. Traditional ion mobility spectrometry (IMS) is based on the separation of ions under the influence of a weak electric field as they collide with a bath gas of inert neutral molecules.7–9 The mobility provides information on the its size and shape via the momentum transfer ion-neutral collision cross section (CCS).10 While this description holds true for most contemporary IMS analyzers (e.g., periodic focusing DC ion guide 11, 12, segmented quadrupole drift cell 13, multistage IMS 14–16, transient wave ion guide 17, 18, trapped ion mobility spectrometers19–23 and SLIM devices 24), a common feature is that gas-phase studies take advantage of the desolvation process to effectively reduce sample complexity, permitting molecular characterization in the absence of bulk solvent by studying gas-phase structures in kinetically trapped intermediates. More recently, the combination of IMS-MS measurements with infrared multi-photon dissociation (IRMPD) spectroscopy and infrared vibrational spectroscopy for structural characterization of gas-phase molecular ions have shown the unique advantage of gas-phase studies in order to better understand the intramolecular forces that define the conformational space of biomolecules. 25–29 With the recent introduction of a new IMS analyzer - Trapped Ion Mobility Spectrometer (TIMS)- the possibility to decouple the time domain from the IMS separation allows for the study of kinetically trapped intermediates of molecular ions in the gas-phase as a function of the desolvation time, temperature and bath gas composition. TIMS’ mode of operation and its advantages over traditional IMS are described in ref 19, 30, 31. We have shown the use of TIMS for the study of isomerization kinetics of small molecules32–34, peptides35, 36, and proteins37–42, the influence of the collision partner on the molecular structure43, and the factors that affect molecular-adduct complex lifetime and stability during TIMS measurements44.
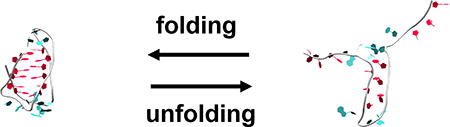
Here we report on a proton-sensitive DNA molecule based on the i-motif conformation (i-motif DNA) that can reversibly fold in response to the solution pH conditions.45–47 The i-motif DNA is a four-stranded DNA structure that forms due to intramolecular noncanonical base pair interactions between a protonated and a neutral cytosine residue (i.e., a CH+:C base pair) under slightly acidic conditions. At higher pH values, the cytosines are neutral and the DNA strand adopts a random coil conformation.48, 49 Regardless of its impending role in oncogene regulation and anti-cancer therapies, 50–53 i-motif DNA has found multiple applications in the field of nanotechnology (e.g., nanomotors, environmental sensors and pH switches). 54 Recent studies have shown that nucleic acids can maintain their solution phase topology (e.g., duplexes, triplexes or G-quadruplexes55–57) when transferred to the gas phase via electrospray sources.58, 59 A recent work using ESI-TWIMS-MS and ESI-IRMPD-MS concluded that zwitterionic i-motif DNA structures are preserved in negatively charged DNA ions.60 However, the detailed structural features of the folded i-motif DNA and the variations in structure that occur in response to changes in pH have received little attention.
In the present work, the conformational dynamics and folding/unfolding pathways of i-motif DNA are investigated in solution and in the gas-phase. That is, i-motif DNA was studied in solution for the pH range 4.0 – 9.0 at thermodynamic equilibrium using circular dichroism (CD) and during the pH 7.0 → 4.5 transition using photoacoustic calorimetry analysis (PAC), and in the gas-phase using nano electrospray ionization trapped ion mobility spectrometry - mass spectrometry (nanoESI-TIMS-MS) with and without collisional induced activation prior the TIMS-MS analysis. The TIMS-MS measured ion-neutral collision cross sections are used to propose candidate structures based on molecular dynamics (MD) simulations as a way to better understand the i-motif DNA free energy landscape. In addition, the influence of inner cations on the stabilization of gas-phase structures is discussed for partially unfolded i-motif DNA.
EXPERIMENTAL
Materials and reagents
A 21 base, cytosine-rich DNA sequence mimicking the telomeric repeat sequence 5’-[CCCTAA]3CCC-3’ (C198H256N72O121P20, MW 6200 Da) was obtained indistinctly from Eurofins Scientific (Huntsville, AL) and from Integrated DNA Technologies (Coralville, IA) and used without further purification. Nitrobenzaldehyde (2-NBA) powder was obtained from Sigma-Aldrich (St. Louis, MO). Solvents, hydrochloric acid, sodium hydroxide, ammonium acetate, ammonium formate, and ammonium hydroxide salts utilized in this study were analytical grade or better and purchased from Fisher Scientific (Pittsburgh, PA). A Tuning Mix calibration standard (G24221A) was obtained from Agilent Technologies (Santa Clara, CA) and used as received.
Circular Dichroism Analysis (CD)
Circular dichroism spectra were collected using a Jasco J-815 CD spectrometer (Easton, MD) as a function of the solution pH. Spectra were collected from 1 mm quartz cuvettes containing 30 µM i-motif DNA solubilized in deionized water at pH= 4.0, 5.0, 6.0, 7.0, 8.0 and 9.0. Solution pH was adjusted using hydrochloric acid (HCl) and sodium hydroxide (NaOH).
Photo Acoustic Calorimetry Analysis (PAC)
A detailed description of PAC principles of operation and data analysis can be found elsewhere 61. Briefly,a solution of 30 µM i-motif DNA and 1 mM 2-NBA was prepared in deionized water and stored in the dark to prevent unwanted photolysis. Solution pH was adjusted using hydrochloric acid (HCl) and sodium hydroxide (NaOH). A 500 µL solution of i-motif DNA and 2-NBA solution was placed in a 1 cm × 0.5 cm quartz cuvette (Starna Cells) and the cuvette was placed in a temperature-controlled sample holder with magnetic stirring capability (TC 125, Quantum Northwest). The sample solution was stirred during measurements to prevent accumulation of the photoproduct and a fresh aliquot was used for each temperature measurement; the PAC measurements were performed over 16–26 °C temperature range. 2-NBA photo-dissociation and concomitant proton release was triggered by a 355 nm laser pulse (500 µJ, Surelite I-10, Continuum). Fe(III)tetraphenylsulfonato porphyrin (4-SP) solubilized in deionized water at pH 7.0 was employed as a reference compound. The absorbance of the reference solution matched the absorbance of the sample at the excitation wavelength of 355 nm. A piezoelectric transducer (Panametrics RV103, 1 MHz) was adhered to the side of the cuvette and the signal was amplified using an ultrasonic preamplifier (Panametrics 5662). The PAC traces were recorded using a digital oscilloscope (Wave Surfer 42Xs, LeCroy) and were deconvoluted using Sound Analysis software (Quantum Northwest, WA).
Acoustic transducers used in PAC measurements are sensitive to the amplitude of an acoustic wave as well as to its temporal profile. For a two-step sequential decay process on the time scale of the transducer resolution (~50 ns to ~10 µs), the individual contributions of ΔV and ΔH for each kinetic process can be resolved. Changes in the phase and amplitude of the PAC traces can then be correlated with structural changes in solution as a consequence of the pH jump (reaction volume and enthalpy)61. For the initial process (τ < 50 ns), the ratio of the sample and reference PAC signal amplitudes (ϕ1) is related to the reaction volume (ΔVfast) and reaction enthalpy (ΔHfast) according to Eq. 1:
| (1) |
where Ehν = 80.59 kcal mol−1, Φ is the quantum yield of the primary photo-reaction, and Cpρ/β is a temperature-dependent parameter made up of the heat capacity (Cp), density (ρ) and expansion coefficient (β) of the solvent.
For slower processes (50 ns< τ < 10 µs), the ratio of the sample and reference PAC signal amplitudes (ϕ2) is related to the reaction volume (ΔVslow) and enthalpy (ΔHslow) according to Eq. 2:
| (2) |
Trapped Ion Mobility Spectrometry – Mass Spectrometry Analysis (TIMS-MS)
Details regarding the TIMS operation and specifics compared to traditional IMS can be found elsewhere. 19–21, 62, 63 Briefly, mobility separation in TIMS is based on holding the ions stationary using an electric field against a moving gas. The separation in a TIMS device can be described by the center of the mass frame using the same principles as in a conventional IMS drift tube.10 Since mobility separation is related to the number of ion-neutral collisions (or drift time in traditional drift tube cells), the mobility separation in a TIMS device depends on the bath gas drift velocity, ion confinement and ion elution parameters. The reduced mobility, K, of an ion in a TIMS cell is described by:
| (3) |
where vg and E are the velocity of the gas and the applied electric field across the TIMS analyzer region. Velution is the voltage when the ions elute in the Vramp sweep and Vout is the voltage applied at the end of the TIMS analyzer region.
A custom-built, pulled capillary nanoESI source was utilized for all the experiments. Quartz glass capillaries (O.D.: 1.0 mm and I.D.: 0.70 mm) were pulled utilizing a P-2000 micropipette laser puller (Sutter Instruments, Novato, CA) and loaded with 10 µL aliquot of the sample solution. Sample solutions consisted of 1 µM i-motif DNA in 10 mM ammonium acetate solution at three pH values (pH= 4.5, 7.0 and 9.0). Solution pH was adjusted using ammonium formate and ammonium hydroxide salts. A typical nanoESI source voltage of +/− 600–1200 V was applied between the pulled capillary tips and the TIMS-MS instrument inlet. Ions were introduced via a stainless steel tube (1/16 × 0.020’’, IDEX Health Science, Oak Harbor, WA) held at room temperature into the TIMS cell.
The TIMS cartridge is comprised of three regions: an entrance funnel, analyzer tunnel (46 mm axial length), and exit funnel. A 880 kHz and 200 Vpp RF potential was applied to each section creating a dipolar field in the funnel regions and a quadrupolar field inside the tunnel. For collisional induced activation experiments prior the TIMS separation (CIA-TIMS-MS), 2D-TIMS-MS spectra were collected as a function of the axial electric field across the deflector plate and the end of the entrance funnel in 10V intervals of the deflector voltage (Vdeflector = 0–200 V); the voltages across the entrance and exit of the entrance funnel were adjusted relative to Vdeflector to guarantee an homogenous axial electric field in all CIA measurements. TIMS separation was performed using nitrogen as a bath gas at ca. 300 K, at a constant gas flow velocity defined by the pressure difference between entrance funnel P1 = 1.1–4.3 mbar, and the exit funnel P2 = 0.6–3.0 mbar.64, 65
In TIMS operation, multiple geometric isomers/conformers are trapped simultaneously at different E values resulting from a voltage gradient applied across the TIMS tunnel. After thermalization, geometrical isomers/conformers are eluted by decreasing the electric field in stepwise decrements (referred to as the “ramp”). Each isomer/conformer eluting from the TIMS cell can be described by a characteristic voltage (i.e., Velution - Vout). Eluted ions are then mass analyzed and detected by a maXis impact Q-ToF mass spectrometer (Bruker Daltonics Inc, Billerica, MA).
In a TIMS device, the total analysis time can be described as:
| (4) |
where, ttrap is the thermalization/trapping time, ToF is the time after the mobility separation, and Vramp and tramp are the voltage range and time required to vary the electric field, respectively. The elution voltage was experimentally determined by varying the ramp time (tramp = 100, 200, 300, 400 and 500 ms) for a constant ramp voltage sweep. This procedure also determines the time ions spend outside the separation region to (e.g., ion trapping and time-of-flight). The TIMS cell was operated using a fill/trap/ramp/wait sequence of 10/10/50–500/50 ms. The TOF analyzer was operated at 10 kHz (m/z = 100–3500). The data was summed over 100 analysis cycles yielding an analysis time of ~50 s for tramp = 500 ms. Mobility calibration was performed using the Tuning Mix calibration standard (G24221A, Agilent Technologies, Santa Clara, CA) in positive ion mode (e.g., m/z = 322, K0 = 1.376 cm2 V−1 s−1 and m/z = 622, K0 = 1.013 cm2 V−1 s−1).21 The TIMS operation was controlled using in-house software, written in National Instruments Lab VIEW, and synchronized with the maXis Impact Q-ToF acquisition program.19, 20
Reduced mobility values (K0) were correlated with CCS (Ω) using the equation:
| (5) |
where z is the charge of the ion, kB is the Boltzmann constant, N* is the number density and mI and mb refer to the masses of the ion and bath gas, respectively.10 All resolving power (R) values reported herein were determined from Gaussian peak fits of the features in the TIMS distributions (R = Ω/ΔΩ) using OriginPro (version 8.0). The FWHM of the mobility band was used to calculate the ΔΩ.
THEORETICAL
Candidate structures search and assignment from TIMS-MS data was performed based on the workflow described in reference66. Briefly, an initial guess was performed based on the folded i-motif DNA 1ELN structure from protein data bank 67. Molecular dynamic simulations were performed with NAMD (http://www.ks.uiuc.edu/Research/namd/)68 using CHARMM36 force field69, which shows significant improvements over previous force-fields for simulating the nucleic acids.70 CHARMM-GUI71 web-server was used to initialize the MD simulations. The i-motif DNA was solvated in a 53 Å cubic box with TIP3P water model and the system was neutralized by adding eight Mg2+ and two Cl− ions.
A 10,000-step energy minimization was performed using the conjugate gradient and line search algorithm, followed by a 100-ps NVT equilibration at 300 K and 1 atm pressure with periodic boundary conditions. The particle mesh Ewald method72 was used to treat the long-range interactions with a 12 Å nonbonded cutoff. The RATTLE algorithm was used to constrain protein bonds involving hydrogen, and SETTLE was used to maintain water geometry. A 400-ns NPT simulation was performed with a 2 fs integration time step at 300 K and 1 atm pressure. A total of 18,000 structures were submitted to the CCS calculation and clustered based on RMSD using our custom-built R-code software66. A minimum of five distinct center of mass structures (CM) were selected per experimental IMS band observed from the cluster analysis based on energy minimization and CCS calculation as a function of the charge state [CM, CCS]charge. The MD force field energy minimization did not properly describe the hemiprotonated cytosine interactions leading to mostly [CM, CCS]charge of unfolded i-motif DNA. To overcome this limitation, the final set of candidate structures also included structures generated based on the trends observed during the i-motif DNA unfolding 400-ns trajectory and the previously reported i-motif DNA folded structure67. CCSs were calculated using the IMoS (v1.04b)73–75 and PSA76 packages with nitrogen as a bath gas at ca. 300K. In the IMoS calculations, 100 total rotations were performed using the trajectory method with a Maxwell distribution. Molecular visualization was performed using Visual Molecular Dynamics software.77
RESULTS AND DISCUSSION
This work utilizes solution and gas-phase experiments for the study of equilibrium and kinetic intermediates of the i-motif DNA system. Specifically, CD and TIMS-MS provide information of i-motif DNA structures as a function of solution pH, whereas PAC and CIA-TIMS-MS interrogate kinetic intermediates during the folding and unfolding pathways, respectively. These complementary techniques allow different conformational states to be unveiled and provide a more detailed interpretation of the folding pathway and unfolding intermediates in the presence and absence of bulk solvent, respectively. The focus of this paper is towards a better description of the i-motif DNA free energy landscape.
At thermodynamic equilibrium in solution, the transition from basic to acidic pH solution conditions of the i-motif DNA can be characterized by an increase of the 287 nm band and the concomitant decrease of the 272 nm band in the CD signal (see Figure 1), being more significant in the pH = 4.0 – 7.0 range. The observation of two isosbestic points at 245 nm and 276 nm suggests a two state folding mechanism (F↔U) for the i-motif DNA as a function of the solution pH. 78 It should be noted that a two state folding mechanism does not limit the number of conformations to two; that is, multiple conformations may exist at equilibrium in the folded and unfolded states (e.g., the CD signal at pH = 6 contains mixed states).
Figure 1.
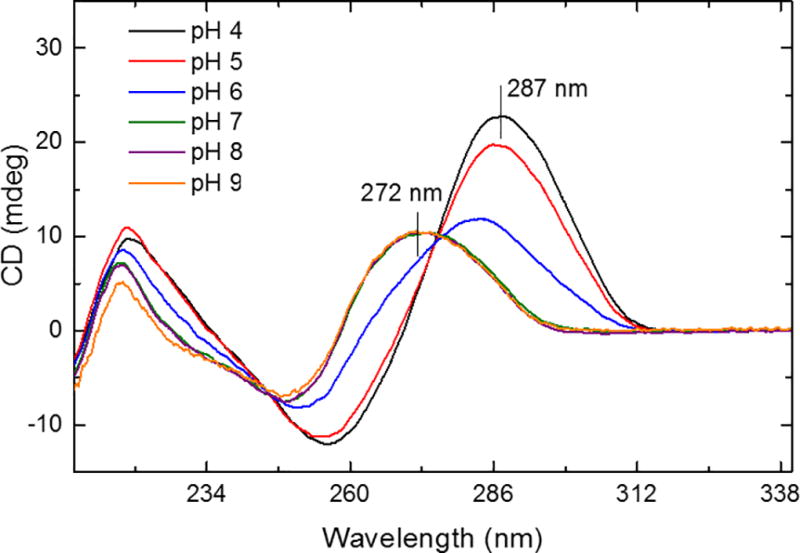
Circular dichroism spectra of i-motif DNA (30 µM in deionized water) as a function of the solution pH =4.0 – 9.0 at 20 °C. Notice that no changes in the spectra are observed in the pH = 7.0 – 9.0 range.
Complementary gas-phase analysis was performed as a function of the solution pH and time after desolvation using nanoESI-TIMS-MS. This gas-phase analysis takes advantage of the desolvation process to effectively reduce sample complexity and permit molecular characterization in the absence of bulk solvent. The rationale is to kinetically trap gas-phase structural populations (or ensemble) in local, free energy minima close to the initial, thermodynamic equilibrated solution-phase structural populations (or ensemble). Previous works have shown the presence of solution memory effects by looking at the changes on the IMS profile as a function of the desolvation time.62, 79–82.
The nanoESI-TIMS-MS analysis of i-motif DNA resulted in the observation of molecular ions in positive and negative ion mode (see Figure 2). In positive mode, a narrow charge state distribution (+3 - +5) is observed with no major variation as the solution pH. In negative mode, a broad distribution of charge states (−3 – −9) is observed with relative abundances changing with the solution pH. We interpret the changes in the MS relative abundances in negative mode with the solution pH increase as a consequence of the loosening of the C•CH+ base pairing that stabilizes the folded i-motif conformation leading to more deprotonation sites in the partially unfolded i-motif DNA structures. In the case of positive mode, as the pH decreases the cytocines become protonated leading to the i-motif folding, limiting the number of accessible protonation sites. Notice that this trend is unique for the i-motif DNA compare to other reported studies of biological molecules (e.g., some peptides and proteins) where denaturing at low pH conditions leads to the observation of higher charge states and native conditions (pH = 6 – 8) show a narrow low charge state distribution.79, 83–91 That is, the stabilization of the i-motif DNA with the reduction of the solution pH results in the observation of a narrow charge state distribution in positive mode. Despite the changes in the MS relative abundances of the charge states with the solution pH, closer inspection of the mobility profiles did not show any dependence on the solution condition or the time after desolvation (details for the TIMS profiles as a function of the time after desolvation overt the 50–500 ms range can be found in the supporting information). Moreover, major changes in the CCS values were observed as a function of the i-motif DNA charge state. Low charge states (e.g., +3 to +5 and −3 to −5) can be described by a single, broad mobility band60, with slightly increasing CCS as a function of the charge state. Notice that the increase of CCS with the charge state is an expected trend and does not necessarily reflect conformational changes for z = +3 to +5 and −3 to −5. However, a major transition is observed at z = −6, with the observation of partially unfolded i-motif DNA structures in the z = −6 to −9 charge states. The CCS trend observed in negative mode as a function of the charge state is in good agreement with previous ESI-TWIMS-MS experiments92–95; however, this study takes advantage of TIMS’s higher mobility resolution to resolve a higher number of IMS bands and to report accurate ion-neutral collision cross sections.
Figure 2.
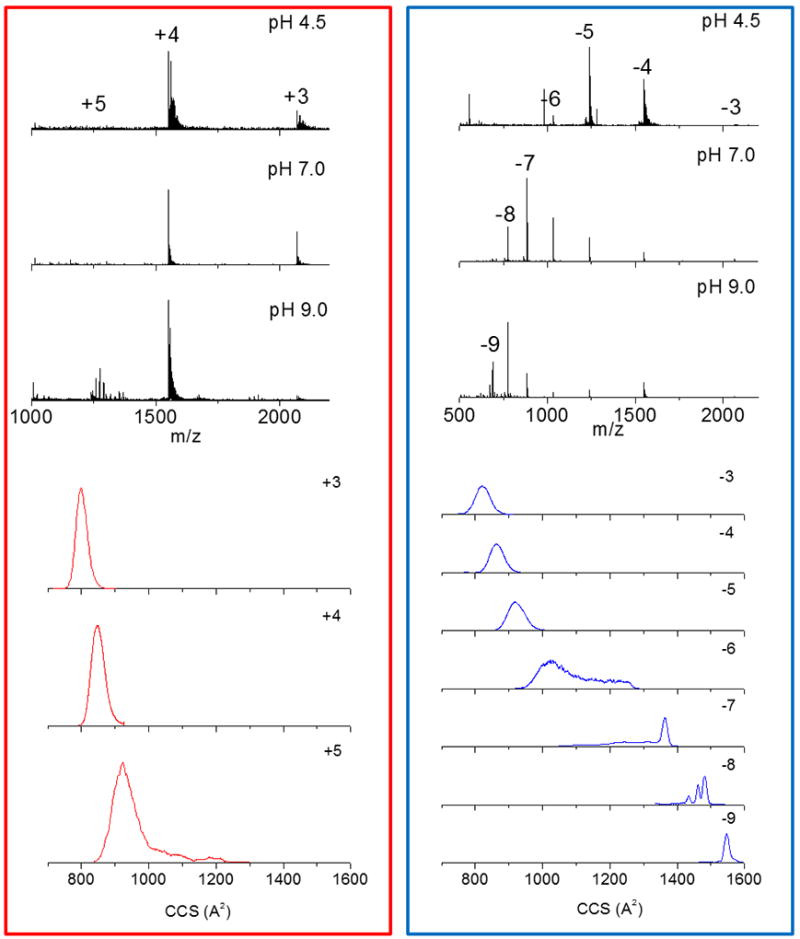
Typical positive (red) and negative (blue) mass spectra (top) and mobility profiles for i-motif DNA as a function of the solution pH (4.0 – 9.0) using low energy injection nanoESI-TIMS-MS. Notice the change in the charge distribution as a function of the solution pH. Changes in individual charge states mobility profiles were not observed as a function of the solution pH conditions.
Solution phase analysis of i-motif DNA transition (U→F) during the pH jump from 7.0 to 4.5 was performed by PAC and permitted the interrogation of the folding process (kinetic intermediates) on the nanosecond to microsecond timescale. The photolysis of 2-NBA leads to a prompt pH decrease (ΔpH ~ 2.5 units) due to the 2-NBA photo-conversion to nitroso-benzoate (see details in Scheme 1). For the 2-NBA photo-dissociation, reaction enthalpy ΔH = −29.2 ± 6.6 kcal mol−1 and volume change ΔV = −5.1 ± 1.6 mL mol−1 were observed in agreement with previously published data.96 In the presence of i-motif DNA, the fast increase in the proton concentration (pH 7.0 → 4.5) initiates the folding of i- motif DNA. Acoustic traces for the photolysis of 2-NBA in the presence of i-motif DNA show a phase shift and amplitude change with respect with the reference acoustic traces, indicative of the presence of two processes, one occurring within the first 50 ns (fast phase, ϕ1), and a temperature-dependent process with a time constant of 140 ns (slow phase, ϕ2) at 20 °C (see Figure 3). After subtraction of ΔV/ΔH determined for 2-NBA photolysis in the absence of i-motif DNA, the reaction parameters for the fast and slow processes are ΔHfast= 8.5 ± 7.0 kcal mol−1 and ΔVfast= 10.4 ± 1.6 mL mol−1 and ΔHslow = −51.5 ± 4.8 kcal mol−1 and ΔVslow = −6.6 ± 0.9 mL mol−1, respectively.
Scheme 1.
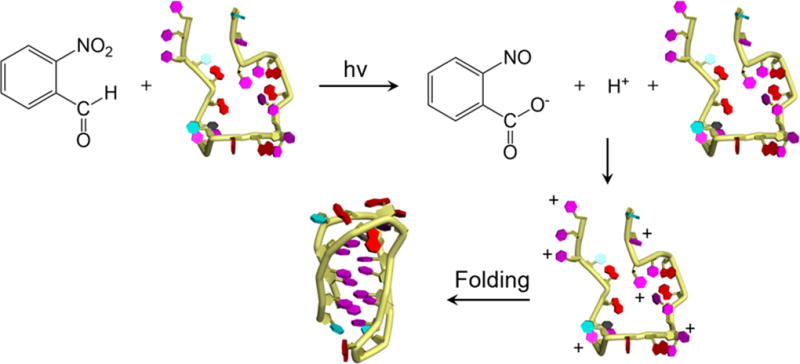
Photo-triggered conversion of 2-nitrobenzaldehyde to 2-nitrosobenzoate and a free proton followed by protonation of the oligonucleotide and folding into the i-motif DNA.
Figure 3.

Plot of the fast (ϕ1) and slow (ϕ2) phases as a function of Cpρ/β in the 16 – 26 °C temperature range. In the inset, PAC traces for 2-NBA photo-dissociation in the presence of i-motif DNA sample (blue) and 4SP reference compound (red) at 16 °C.
The fast process observed in PAC measurements (τ < 50 ns) can be attributed i) to the photo-dissociation of 2-NBA and concomitant release of protons (with a time constant of ~20 ns97) and ii) to cytosine residue protonation (assuming the rate of pyridine protonation in solution ~ tens of picoseconds)98. During the pH jump (pH 7.0 → 4.5), approximately six cytosine residues (pKa = 4.58)99 will be protonated with an enthalpy change of −30 kcal mol−1 (assuming a ΔH = −5.0 kcal mol−1 per cytosine residue100). Since a positive enthalpy change of 8.5 ± 7.0 kcal mol−1 was determined for the fast process, an additional endothermic process with ΔH ~ 38.5 ± 7.0 kcal mol−1 must occur within 50 ns of 2-NBA dissociation. This endothermic enthalpy change can be attributed to the decrease in the solvent electrostriction due to reduction of the overall DNA charge.
The reaction parameters determined for the slow phase are consistent with i-motif DNA nucleation. Nucleation of the intramolecular i-motif DNA structure requires the formation of at least one hemiprotonated cytosine base pair, an interaction that consists of three hydrogen bonds between one protonated and one neutral cytosine residue within an oligonucleotide. Though empirical measurements of the enthalpy of this specific base-pairing interaction are not available, the enthalpy of inter base pair hydrogen bond formation was determined for the canonical GC Watson-Crick base to be −8.0 kcal mol−1.101 Within the intramolecular i-motif DNA with six protonated cytosines, up to six cytosine-cytosine base-pairing interactions can be formed for a contribution of −48 kcal mol−1 to the observed enthalpy for the folding process. In addition, formation of the i-motif structure results in stacking of the cytosine bases, an interaction with an enthalpy of −5.0 kcal mol−1 per base pair stack.102 Formation of the folded i-motif DNA structure results in the formation of 5 base pair stacking interactions with a contribution of −25 kcal mol−1 to the observed enthalpy. Therefore, formation of the fully folded i-motif DNA should provide ΔHobs= −73 kcal mol−1 or ~−12 kcal mol−1 per hemiprotonated cytosine base pair. The enthalpy change determined here for the slow process ΔHslow = −51.5 ± 4.8 kcal mol−1 reflects the formation of approximately 4.5 hemiprotonated cytosine base pairs. The observed volume change (ΔVslow = −6.6 ± 0.9 mL mol−1) is consistent with the formation of hemiprotonated cytosine base pairs and concomitant collapse of the oligonucleotide into a more compact conformation with a smaller volume as observed previously using small angle X-ray scattering.103 The overall reaction enthalpy change (ΔHfast+ ΔHslow = 43 ± 7 kcal mol−1) is similar to that previously determined by NMR for the intramolecular folding of a similar cytosine-rich strand (5’-[TCC]4-3’) with fewer potential base pairing interactions (−43 kcal mol−1)104 and for the reverse process of i-motif DNA unfolding using differential scanning calorimetry (66 kcal mol−1).102 That is, the PAC experiments suggest that during the pH 7.0 → 4.5 transition, the i-motif DNA folds in two consecutive steps: i) protonation of cytosines and ii) nucleation and stacking towards the i-motif DNA structure. In addition, the time scale of the PAC measurement (50ns - 10µs) does not probe rearrangements occurring in timescales larger than a few microseconds; that is, these results suggest that due to the nature of the i-motif folding (C•CH+ pairing and stacking) other kinetic intermediates are likely to be populated in the millisecond timescale. Notice that PAC measurements access kinetic intermediates, not accessible during CD measurements performed at thermodynamic equilibrium. That is, CD and PAC measurements provide complementary information on the solution conditions and intermediate transitions characteristic of the DNA i-motif folding, respectively.
In the gas-phase, collisional induced activation prior to the TIMS-MS analysis was used to access kinetic intermediates not accessible during the solution conditions (e.g., pH variation) and desolvation process. Previous reports have shown the advantage of this methodology for the study of biomolecules and biomolecular complexes using in-source activation and collision induced unfolding (CIU) prior to IMS-MS analysis.14, 82, 105–109 Notice that in the case of CIA-TIMS-MS, the extent of activation is limited by the local pressure and the electric field range accessible in the TIMS cartridge (i.e., there is a higher limit in the electric field to avoid breakdown). We prefer to called it CIA instead of CIU since the cooling process that occurs during the TIMS measurement can also lead to refolding into a more compact structure not accessible during the molecular ion formation. In the case of i-motif DNA, the intramolecular forces (C•CH+ pairing) that define the folded states are overcome for the populations observed at z = −6. Our interpretation of the broad, bimodal mobility distribution is the existence of a transition point towards multiple local free energy minima: from folded to unfolded i-motif DNA (see Figure 2). Notice that the observation of a broad distribution can be justify with the co-existence of multiple minima reflecting the noncanonical hemiprotonated cytosine base pairing mechanism. A more detailed investigation using collisional induced activation of the i-motif-DNA prior to the TIMS mobility separation confirmed that most of the unfolding of the i-motif DNA structure occurs for z = − 6 (see Figure 4). The z = −5 charge state also showed a movement toward unfolding, with the population of a new IMS band at larger CCS value. This result suggests that the conformational interconversion energy barriers for the z= −5 and z= −6 charge state structure can be easily overcome with collisional activation prior to the mobility separation and that the existence of multiple, local free energy minima can be visualized by the broad IMS profiles observed at z = −5, −6 and −7. The broad distribution of z = −5, −6 and −7 IMS bands does not allow to make a discrete annotation on the number of conformational states (at least with TIMS measurements performed at room temperature). Changes in the mobility profiles for the other charge states upon activation were not observed. The bimodal distribution and changes in the mobility profile upon activation using CIA-TIMS-MS agree with previous reports of i-motif DNA activation in the entrance cone of a TWIMS-MS.60
Figure 4.
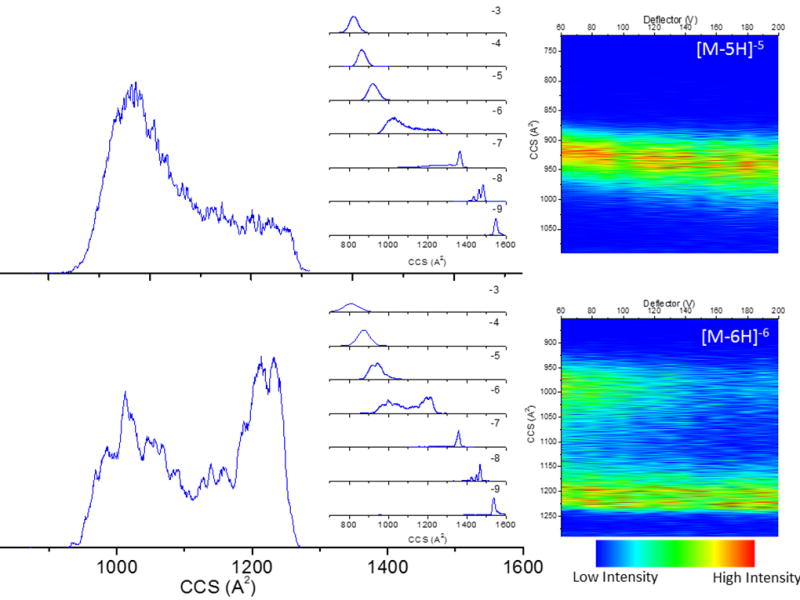
Typical CIA-TIMS-MS profiles of i-motif DNA as a function of the deflector voltage Vdeflector 60V (top) and 140V (bottom). Notice the change in the mobility distribution for the z= −5 and z= −6 as a function of the molecular ion activation prior the TIMS-MS analysis.
The search for candidate structures resulted in the generation of an average structure for the major mobility trends observed in Figures 2 and 4. Inspection of the candidate structures suggest that the folded state observed for the low charge states (+3 to +5 and −3 to −5) shares the same main interactions: stabilization via cytosine-cytosine+ (C•CH+) and adenosine – thymidine (A-T) base pairing at weakly acidic pH values (see Figure 5). The most compact structure was observed for z = +3, with only small differences in the distances between the base pairs (vertical direction in Figure 5) as the charge state increases from +3 to +5 and from −3 to −5. That is, major conformational differences were not observed between candidate structures proposed for positive and negative ions (e.g., +3 to +5 and −3 to −5); our interpretation is that differences in the CCS values are mostly due to the charge state and the internal base pairing stacking. Inspection of the candidate structures at the z = −6 charge state suggests that the broad, bimodal CCS distribution is probably due to cytosine neutralization. That is, the i-motif DNA structure begins transformation towards an overall larger CCS trend where a semi-open hairpin structure with a relaxed 5’ end first appears. Specifically, this larger CCS trend has the common loss of the cytosine-cytosine+ (C•CH+) interactions in one of the CCC strands for the extended z = −6 and the z = −7 charge states, with a further loss of the second CCC strand interactions for the z = −8 and z = −9 charge states. The folding pattern proposed as a function of the charge state is in good agreement with the previous studies suggesting that the hairpin-like structures are the most stable conformations during the i-motif DNA deprotonation.110 While full unfolding of the i-motif DNA is never reached during CIA-TIMS-MS, the CCS profiles and candidate structures are in good agreement with previously reported DNA structural models103. Notice that the proposed candidate structures were generated based on a 400ns MD trajectory and the previously reported i-motif DNA folded structure67. The MD simulation described the unfolding of the i-motif DNA using a starting structure with deprotonated cytosines. Other MD attempts to simulate the folding of the i-motif- DNA using protonated cytosines were not successful; our interpretation is that further development of the force fields are required to better simulate DNA interactions and base pair stacking111. Nevertheless, for the first time candidate structures are proposed for kinetically trapped intermediates of the i-motif DNA folding which allows for a better mechanistic understanding of the free energy landscape.
Figure 5.
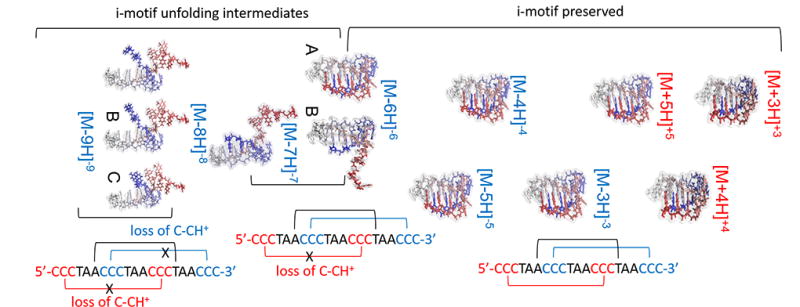
Candidate structures proposed for the i-motif DNA mobility bands observed. Main intramolecular interactions are denoted. CCSs of the candidate structures are reported in Table 1.
In addition to structural changes of the i-motif DNA as a consequence of the noncanonical hemiprotonated cytosine base pairing, the presence of inner cations may also induce preference for alternative kinetically trapped conformations in the gas-phase. For example, closer inspection of the higher charge state distributions showed the presence of multiple sodium and ammonium adducts for z= −7 and z= −8 (see Figure 6). These adducts can be attached to the i-motif-DNA structure and result in: i) no conformational changes (no shift in the IMS profile), or ii) can stabilize the i-motif DNA structure in other folding states (shift in the IMS profile). Inspection of the mobility profiles in the presence of adducts shows that while ammonium incorporation does not drive major changes in the mobility profile, sodium adducts act as a positively charge contact point between negatively charged strands (most likely phosphate groups) of the i-motif-DNA resulting in more compact structures. Since both z = −7 and z = −8 are partially unfolded, the appearance of new mobility bands suggests that sodium ions acts as bridges between the CCC strands, stabilizing the complex in other local free energy minima. That is, the introduction of the sodium cation may allow CCC strands to come together and create a sodium mediated bond, forming a tighter structure (smaller CCS). The interaction of inner cations on DNA folding will be further investigated utilizing this methodology in a following publication.
Figure 6.
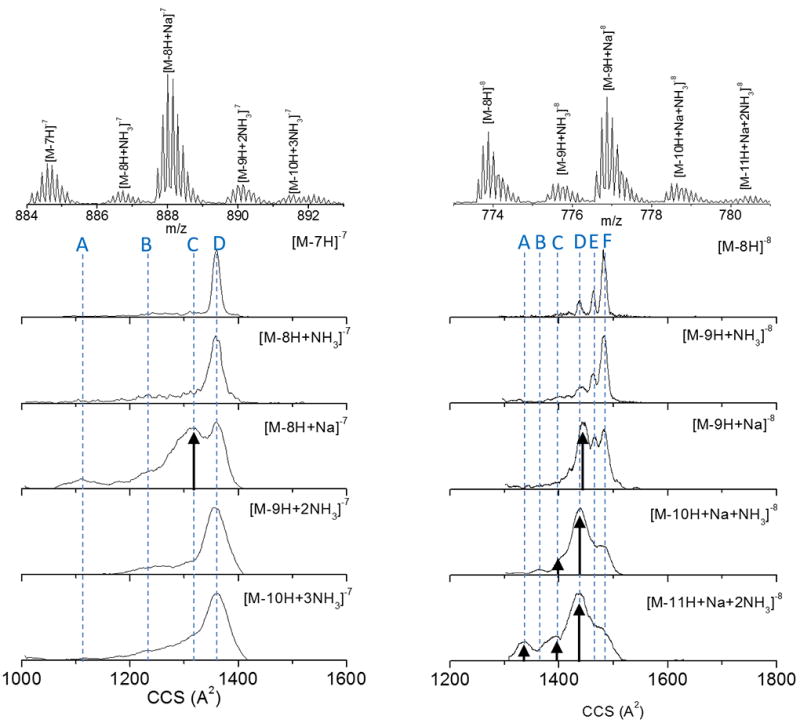
Typical mass spectra and mobility profiles for different i-motif DNA molecular ions observed at the z= −7 and z= −8 charge state. Notice the change in the mobility distribution in the presence of the ammonium and sodium adducts.
CONCLUSIONS
Folding dynamics of i-motif DNA in solution and in the gas-phase were studied using circular dichroism, photoacoustic calorimetry, trapped ion mobility spectrometry and molecular dynamics. Solution studies using CD showed a two state folding mechanism (F↔U) for the i-motif DNA as a function of the solution pH = 4.0 – 9.0 at thermodynamic equilibrium. The photolysis of 2-NBA in the presence of i-motif DNA displayed a phase shift indicating the presence of two processes, one occurring within 50 ns (fast phase) of the laser pulse and a temperature-dependent process with a time constant of 140 ns (slow phase) at 20 °C with an overall reaction enthalpy change (ΔHfast+ ΔHslow = 43 ± 7 kcal mol−1). The observed volume change during PAC experiments suggested the formation of hemiprotonated cytosine base pairs and concomitant collapse of the i-motif oligonucleotide into a more compact conformation with a smaller volume during the pH 7.0 → 4.5 transition at kinetic equilibrium. The nanoESI-TIMS-MS experiments showed that during the nanoESI process the i-motif DNA structures are kinetically trapped in intermediates that retain the main conformational motifs (C•CH+ base pairing) for low charge states. In particular, an i-motif DNA structure is observed for the low charge states in both positive and negative ion mode (e.g., +/− 3 to +/−5) at low pH conditions. With the pH increase the cytosines become neutralized leading to the loss of the cytosine-cytosine+ (C•CH+) base pairing in the CCC stretches and a charge state distribution increase to higher charges is observed in negative mode. The loss of the cytosine-cytosine+ (C•CH+) base pairing in the CCC stretches results in the observation of partially unfolded i-motif DNA conformations. CIA-TIMS-MS experiments showed a broad IMS distribution for z = −5, −6 and −7 and the existence of multiple, local free energy minima different from those obtained by varying the pH solution conditions. Molecular dynamics simulations were used to sample the gas-phase conformations and to generate candidate structures during i-motif DNA unfolding. For the first time, an unfolding mechanism is supported by average candidate structures from mobility measurements as a function of the i-motif DNA unfolding pathway and the main intramolecular interactions that stabilized the process are described. Inspection of partially unfolded i-motif DNA structures, for intermediate charge states in negative ion mode, showed that sodium, but not ammonium, induces changes in the population of gas-phase kinetic intermediates.
Supplementary Material
Table 1.
Experimental and theoretical collision cross sections for i-motif DNA bands observed in positive and negative ion mode in nanoESI-TIMS-MS and proposed candidate structures, respectively.
| z | K0 (cm2 V−1 s −1) | Experimental CCSN2 (Å2) |
Theoretical CCSN2 (Å2) |
|---|---|---|---|
|
| |||
| +3 | 0.748 | 800 | 811 |
|
| |||
| +4 | 0.944 | 846 | 846 |
|
| |||
| +5 | 1.089 | 922 | 926 |
|
| |||
| −3 | 0.729 | 821 | 832 |
|
| |||
| −4 | 0.931 | 863 | 865 |
|
| |||
| −5 | 1.096 | 917 | 903 |
|
| |||
| −6 | 1.178 | 1023 (A) | 1021 |
| 1.013 | 1190 (B) | 1166 | |
|
| |||
| −7 | 1.267 | 1111 (A) | - |
| 1.140 | 1234 (B) | - | |
| 1.071 | 1314 (C) | - | |
| 1.034 | 1360 (D) | 1378 | |
|
| |||
| −8 | 1.204 | 1335 (A) | - |
| 1.181 | 1362 (B) | - | |
| 1.153 | 1394 (C) | - | |
| 1.119 | 1436 (D) | 1445 | |
| 1.100 | 1462 (E) | 1455 | |
| 1.085 | 1482 (F) | 1492 | |
|
| |||
| −9 | 1.168 | 1548 | 1546 |
Acknowledgments
This work was supported by the National Institute of Health (Grant No. R00GM106414) and a FFL Bruker Daltonics, Inc. fellowship. The authors would like to thank Dr. Carlos Larriba-Andaluz and Dr. Christian Bleiholder for helpful discussions during the theoretical CCS calculations. We will like to acknowledge the Instructional & Research Computing Center (IRCC) at Florida International University for providing computing resources.
Footnotes
ASSOCIATED CONTENT
In the supporting information, a video of the 400ns MD trajectory during i-motif DNA unfolding and the pdb files of all the candidate structures is provided.
The authors declare no competing financial interest.
References
- 1.Scarff CA, Thalassinos K, Hilton GR, Scrivens JH. Rapid Communications in Mass Spectrometry. 2008;22:3297–3304. doi: 10.1002/rcm.3737. [DOI] [PubMed] [Google Scholar]
- 2.Feng X, Liu X, Luo Q, Liu B-F. Mass Spectrometry Reviews. 2008;27:635–660. doi: 10.1002/mas.20182. [DOI] [PubMed] [Google Scholar]
- 3.Simoneit BRT. Mass Spectrometry Reviews. 2005;24:719–765. doi: 10.1002/mas.20036. [DOI] [PubMed] [Google Scholar]
- 4.Loo JA. Mass Spectrometry Reviews. 1997;16:1–23. doi: 10.1002/(SICI)1098-2787(1997)16:1<1::AID-MAS1>3.0.CO;2-L. [DOI] [PubMed] [Google Scholar]
- 5.Winston RL, Fitzgerald MC. Mass Spectrometry Reviews. 1997;16:165–179. doi: 10.1002/(SICI)1098-2787(1997)16:4<165::AID-MAS1>3.0.CO;2-F. [DOI] [PubMed] [Google Scholar]
- 6.Miranker A, Robinson CV, Radford SE, Aplin RT, Dobson CM. Science. 1993;262:896–900. doi: 10.1126/science.8235611. [DOI] [PubMed] [Google Scholar]
- 7.Kanu AB, Dwivedi P, Tam M, Matz L, Hill HH. Journal of Mass Spectrometry. 2008;43:1–22. doi: 10.1002/jms.1383. [DOI] [PubMed] [Google Scholar]
- 8.Maurer MM, Donohoe GC, Valentine SJ. Analyst. 2015;140:6782–6798. doi: 10.1039/c5an00922g. [DOI] [PubMed] [Google Scholar]
- 9.Wyttenbach T, Pierson NA, Clemmer DE, Bowers MT. Annual Review of Physical Chemistry, Vol 65. 2014;65:175–196. doi: 10.1146/annurev-physchem-040513-103644. [DOI] [PubMed] [Google Scholar]
- 10.McDaniel EW, Mason EA. Mobility and diffusion of ions in gases. John Wiley and Sons, Inc.; New York, New York: 1973. [Google Scholar]
- 11.Gillig KJ, Ruotolo BT, Stone EG, Russell DH. Int. J. Mass Spectrom. 2004;239:43–49. [Google Scholar]
- 12.Silveira JA, Gamage CM, Blase RC, Russell DH. International Journal of Mass Spectrometry. 2010;296:36–42. [Google Scholar]
- 13.Guo Y, Wang J, Javahery G, Thomson BA, Siu KWM. Analytical Chemistry. 2004;77:266–275. doi: 10.1021/ac048974n. [DOI] [PubMed] [Google Scholar]
- 14.Koeniger SL, Merenbloom SI, Valentine SJ, Jarrold MF, Udseth HR, Smith RD, Clemmer DE. Anal. Chem. 2006;78:4161–4174. doi: 10.1021/ac051060w. [DOI] [PubMed] [Google Scholar]
- 15.Kurulugama RT, Nachtigall FM, Lee S, Valentine SJ, Clemmer DE. Journal of the American Society for Mass Spectrometry. 2009;20:729–737. doi: 10.1016/j.jasms.2008.11.022. [DOI] [PMC free article] [PubMed] [Google Scholar]
- 16.Glaskin RS, Valentine SJ, Clemmer DE. Analytical Chemistry. 2010;82:8266–8271. doi: 10.1021/ac1017474. [DOI] [PubMed] [Google Scholar]
- 17.Pringle SD, Giles K, Wildgoose JL, Williams JP, Slade SE, Thalassinos K, Bateman RH, Bowers MT, Scrivens JH. Int. J. Mass Spectrom. 2007;261:1–12. [Google Scholar]
- 18.Bush MF, Hall Z, Giles K, Hoyes J, Robinson CV, Ruotolo BT. Analytical Chemistry. 2010;82:9557–9565. doi: 10.1021/ac1022953. [DOI] [PubMed] [Google Scholar]
- 19.Fernandez-Lima FA, Kaplan DA, Park MA. Rev. Sci. Instr. 2011;82:126106. doi: 10.1063/1.3665933. [DOI] [PMC free article] [PubMed] [Google Scholar]
- 20.Fernandez-Lima FA, Kaplan DA, Suetering J, Park MA. International Journal for Ion Mobility Spectrometry. 2011;14:93–98. doi: 10.1007/s12127-011-0067-8. [DOI] [PMC free article] [PubMed] [Google Scholar]
- 21.Hernandez DR, DeBord JD, Ridgeway ME, Kaplan DA, Park MA, Fernandez-Lima FA. Analyst. 2014;139:1913–1921. doi: 10.1039/c3an02174b. [DOI] [PMC free article] [PubMed] [Google Scholar]
- 22.Benigni P, Thompson CJ, Ridgeway ME, Park MA, Fernandez-Lima FA. Analytical Chemistry. 2015;87:4321–4325. doi: 10.1021/ac504866v. [DOI] [PMC free article] [PubMed] [Google Scholar]
- 23.Silveira JA, Ridgeway ME, Park MA. Analytical Chemistry. 2014;86:5624–5627. doi: 10.1021/ac501261h. [DOI] [PubMed] [Google Scholar]
- 24.Webb IK, Garimella SVB, Tolmachev T-C, Chen AV, Zhang X, Norheim RV, Prost SA, LaMarche B, Anderson GA, Ibrahim YM, Smith RD. Analytical Chemistry. 2014;86:9169–9176. doi: 10.1021/ac502055e. [DOI] [PMC free article] [PubMed] [Google Scholar]
- 25.Warnke S, Seo J, Boschmans J, Sobott F, Scrivens JH, Bleiholder C, Bowers MT, Gewinner S, Schöllkopf W, Pagel K, von Helden G. Journal Of The American Chemical Society. 2015;137:4236–4242. doi: 10.1021/jacs.5b01338. [DOI] [PubMed] [Google Scholar]
- 26.Masson A, Kamrath M, Perez MS, Glover M, Rothlisberger U, Clemmer D, Rizzo T. Journal of the American Society for Mass Spectrometry. 2015:1–11. doi: 10.1007/s13361-015-1172-4. [DOI] [PubMed] [Google Scholar]
- 27.Drayss MK, Blunk D, Oomens J, Polfer N, Schmuck C, Gao B, Wyttenbach T, Bowers MT, Schäfer M. International Journal of Mass Spectrometry. 2009;281:97–100. [Google Scholar]
- 28.Joly L, Antoine R, Albrieux F, Ballivian R, Broyer M, Chirot F, Lemoine J, Dugourd P, Greco C, Mitrić R, Bonačić-Koutecký V. The Journal of Physical Chemistry B. 2009;113:11293–11300. doi: 10.1021/jp9037478. [DOI] [PubMed] [Google Scholar]
- 29.Turecek F, Moss CL, Pikalov I, Pepin R, Gulyuz K, Polfer NC, Bush MF, Brown J, Williams J, Richardson K. International Journal of Mass Spectrometry. 2013;354–355:249–256. [Google Scholar]
- 30.Fernandez-Lima F, Kaplan DA, Suetering J, Park MA. International journal for ion mobility spectrometry : official publication of the International Society for Ion Mobility Spectrometry. 2011;14:93–98. doi: 10.1007/s12127-011-0067-8. [DOI] [PMC free article] [PubMed] [Google Scholar]
- 31.Hernandez DR, Debord JD, Ridgeway ME, Kaplan DA, Park MA, Fernandez-Lima F. Analyst. 2014;139:1913–1921. doi: 10.1039/c3an02174b. [DOI] [PMC free article] [PubMed] [Google Scholar]
- 32.Schenk ER, Mendez V, Landrum JT, Ridgeway ME, Park MA, Fernandez-Lima F. Anal Chem. 2014;86:2019–2024. doi: 10.1021/ac403153m. [DOI] [PMC free article] [PubMed] [Google Scholar]
- 33.Adams KJ, Montero D, Aga D, Fernandez-Lima F. International Journal for Ion Mobility Spectrometry. 2016;19:69–76. doi: 10.1007/s12127-016-0198-z. [DOI] [PMC free article] [PubMed] [Google Scholar]
- 34.Benigni P, Marin R, Fernandez-Lima F. International Journal for Ion Mobility Spectrometry. 2015:1–7. doi: 10.1007/s12127-015-0175-y. [DOI] [PMC free article] [PubMed] [Google Scholar]
- 35.Schenk ER, Ridgeway ME, Park MA, Leng F, Fernandez-Lima F. Anal Chem. 2014;86:1210–1214. doi: 10.1021/ac403386q. [DOI] [PMC free article] [PubMed] [Google Scholar]
- 36.Benigni P, Fernandez-Lima F. Analytical Chemistry. 2016;88:7404–7412. doi: 10.1021/acs.analchem.6b01946. [DOI] [PubMed] [Google Scholar]
- 37.Schenk ER, Almeida R, Miksovska J, Ridgeway ME, Park MA, Fernandez-Lima F. J Am Soc Mass Spectrom. 2015;26:555–563. doi: 10.1007/s13361-014-1067-9. [DOI] [PMC free article] [PubMed] [Google Scholar]
- 38.Gonzalez WG, Ramos V, Diaz M, Garabedian A, Molano-Arevalo JC, Fernandez-Lima F, Miksovska J. Biochemistry. 2016;55:1873–1886. doi: 10.1021/acs.biochem.6b00067. [DOI] [PMC free article] [PubMed] [Google Scholar]
- 39.Liu FC, Kirk SR, Bleiholder C. Analyst. 2016 doi: 10.1039/C5AN02399H. [DOI] [PubMed] [Google Scholar]
- 40.Ridgeway ME, Silveira JA, Meier JE, Park MA. Analyst. 2015;140:6964–6972. doi: 10.1039/c5an00841g. [DOI] [PubMed] [Google Scholar]
- 41.Benigni P, Marin R, Molano-Arevalo JC, Garabedian A, Wolff JJ, Ridgeway ME, Park MA, Fernandez-Lima F. International Journal for Ion Mobility Spectrometry. 2016;19:95–104. doi: 10.1007/s12127-016-0201-8. [DOI] [PMC free article] [PubMed] [Google Scholar]
- 42.Frost L, Baez MAM, Harrilal C, Garabedian A, Fernandez-Lima F, Leng F. Plos One. 2015;10:e0130478. doi: 10.1371/journal.pone.0130478. [DOI] [PMC free article] [PubMed] [Google Scholar]
- 43.Molano-Arevalo JC, Hernandez DR, Gonzalez WG, Miksovska J, Ridgeway ME, Park MA, Fernandez-Lima F. Anal Chem. 2014;86:10223–10230. doi: 10.1021/ac5023666. [DOI] [PMC free article] [PubMed] [Google Scholar]
- 44.McKenzie-Coe A, DeBord JD, Ridgeway M, Park M, Eiceman G, Fernandez-Lima F. Analyst. 2015;140:5692–5699. doi: 10.1039/c5an00527b. [DOI] [PMC free article] [PubMed] [Google Scholar]
- 45.Špacková N, Berger I, Egli M, Šponer J. Journal of the American Chemical Society. 1998;120:6147–6151. doi: 10.1021/ja002656y. [DOI] [PubMed] [Google Scholar]
- 46.Berger I, Egli M, Spackova N, Sponer J, Rich A. Nucleosides and Nucleotides. 1999;18:1583–1585. [Google Scholar]
- 47.Gehring K, Leroy Jl Fau - Gueron M, Gueron M. Nature. 1993;363:561–565. doi: 10.1038/363561a0. [DOI] [PubMed] [Google Scholar]
- 48.Liedl T, Simmel FC. Nano Letters. 2005;5:1894–1898. doi: 10.1021/nl051180j. [DOI] [PubMed] [Google Scholar]
- 49.Liu D, Balasubramanian S. Angewandte Chemie International Edition. 2003;42:5734–5736. doi: 10.1002/anie.200352402. [DOI] [PubMed] [Google Scholar]
- 50.Amato J, Iaccarino N, Randazzo A, Novellino E, Pagano B. ChemMedChem. 2014;9:2026–2030. doi: 10.1002/cmdc.201402153. [DOI] [PubMed] [Google Scholar]
- 51.Catasti P, Chen X, Deaven LL, Moyzis RK, Bradbury EM, Gupta G. Journal of Molecular Biology. 1997;272:369–382. doi: 10.1006/jmbi.1997.1248. [DOI] [PubMed] [Google Scholar]
- 52.Brooks TA, Kendrick S Fau - Hurley L, Hurley L. FEBS Journal. 2010;277:3459–3469. doi: 10.1111/j.1742-4658.2010.07759.x. [DOI] [PMC free article] [PubMed] [Google Scholar]
- 53.Shafer RH, Smirnov I. Biopolymers. 2001;56:209–227. doi: 10.1002/1097-0282(2000/2001)56:3<209::AID-BIP10018>3.0.CO;2-Y. [DOI] [PubMed] [Google Scholar]
- 54.Dong Y, Yang Z, Liu D. Accounts of Chemical Research. 2014;47:1853–1860. doi: 10.1021/ar500073a. [DOI] [PubMed] [Google Scholar]
- 55.Parkinson GN. In: Quadruplex Nucleic Acids. Neidle S, Balasubramanian S, editors. The Royal Society of Chemistry; 2006. pp. 1–30. [DOI] [Google Scholar]
- 56.Burge S, Parkinson GN, Hazel P, Todd AK, Neidle S. Nucleic Acids Research. 2006;34:5402–5415. doi: 10.1093/nar/gkl655. [DOI] [PMC free article] [PubMed] [Google Scholar]
- 57.Williamson JR. Annual Review of Biophysics and Biomolecular Structure. 1994;23:703–730. doi: 10.1146/annurev.bb.23.060194.003415. [DOI] [PubMed] [Google Scholar]
- 58.Baker ES, Bernstein SL, Gabelica V, De Pauw E, Bowers MT. International Journal of Mass Spectrometry. 2006;253:225–237. [Google Scholar]
- 59.Gabelica V, Shammel Baker E, Teulade-Fichou M-P, De Pauw E, Bowers MT. Journal of the American Chemical Society. 2007;129:895–904. doi: 10.1021/ja065989p. [DOI] [PubMed] [Google Scholar]
- 60.Rosu F, Gabelica V Fau - Joly L, Joly L Fau - Gregoire G, Gregoire G Fau - De Pauw E, De Pauw E. Phys. Chem. Chem. Phys. 2010;12:13448–13454. doi: 10.1039/c0cp00782j. [DOI] [PubMed] [Google Scholar]
- 61.Astudillo L, Bernad S, Derrien V, Sebban P, Miksovska J. Journal of Inorganic Biochemistry. 2013;129:23–29. doi: 10.1016/j.jinorgbio.2013.08.006. [DOI] [PubMed] [Google Scholar]
- 62.Schenk ER, Ridgeway ME, Park MA, Leng F, Fernandez-Lima FA. Anal. Chem. 2014;86:1210–1214. doi: 10.1021/ac403386q. [DOI] [PMC free article] [PubMed] [Google Scholar]
- 63.Schenk ER, Mendez V, Landrum JT, Ridgeway ME, Park MA, Fernandez-Lima F. Anal. Chem. 2014;86:2019–2024. doi: 10.1021/ac403153m. [DOI] [PMC free article] [PubMed] [Google Scholar]
- 64.Adams KJ, Montero D, Aga D, Fernandez-Lima F. International Journal for Ion Mobility Spectrometry. 2016:1–8. doi: 10.1007/s12127-016-0198-z. [DOI] [PMC free article] [PubMed] [Google Scholar]
- 65.Benigni P, Marin R, Molano-Arevalo JC, Garabedian A, Wolff JJ, Ridgeway ME, Park MA, Fernandez-Lima F. International Journal for Ion Mobility Spectrometry. 2016:1–10. doi: 10.1007/s12127-016-0201-8. [DOI] [PMC free article] [PubMed] [Google Scholar]
- 66.Schenk ER, Nau F, Fernandez-Lima F. Int. J. Ion Mobility Spectrom. 2015;18:23–29. doi: 10.1007/s12127-015-0165-0. [DOI] [PMC free article] [PubMed] [Google Scholar]
- 67.Phan AT, Guéron M, Leroy J-L. Journal of Molecular Biology. 2000;299:123–144. doi: 10.1006/jmbi.2000.3613. [DOI] [PubMed] [Google Scholar]
- 68.Phillips JC, Braun R, Wang W, Gumbart J, Tajkhorshid E, Villa E, Chipot C, Skeel RD, Kalé L, Schulten K. Journal of Computational Chemistry. 2005;26:1781–1802. doi: 10.1002/jcc.20289. [DOI] [PMC free article] [PubMed] [Google Scholar]
- 69.Hart K, Foloppe N, Baker CM, Denning EJ, Nilsson L, MacKerell AD. Journal of Chemical Theory and Computation. 2012;8:348–362. doi: 10.1021/ct200723y. [DOI] [PMC free article] [PubMed] [Google Scholar]
- 70.Pérez A, Marchán I, Svozil D, Sponer J, Cheatham TE, Iii, Laughton CA, Orozco M. Biophysical Journal. 2007;92:3817–3829. doi: 10.1529/biophysj.106.097782. [DOI] [PMC free article] [PubMed] [Google Scholar]
- 71.Jo S, Kim T, Iyer VG, Im W. J Comput Chem. 2008;29:1859–1865. doi: 10.1002/jcc.20945. [DOI] [PubMed] [Google Scholar]
- 72.Ewald PP. Annalen der Physik. 1921;369:253–287. [Google Scholar]
- 73.Larriba C, Hogan CJ. The Journal of Physical Chemistry A. 2013;117:3887–3901. doi: 10.1021/jp312432z. [DOI] [PubMed] [Google Scholar]
- 74.Larriba C, Hogan CJ. Journal of Computational Physics. 2013;251:344–363. [Google Scholar]
- 75.Ouyang H, Larriba-Andaluz C, Oberreit D, Hogan C., Jr Journal of the American Society for Mass Spectrometry. 2013;24:1833–1847. doi: 10.1007/s13361-013-0724-8. [DOI] [PubMed] [Google Scholar]
- 76.Bleiholder C, Wyttenbach T, Bowers MT. International Journal of Mass Spectrometry. 2011;308:1–10. [Google Scholar]
- 77.Humphrey W, Dalke A, Schulten K. J. Mol. Graph. 1996;14:33–38. doi: 10.1016/0263-7855(96)00018-5. [DOI] [PubMed] [Google Scholar]
- 78.Choi J, Kim S, Tachikawa T, Fujitsuka M, Majima T. Journal of the American Chemical Society. 2011;133:16146–16153. doi: 10.1021/ja2061984. [DOI] [PubMed] [Google Scholar]
- 79.Pierson NA, Chen L, Valentine SJ, Russell DH, Clemmer DE. Journal Of The American Chemical Society. 2011;133:13810–13813. doi: 10.1021/ja203895j. [DOI] [PMC free article] [PubMed] [Google Scholar]
- 80.Pierson NA, Chen L, Russell DH, Clemmer DE. Journal Of The American Chemical Society. 2013;135:3186–3192. doi: 10.1021/ja3114505. [DOI] [PMC free article] [PubMed] [Google Scholar]
- 81.Shi L, Holliday AE, Glover MS, Ewing MA, Russell DH, Clemmer DE. J. Am. Soc. Mass Spectrom. 2016;27:22–30. doi: 10.1007/s13361-015-1255-2. [DOI] [PMC free article] [PubMed] [Google Scholar]
- 82.Badman ER, Myung S, Clemmer DE. J. Am. Soc. Mass Spectrom. 2005;16:1493–1497. doi: 10.1016/j.jasms.2005.04.013. [DOI] [PubMed] [Google Scholar]
- 83.Shi HL, Clemmer DE. Journal of Physical Chemistry B. 2014;118:3498–3506. doi: 10.1021/jp4097327. [DOI] [PMC free article] [PubMed] [Google Scholar]
- 84.Silveira JA, Fort KL, Kim D, Servage KA, Pierson NA, Clemmer DE, Russell DH. J Am Chem Soc. 2013;135:19147–19153. doi: 10.1021/ja4114193. [DOI] [PubMed] [Google Scholar]
- 85.Bornschein S-J, Hyung R, Ruotolo B. Journal of the American Society for Mass Spectrometry. 2011;22:1690–1698. doi: 10.1007/s13361-011-0204-y. [DOI] [PubMed] [Google Scholar]
- 86.Chen L, Chen SH, Russell DH. Anal Chem. 2013;85:7826–7833. doi: 10.1021/ac401370t. [DOI] [PubMed] [Google Scholar]
- 87.Shi L, Holliday AE, Bohrer BC, Kim D, Servage KA, Russell DH, Clemmer DE. Journal of The American Society for Mass Spectrometry. 2016;27:1037–1047. doi: 10.1007/s13361-016-1372-6. [DOI] [PMC free article] [PubMed] [Google Scholar]
- 88.Chen S-H, Russell DH. Journal of The American Society for Mass Spectrometry. 2015;26:1433–1443. doi: 10.1007/s13361-015-1191-1. [DOI] [PubMed] [Google Scholar]
- 89.Xiao C, Pérez LM, Russell DH. Analyst. 2015;140:6933–6944. doi: 10.1039/c5an00826c. [DOI] [PubMed] [Google Scholar]
- 90.Han L, Ruotolo BT. Analytical chemistry. 2015;87:6808–6813. doi: 10.1021/acs.analchem.5b01010. [DOI] [PMC free article] [PubMed] [Google Scholar]
- 91.Han L, Ruotolo BT. Angewandte Chemie International Edition. 2013;52:8329–8332. doi: 10.1002/anie.201301893. [DOI] [PMC free article] [PubMed] [Google Scholar]
- 92.Green-Church KB, Limbach PA. J Am Soc Mass Spectrom. 2000;11:24–32. doi: 10.1016/S1044-0305(99)00116-6. [DOI] [PubMed] [Google Scholar]
- 93.Smith RD, Loo JA, Edmonds CG, Barinaga CJ, Udseth HR. Analytical Chemistry. 1990;62:882–899. doi: 10.1021/ac00208a002. [DOI] [PubMed] [Google Scholar]
- 94.Rosu F, Pirotte S, De Pauw E, Gabelica V. International Journal of Mass Spectrometry. 2006;253:156–171. [Google Scholar]
- 95.Nordhoff E, Kirpekar F, Roepstorff P. Mass Spectrometry Reviews. 1996;15:67–138. doi: 10.1002/(SICI)1098-2787(1996)15:2<67::AID-MAS1>3.0.CO;2-8. [DOI] [PubMed] [Google Scholar]
- 96.Bonetti G, Vecli A, Viappiani C. Chemical Physics Letters. 1997;269:268–273. [Google Scholar]
- 97.Donten ML, Hamm P, VandeVondele J. The Journal of Physical Chemistry B. 2011;115:1075–1083. doi: 10.1021/jp109053r. [DOI] [PubMed] [Google Scholar]
- 98.Mairanovskii SG, Lishcheta LI. Bulletin of the Academy of Sciences of the USSR Division of Chemical Science. 1962;11:209–216. [Google Scholar]
- 99.Christensen JJ, Wrathall DP, Izatt RM, Tolman DO. The Journal of Physical Chemistry. 1967;71:3001–3006. doi: 10.1021/j100868a035. [DOI] [PubMed] [Google Scholar]
- 100.Ganguly S, Kundu KK. Canadian Journal of Chemistry. 1994;72:1120–1126. [Google Scholar]
- 101.SantaLucia J. Proceedings of the National Academy of Sciences. 1998;95:1460–1465. doi: 10.1073/pnas.95.4.1460. [DOI] [PMC free article] [PubMed] [Google Scholar]
- 102.Kaushik M, Suehl N Fau - Marky LA, Marky LA. Biophysical Chemistry. 2007;126:154–164. doi: 10.1016/j.bpc.2006.05.031. [DOI] [PubMed] [Google Scholar]
- 103.Jin KS, Shin SR, Ahn B, Rho Y, Kim SJ, Ree M. The Journal of Physical Chemistry B. 2009;113:1852–1856. doi: 10.1021/jp808186z. [DOI] [PubMed] [Google Scholar]
- 104.Leroy JL, Gueron M. Structure. 1995;3:101–120. doi: 10.1016/s0969-2126(01)00138-1. [DOI] [PubMed] [Google Scholar]
- 105.Eschweiler JD, Rabuck-Gibbons JN, Tian Y, Ruotolo BT. Analytical chemistry. 2015;87:11516–11522. doi: 10.1021/acs.analchem.5b03292. [DOI] [PubMed] [Google Scholar]
- 106.Zhong Y, Han L, Ruotolo BT. Angewandte Chemie. 2014;126:9363–9366. doi: 10.1002/anie.201403784. [DOI] [PubMed] [Google Scholar]
- 107.Rosu F, Gabelica V, Joly L, Gregoire G, De Pauw E. Physical Chemistry Chemical Physics. 2010;12:13448–13454. doi: 10.1039/c0cp00782j. [DOI] [PubMed] [Google Scholar]
- 108.Konermann L, Douglas DJ. Rapid Communications in Mass Spectrometry. 1998;12:435–442. doi: 10.1002/(SICI)1097-0231(19980430)12:8<435::AID-RCM181>3.0.CO;2-F. [DOI] [PubMed] [Google Scholar]
- 109.Douglas DJ. J. Am. Soc. Mass Spectrom. 1998;9:101–113. doi: 10.1016/S1044-0305(98)00103-2. [DOI] [PubMed] [Google Scholar]
- 110.Smiatek J, Chen C, Liu D, Heuer A. The Journal of Physical Chemistry B. 2011;115:13788–13795. doi: 10.1021/jp208640a. [DOI] [PubMed] [Google Scholar]
- 111.Ivani I, Dans PD, Noy A, Perez A, Faustino I, Hospital A, Walther J, Andrio P, Goni R, Balaceanu A, Portella G, Battistini F, Gelpi JL, Gonzalez C, Vendruscolo M, Laughton CA, Harris SA, Case DA, Orozco M. Nat Meth. 2016;13:55–58. doi: 10.1038/nmeth.3658. [DOI] [PMC free article] [PubMed] [Google Scholar]
Associated Data
This section collects any data citations, data availability statements, or supplementary materials included in this article.