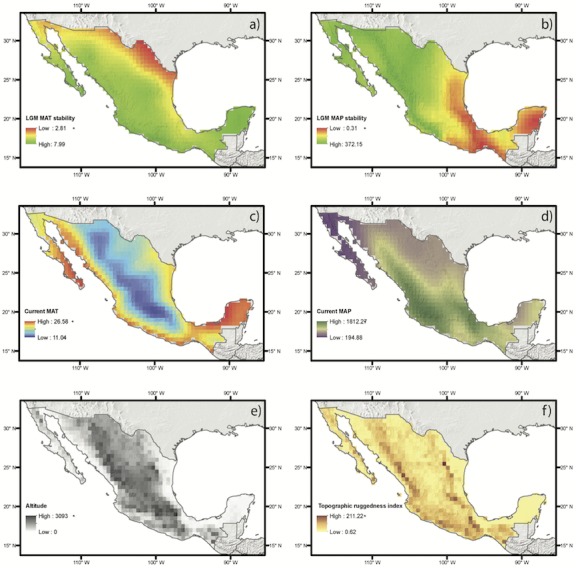
Figure 3. Abiotic drivers of variation on species richness and weighted endemism tested in this study.

Each map shows a color ramp that represents the values of each continuous variable for each group, which includes historical climate (A, B), current climate (C, D) and elevation and topography (E, F).
