

Abstract
Chronic kidney disease (CKD) has diverse phenotypic manifestations including structural (such as fibrosis) and functional (such as glomerular filtration rate and albuminuria) alterations. Gene expression profiling has recently gained popularity as an important new tool for precision medicine approaches. Here we used unbiased and directed approaches to understand how gene expression captures different CKD manifestations in patients with diabetic and hypertensive CKD.
Transcriptome data from ninety-five microdissected human kidney samples with a range of demographics, functional and structural changes were used for the primary analysis. Data obtained from 41 samples were available for validation. Using the unbiased Weighted Gene Co-Expression Network Analysis (WGCNA) we identified 16 co-expressed gene modules.
We found that modules that strongly correlated with eGFR primarily encoded genes with metabolic functions. Gene groups that mainly encoded T-cell receptor and collagen pathways, showed the strongest correlation with fibrosis level, suggesting that these two phenotypic manifestations might have different underlying mechanisms. Linear regression models were then used to identify genes whose expression showed significant correlation with either structural (fibrosis) or functional (eGFR) manifestation and mostly corroborated the WGCNA findings.
We concluded that gene expression is a very sensitive sensor of fibrosis, as the expression of 1654 genes correlated with fibrosis even after adjusting to eGFR and other clinical parameters. The association between GFR and gene expression was mostly mediated by fibrosis. In conclusion, our transcriptome-based CKD trait dissection analysis suggests that the association between gene expression and renal function is mediated by structural changes and that there may be differences in pathways that lead to decline in kidney function and the development of fibrosis, respectively.
Keywords: CKD, Fibrosis, Gene expression
Graphical Abstract

Highlights
-
•
Gene expression analysis of kidney samples shows the relationship between gene expression and eGFR is mediated by fibrosis
-
•
Immune related pathways show the strongest correlation with fibrosis development
-
•
Metabolic pathways show a strong correlation with eGFR
Chronic kidney disease is characterized by functional changes (glomerular filtration rate, eGFR) and structural changes (mainly renal fibrosis). Gene expression profiles of human kidney samples were analyzed to understand the relationship between these two manifestations. We found that the association between gene expression and eGFR is mediated by fibrosis, suggesting that fibrosis is a crucial determinant of functional kidney decline, and a potential therapeutic target. Gene expression analysis also indicates that fibrosis strongly correlates with immune pathways, and eGFR with metabolic pathways, highlighting potential mechanistic differences between structural and functional manifestations of kidney disease.
1. Introduction
Chronic kidney disease (CKD) is a world-wide health problem that affects > 10% of the US population. (Centers for Disease Control and Prevention). Chronic Kidney Disease Surveillence System-United States) Its two leading causes in the US are diabetes and hypertension. The incidence of CKD and end stage renal disease had been rising rapidly over the last several decades, (United States Renal Data System., 2015) and it is associated with increased risk of death, reaching close to 15% yearly mortality rate for patients on dialysis.
Despite the large affected population and staggering mortality rates, no new drug has been registered for CKD in > 15 years. Current therapies are mostly based on blood pressure and glucose control, and on blockade of the renin-angiotensin system. (Lewis et al., 1993; Brenner et al., 2001) These measures slow the rate of the functional decline but do not stop or reverse disease development.
The pathophysiology of CKD is complex and poorly understood. Animal models have helped to decipher the pathogenesis of many complex disease traits, (Becker and Hewitson, 2013; Brosius et al., 2009) but have been of limited utility in understanding the pathogenesis of diabetic or hypertensive nephropathy. This may partly be because no model recapitulates all features of the human disease. (Betz and Conway, 2016; Lin et al., 2016) In addition, while we can measure structural changes very effectively in animal models, functional studies (particularly GFR measurements) have been exceedingly difficult, due to muscle mass variation in small animals. (Eisner et al., 2010; Meyer et al., 1993) Conclusions drawn from animal studies to human pathophysiology, especially with regard to drug development, have often been disappointing, emphasizing the critical need for the use of human tissues.
In clinical practice, CKD is mostly diagnosed based on functional changes; these include at least 40% decline in the filtering function of the kidney (GFR) and urinary loss of plasma proteins (proteinuria, albuminuria). The serum creatinine-based estimation of GFR (eGFRcreat) is a well-established and a widely used surrogate marker for kidney function. (KDOQI 2002, KDIGO 2012) Despite its limitations (e.g. effects of muscle mass, obesity and advanced age), it is an extremely useful parameter to monitor disease progression. (Botev et al., 2011) It is easy to estimate eGFR and data is available for millions of people. Due to the ease of measurements, almost all clinical studies use eGFRcreat as an estimate of kidney function. (Levey et al., 2014).
Tubulointerstitial fibrosis and glomerular sclerosis are the structural manifestations of CKD. Glomerular changes reflect disease specificity while changes in the interstitium are mostly independent of disease etiology. Structural changes can be used to diagnose CKD, however, tissue samples are rarely obtained in the clinical practice, especially when diabetic CKD or hypertensive nephrosclerosis is the suspected diagnosis. Biopsy studies performed several decades ago indicated a strong correlation between structural and functional parameters (fibrosis and GFR) at the time of the biopsy. (Bohle et al., 1990; Fischbach et al., 1977) Fibrosis is believed to be an excellent predictor of functional decline in the kidney, (An et al., 2015; Rodriguez-Iturbe et al., 2005; Takaori et al., 2016) however this has not been formally studied.
Many previous animal model studies use structural and functional changes interchangeably which implies that these phenotypes are driven by the same underlying mechanism. (Eddy et al., 2012) There is little data to support or refute this idea due to a lack of well-characterized human tissue samples.
Genome wide transcript analysis can provide an unbiased description of gene expression changes in tissue samples and has been widely used and promoted in precision medicine studies. (Schenone et al., 2013; Gluck et al., 2017) Our dataset of 95 microdissected tubule samples is one of the largest datasets in the field of transcriptome- based kidney research. Of the published datasets, Ju et al. used microarray based gene expression profiles of CKD samples (107 microdissected tubule samples, representing mixed renal pathology and hybridization methods) to identify cell type specific transcripts or predictive pathways. (Ju et al., 2013) O'Connell et al. used 159 non-microdissected samples from renal allograft biopsies to determine correlation of gene expression to structural changes such as chronic allograft damage index (CADI) and identify a predictor gene set for fibrosis.(O'Connell et al., 2016) All published transcriptomic studies have used binary outcome categorization for CKD based on GFR estimation. As GFR is a continuous variable using a binary outcome limits the power of these studies.
Recently, outcome independent machine learning methods have been developed to analyze gene expression datasets. These methods can identify gene expression patterns independent of clinical and demographic information.
The goal of this study was to perform a phenotype-independent analysis of gene expression data, identify key driver modules in kidney expression data and correlate this with phenotypic outcomes. Results of these unbiased analyses were complemented with phenotype-driven analysis and validated in an additional dataset.
2. Materials and Methods
2.1. Human Kidney Samples
Kidney samples were obtained from surgical nephrectomies performed for renal cancer. Only the normal, non-neoplastic part of the tissue (taken at least 2 cm away from the cancer) was used for further investigation. Samples were deidentified and corresponding clinical information was collected by an individual who was not involved in the research protocol. We had collected extensive clinical information including age, race, gender, diabetes and hypertension status, medication use and urine parameters, as well as creatinine and BUN values. Histological examination of all samples was performed by a nephropathologist who was blinded to other clinical information using periodic acid-Schiff-stained kidney sections. The purpose of the histological examination was fourfold: to ensure that there was no cancerous tissue in the specimens, to determine the scores of 19 predetermined histopathological parameters including glomerular, vascular, tubule and interstitial descriptors, to confirm the diagnosis of diabetic or hypertensive nephropathy when applicable, and finally to exclude samples of non-diabetic or hypertensive kidney disease from the analysis.
Diabetic and hypertensive nephropathy were defined as follows: The diagnosis of diabetic nephropathy was based on the consensus Renal Pathology Society criteria (Tervaert et al., 2010), which include basement membrane thickening, mesangial expansion, and nodular mesangial sclerosis. Because early basement membrane thickening alone cannot be accurately assessed on light microscopy, our diagnostic threshold for diabetic nephropathy begins at class II with mesangial expansion. The diagnosis of arterionephrosclerosis was based on clinicopathologic criteria which include clinical hypertension associated with the histopathologic findings of vascular wall medial thickening, intimal fibrosis, arteriolar hyalinosis, and glomerular ischemic changes of capillary wall wrinkling. (Marcantoni and Fogo, 2007).
The study was approved by the institutional review board (IRBs) of the Albert Einstein College of Medicine and Montefiore Medical Center (IRB 2002–202) and the University of Pennsylvania (IRB 815796).
2.2. Tissue Handling and Microdissection
The kidney tissue was immediately placed and stored in RNAlater (Ambion) according to the manufacturer's instruction. The tissue was manually microdissected under a microscope in RNAlater for glomerular and tubular compartments. Dissected tubular tissue was homogenized, and RNA was prepared using RNAeasy mini columns (Qiagen, Valencia, CA) according to manufacturer's instructions. RNA quality and quantity were determined using the Laboratory-on-Chip Total RNA PicoKit Agilent BioAnalyzer. Only samples without evidence of degradation were studied (RNA integrity number > 6).
2.3. Microarray Procedure
Purified total RNAs from 95 tubule samples were amplified using the Ovation Pico WTA System V2 (NuGEN) and labeled with the Encore Biotin Module (NuGEN) according to the manufacturer's protocol. The purified total RNA from 41 tubule samples used for validation were amplified using the Two-Cycle Target Labeling Kit (Affymetrix) as per the manufacturer's protocol. Transcript levels were analyzed using Affymetrix U133A arrays.
2.4. Microarray Data Processing
After hybridization and scanning, outliers were detected using the ArrayQualityMetrics R package. (Kauffmann et al., 2009) Outliers were identified using several detection methods including: PCA (presented in FigS3), MA-plot, the boxplot of the log-ratios, distance between arrays, relative log expression (RLE), normalized unscaled standard error (NUSE) and spatial distribution of M (feature intensity). Raw data files that passed the detection were imported into GeneSpring GX software, version 12.6 (Agilent Technologies). Raw expression levels were summarized using RMA16 algorithm by just RMA() function of Affy package. (Gautier et al., 2004).
We implemented a linear regression model to examine the correlation between gene expression and CKD traits (eGFR, fibrosis) using age, gender, race and diabetes and hypertension status as co-variables. When needed, adjustment was made for CKD traits as well. The analysis had a power of 80% to detect a statistically significant Pearson correlation R of at least 0.284 with a significance threshold of 0.05.
2.5. Weighted Gene Co-Expression Network Analysis (WGCNA)
An unsigned co-expression network was built using the WGCNA package in R. Based on an adjacency matrix, genes with highly similar co-expression relationships were grouped together by performing average linkage hierarchical clustering on the topological overlap. The Dynamic Hybrid Tree Cut algorithm was used to cut the hierarchal clustering tree, and modules were defined as branches from the tree cutting. To obtain moderately large and distinct modules, we set the minimum module size to 30 genes and the minimum height for merging modules at 0.25. The modules were randomly color-labeled. Each module was summarized by the first principal component of the scaled (standardized) module expression profiles (referred to as module eigengene). The module eigengenes were then analyzed for correlations with clinical phenotypes such as eGFR and interstitial fibrosis.
2.6. Pathway Analysis
Transcripts with expression levels showing significant linear correlation with eGFR or interstitial fibrosis were separately exported to DAVID bioinformatics resource software, where it was analyzed using Gene Ontology (GO).
2.7. Microarray Data Set
The data has been deposited to a public repository and can be accessed through: ArrayExpress: E-MTAB-5929, E-MTAB-2502.
3. Results
3.1. Clinical and Histological Description of the Cohort
Our primary dataset contained 95 human microdissected tubule samples from subjects with a range of eGFR, from normal values to advanced CKD, some with underlying hypertension and/or diabetes (Table 1). (Ledo et al., 2015) All samples were collected from non-tumorous regions of renal cancer nephrectomies; therefore they represent an unbiased collection. We had collected extensive clinical information including age, race, gender, diabetes and hypertension status, medication use and urine parameters, as well as creatinine and BUN values. Comprehensive histopathological analysis included a disease state-blinded description of 19 parameters, including glomerular, vascular, tubule and interstitial descriptors. The diagnosis of diabetic and hypertensive nephropathy was based on well-established clinicopathologic criteria. We did not have samples with glomerulonephritis, given that it is a rare condition in the general population. Since tubulointerstitial fibrosis in diabetic and hypertensive CKD is histologically indistinguishable and prior gene expression analysis has not been able to identify molecular differences based on disease etiology, we used samples from both etiologies in our analysis. In our dataset the mean eGFR, calculated by CKD-Epi formula, was 60.07 ± 29.78 ml/min/1.73m2, ranged from 3.8 to 134 ml/min/1.73m2. The full clinical information and pathological characterization can be found under Table 1.
Table 1.
Clinical and pathological characteristics of primary and validation databases.
| Primary database | |
|---|---|
| n | 95 |
| Age years (SD) | 63.57 (13.46) |
| Gender -female: male | 40:55 |
| Ethnicity | |
| Asian (n) | 3 |
| Non Hispanic white | 19 |
| Non Hispanic black | 35 |
| Hispanic | 6 |
| Other and unknown | 32 |
| BMI kg/m2 (SD) | 29.77 (9.25) |
| Hypertension (n) | 39 |
| Diabetes (n) | 37 |
| Serum creatinine mg/dl (SD) | 2.05 (2.52) |
| Serum BUN mg/dl (SD) | 23.2 (13.7) |
| Serum glucose mg/dl (SD) | 135.4 (65.3) |
| Systolic blood pressure mmHg (SD) | 138.6 (24.7) |
| Diastolic blood pressure mmHg (SD) | 78 (13.6) |
| Serum albumin g/dl (SD) | 3.96 (0.66) |
| Urinary protein mg/dl (SD) | 441 (773) |
| eGFR ml/min (SD) | 60.076 (29.79) |
| Histology | |
| Glomerulosclerosis % (SD) | 17.65 (26.88) |
| Interstitial Fibrosis % (SD) | 20.52 (27.42) |
| Validation database | |
| n | 41 |
| Age years (SD) | 60.19 (13.30) |
| Gender -female: male | 24:17 |
| Ethnicity | |
| Asian (n) | 1 |
| Non Hispanic white | 8 |
| Non Hispanic black | 17 |
| Hispanic | 6 |
| Other and unknown | 9 |
| BMI kg/m2 (SD) | 29.35 (5.94) |
| Hypertension (n) | 32 |
| Diabetes (n) | 21 |
| Serum creatinine mg/dl (SD) | 1.7 (1.03) |
| Serum BUN mg/dl (SD) | 24.5 (14.11) |
| eGFR ml/min (SD) | 52.69 (28.24) |
| Histology | |
| Glomerulosclerosis % (SD) | 18.47 (25.64) |
| Interstitial Fibrosis % (SD) | 15.21 (18.65) |
Data are presented as mean and standard deviation with the median values or percentage (%).
We then compared clinical and pathological parameters of the samples. As previously described, interstitial fibrosis showed a strong statistically significant negative correlation with eGFR (Pearson r = − 0.656 p = 4.4E-13). Similarly, glomerulosclerosis also correlated negatively with kidney function (Pearson r = − 0.579 p = 5.6E-10). Because of their relatedness, interstitial fibrosis correlated positively with glomerular sclerosis (Pearson r = 0.883, p = 2.8E-11) (Fig. 1).
Fig. 1.

Correlation between functional and structural changes of CKD.
Correlation graphs of eGFR (x-axis, ml/min/1.73m2) with interstitial fibrosis (y-axis; %) (A) and glomerular sclerosis (y-axis; %) (B). Both parameters have a statistically significant negative correlation with eGFR, with Pearson r of − 0.656 and − 0.579 respectively, p < 0.01. (C) Positive correlation between interstitial fibrosis (x-axis %) and glomerular sclerosis (y-axis %), Pearson r = 0.883, p < 0.01.
3.2. Weighted Gene Co-Expression Network Analysis (WGCNA) Identifies Critical Modules Correlating with Renal Phenotypes
Transcript analysis was performed on each microdissected tubule sample. Most prior genome wide expression profiling examined the association between CKD status (based on GFR) and expression changes. We performed an unbiased gene expression analysis to identify co-expressed genes and modules in our dataset. Weighted gene co-expression network analysis is a systems biology method to understand correlation patterns among genes across different samples. WGCNA can be used to find clusters or modules. The eigengene is then used to summarize modules, and the association between these vectors and sample traits such as clinical parameters can be studied. (Langfelder and Horvath, 2008).
Using the WGCNA analysis (Fig. 2A–C) we identified 16 co-expressed modules in our dataset (Fig. 2C). The dataset had two very large modules (turquoise and blue) and several smaller modules, indicating that the expression levels of a large number of genes strongly correlate. We examined the association between modules and included GFR and fibrosis as important clinical measurements. Surprisingly, GFR and fibrosis did not cluster together, but rather each CKD trait clustered with a different set of gene expression modules, indicating differences between fibrosis and eGFR (Fig. 2D, E). Next we examined the association between each of the modules and clinical and histological traits, including eGFR, fibrosis, age, race and diabetes or hypertension status (Fig. 2F). One of the largest gene modules (blue) strongly correlated with hypertension (HTN) and diabetes status (DM) but not with eGFR or fibrosis, indicating that HTN and DM significantly impact gene expression changes independent of kidney function. Focusing on eGFR and fibrosis, we found that while several modules correlated both with fibrosis and eGFR, some modules correlated with one phenotype but not the other, further suggesting these are not similar processes.
Fig. 2.

Weighted Gene Co-expression Network Analysis (WGCNA).
(A) Hierarchical clustering dendogram of the samples. The clinical traits; fibrosis, glomerulosclerosis, GFR, age, gender, race, DM and HTN are shown at the bottom. (B) Heatmap representing the Topological Overlap Matrix (TOM) among all genes in the analysis. Degree of overlap is represented by the color shade; darker color represents higher overlap and lighter color represents lower overlap. The gene dendrogram is shown on the left, module assignment is shown at the top. (C) Average linkage hierarchical clustering dendogram of the genes. Input was the topological overlap based dissimilarity. Modules, designated by color code, are the branches of the clustering tree. Unsupervised hierarchical clustering heatmap (D) and dendogram (E) of 16 module eigengenes and two clinical traits; eGFR and fibrosis. Red box indicates modules that strongly cluster with eGFR; Black box indicates modules that strongly cluster with fibrosis. (F) Correlation of module eigengenes to clinical and pathological traits. Each row corresponds to a module eigengene and the columns are clinical traits. The values in the cells are presented as “Pearson r (p value)”, and color-coded by direction and degree of the correlation (red = positive correlation; blue = negative correlation). 16 modules of co-expressed transcripts are presented with their respective correlation parameters to clinical and pathological traits. (G-I) Pathway analysis using gene ontology (GO) showing the top pathways enriched in the gene-sets of the black (G), yellow (H) and brown (I) modules. (J) Network of genes in black, yellow and brown modules; distance between nodes is determined by strength of the correlation.
We further examined the specific modules (brown, yellow and black) that showed the strongest correlation with CKD traits (Fig. 2). To understand these modules we performed pathway analysis of the genes in each module. The black module strongly clustered with fibrosis (p = 10− 12) and only modestly with GFR (p = 0.003). This module was enriched for genes encoding for T-cell and collagen associated pathways (Fig. 2G). It is worth noting that there was a positive correlation between this module and fibrosis, i.e. T cell and collagen related pathways were up regulated with fibrosis advancement. On the other hand, genes in the brown and yellow modules, which clustered with the GFR trait (p = 10− 12 with GFR), mostly encompassed genes with metabolic functions, including fatty acid metabolism (Fig. 2H, I). These modules showed positive correlation with GFR, indicating that their levels are lower as CKD advances. The genes in these modules formed a tight network (Fig. 2J). In summary, the WGCNA method has identified 16 coregulated modules in human kidney samples. T-cell biology and collagen associated genes correlated strongly with fibrosis while mitochondrial and metabolic genes showed strong correlation with eGFR.
3.3. Gene Expression Changes Correlating With eGFR are Mainly Mediated by Fibrosis
Our next step was to define gene expression profiles that correlate with specific phenotypic changes by identifying a comprehensive list of transcripts whose levels show linear correlation with kidney function in our cohort. Our current sample size of 95 samples provided an 80% power to detect a correlation coefficient of at least 0.28 with a significance threshold of 0.05. Using a linear regression model and eGFR as the outcome, our analysis identified 3156 genes whose expression showed significant linear correlation with eGFR (FDR < 0.05) (Table S1). Expression levels of these eGFR-correlated transcripts were able to cluster samples based on their eGFR levels better than other clinical parameters (Fig. 3A). Even though eGFR already includes adjustment for age, race and gender, we performed additional analysis in which we adjusted for these variables. After adjusting for these covariates plus HTN and DM, the number of genes significantly correlated with eGFR has decreased (3156 vs. 647) (Fig. 3B, Supplementary Table S2), indicating that these variables play an important role in gene expression association.. Genes whose expression significantly correlated with eGFR had diverse functions, including immune system, metabolism, developmental pathways and cell adhesion (Fig. 3C). Interestingly, no genes showed independent association with eGFR once we adjusted the model for the degree of fibrosis in the biopsy sample, indicating that the association between gene expression and kidney function is mediated by the degree of structural damage.
Fig. 3.

Gene expression levels linearly correlating with eGFR.
(A) Heatmap depicting hierarchical clustering of the eGFR-correlated genes, ordered by eGFR. Clinical parameters are marked below. DM = diabetes mellitus, HTN = hypertension, BMI = body mass index. (B) Identification of genes whose expression show linear correlation with eGFR with and without adjustment to 5 variables (age, race, gender, DM and HTN status). (C) Pathways analysis using Gene Ontology of non-adjusted (top panel) and adjusted (bottom panel) eGFR-correlated genes.
Next, we set to identify genes whose expression correlates with tubulointerstitial fibrosis. Using an unadjusted linear regression model we found that the level of > 5000 genes correlated with fibrosis (Table S3). Even after adjusting for age, race, gender, diabetes and hypertension status we found > 3000 correlating genes (Table S4), indicating a strong correlation between fibrosis and gene expression.
To understand whether the gene expression and fibrosis correlation is mediated by eGFR, we adjusted the model for eGFR. The expression of 1654 probes showed significant association with fibrosis even after adjusting for eGFR at the time of the tissue collection (Fig. 4A, Table S5). Taken together with the previous results, these data indicate that structural changes are key intermediates of gene expression changes in CKD. Genes that correlated with fibrosis were able to cluster genes based on the degree of fibrosis (Fig. 4B, C). Fig. 4D shows examples of genes whose levels correlate with fibrosis but not with eGFR. Further dissection of these genes and pathways indicated enrichment for metabolism: fatty acid metabolism (e.g. Acetyl-CoA Acetyltransferase 1, Carnitine Palmitoyltransferase 2), amino acid metabolism (e.g. citrate synthase, malate dehydrogenase) and oxidation-reduction processes (e.g. carbonyl reductase 4, aldehyde dehydrogenase 1). There was also a significant enrichment of immune system related pathways including T-cell activation and leukocyte migration (e.g. T cell receptor proteins, CD molecules and chemokine ligands and receptors). We examined whether we can detect differences based on the directionality of the pathways correlation. We found that genes whose expression levels are positively correlated with fibrosis (i.e. increased in fibrosis) were mostly enriched for immune related pathways, while genes whose expression decreased were mostly enriched for metabolic processes.
Fig. 4.

Gene expression changes strongly correlate with structural damage.
(A) Identification of genes whose expression show linear correlation with fibrosis with and without adjustment to 5 variables (age, race, gender, DM and HTN status) and to eGFR. (B) Heatmap depicting hierarchical clustering of the genes correlated with fibrosis, ordered by fibrosis. eGFR of the corresponding samples is indicated below. (C) Pathways analysis using Gene Ontology of non-adjusted (top panel), adjusted to 5 variables (middle panel) and adjusted to 5 variables + eGFR (bottom panel) fibrosis-correlated genes. (D) Graphs of 6 genes that significantly correlate with fibrosis and not with eGFR. Gene expression levels are plotted against fibrosis and eGFR; the bottom panel shows positive tubular staining of the indicated genes (Human Protein Atlas; www.proteinatlas.org). (E) Venn diagram depicting genes correlating with fibrosis (3189 genes) and with eGFR (647 genes) and their overlap.
In summary our phenotype driven gene expression analysis identified a large number of genes correlating with these phenotypes. We found that the association between gene expression and kidney function (eGFR) is mediated by the degree of the structural damage (fibrosis). Immune, T-cell and collagen pathways showed the strongest enrichment in fibrosis, while eGFR correlating genes were enriched for metabolism.
3.4. Correlation between Phenotype and Gene Expression
As we determined that structural changes such as fibrosis are key drivers of gene expression changes, we analyzed the strength of the association between fibrosis and clinical parameters and gene expression (Fig. 5). As expected, based on the overlapping phenotype between fibrosis and eGFR, a large number of eGFR-correlated transcripts significantly associated with fibrosis as well, indicating that function and structure are indeed two complementary manifestations of CKD. However, as shown on the plot, the association between the clinical phenotype of fibrosis and GFR was stronger than the association between GFR and fibrosis overlapping gene expression profiles, thus further supporting that kidney gene expression reflects fibrosis better than it does eGFR. Overall the clinical correlation between fibrosis and clinical parameters such as blood pressure, as well as histological changes, were also stronger than its association with gene expression changes. In summary, gene expression levels are strong read-outs for structural changes and less for functional changes (eGFR), suggesting that these are not fully synonymous processes.
Fig. 5.
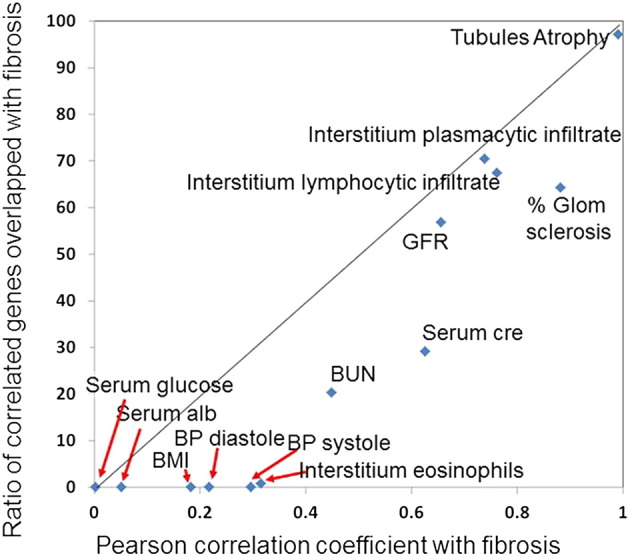
Association between fibrosis and clinical parameters and gene expression changes.
The x-axis shows the Pearson correlation between clinical and pathological parameters and fibrosis, the y-axis shows the correlation between ratio of genes correlated with fibrosis and the depicted parameters. Note that the correlation between fibrosis and GFR is stronger then the gene expression overlap.
3.5. Validation of Gene-Sets Correlating with CKD Traits
To validate our findings, we used genome-wide transcript profiling that included 41 microdissected tubule samples (Table 1). These samples were distinct from the primary set, and were collected from subjects with a range of GFR and with the presence or absence of DM, HTN and diabetic and hypertensive CKD. Also, probe labeling was performed using a different method. First, using this independent cohort we validated the correlation of a subset of the top highly eGFR- or fibrosis- correlated genes identified through the primary dataset analysis; the top 5 genes of each group are presented in Fig. S1A. A linear regression analysis was then performed using GFR and fibrosis as outcomes. In the unadjusted model, we were able to validate the association for about 40%–60% of the genes, which was expected given that this is a much smaller dataset. (Fig. S1B). The strength of the correlation was also reproducible in the two databases. In addition to individual gene expression we have also analyzed the differential regulation of specific pathways. Similar to the primary dataset, CKD was associated with differential expression of immune and metabolic genes in the replication dataset as well. The direction of association in the replication dataset was the same as in the primary dataset (Fig. S1C).
3.6. Characterization of Previously Published Biomarker Data
Next we interrogated the renal expression of several published and validated biomarkers (Fig. 6).(Fassett et al., 2011) The level of epidermal growth factor (EGF) in renal tubule cells strongly correlated with kidney function and kidney fibrosis (Ju et al., 2015) (Fig. 6). Indeed, of the published biomarkers, EGF showed the strongest correlation both with eGFR and fibrosis. We found that renal expression levels of fatty acid binding protein 1 (FABP1) significant correlated both with eGFR and with fibrosis. This is consistent with the fact that urinary FABP1 levels predict CKD progression (Matsui et al., 2016) and reflect the severity of tubulointerstitial damage in CKD kidney biopsies. (Kamijo et al., 2004) Expression levels of neutrophil gelatinase-associated lipocalin (NGAL), which is a known marker of CKD progression (Bolignano et al., 2009) that predicts renal function decline (Wu et al., 2010), showed a better correlation with renal fibrosis than with eGFR, but had a statistically significant association with eGFR as well (Fig. 6). There was no identified statistically significant correlation between renal tubule expression of KIM1, IGFBP1 and IL18 and kidney function or kidney fibrosis (Fig. 6). We validated the correlations of these biomarkers using the independent validation dataset (FigS2).
Fig. 6.

The relationship between the expression of previously published CKD biomarkers and kidney function and structure changes.
Expression levels of the following biomarkers (y-axis): FABP1, NGAL, KIM1, IGFPB1, IL18 and EGF and eGFR (x-axis) and interstitial fibrosis (x-axis). The R2 value was examined for linear correlation. *p value < 0.05.
Interestingly while increased urinary levels of FABP1 are associated with decreased GFR and poor prognosis, the expression of this gene showed inverse relationship with decreased FABP1 expression levels in low eGFR samples (Fig. 6). On the other hand, NGAL and EGF renal tubule expression correlated with their reported urinary levels in CKD, as NGAL urinary levels are increased and EGF urinary levels are decreased in CKD patients. (Bolignano et al., 2009; Ju et al., 2015) In summary, we found that renal expression of only FABP1, NGAL and EGF correlates with kidney function and fibrosis, indicating that these are critically important biomarkers.
4. Discussion
eGFRcreat is the most widely used surrogate marker for kidney disease stage and progression in clinical practice, in observational and interventional clinical trials. (Lambers Heerspink et al., 2014; Stevens et al., 2006) Most studies use eGFR as the primary outcome measure, as it is considered to reflect the pathological process in the kidney. Doubling of serum creatinine is the most commonly used outcome to obtain registration for a new drug. (Weldegiorgis et al., 2015) On the other hand eGFR is a dynamic parameter that is highly sensitive to hemodynamic changes including blood pressure alterations; therefore structural changes, such as fibrosis, might better represent CKD state and the future functional decline. Our aim was to better understand the relatedness of these phenotypes by using gene expression profiling. Using unbiased (WGCNA) and directed approaches we found significant differences in genes correlating with fibrosis and eGFR, indicating key differences between structural and functional manifestations of CKD.
The key finding of our study is that gene expression levels show a stronger correlation with fibrosis than with eGFR and indeed the relationship between gene expression and eGFR is actually mediated by the degree of structural damage. Fibrosis is an excellent predictor of CKD progression. (An et al., 2015; Rodriguez-Iturbe et al., 2005; Takaori et al., 2016; Mariani et al., 2017) In the transplant literature, the association between interstitial fibrosis and graft survival or eGFR change is well established (reported correlation coefficient around − 0.48).(Gonzales et al., 2016; Diaz Encarnacion et al., 2004) It has also been suggested that in diabetic nephropathy, interstitial fibrosis predicts eGFR decline better than proteinuria alone or baseline eGFR. (Mise et al., 2015) In recent years the appreciation for fibrosis has increased and several large companies have developed programs aiming to selectively target fibrosis (Mathew et al., 2011), therefore understanding genes and pathways that drive fibrosis is critically important. Recent animal model studies indicate that reversing fibrosis can potentially improve kidney function. (RamachandraRao et al., 2009; Lin et al., 2002).
Unbiased and directed analysis indicated that immune related pathways show the strongest correlation with fibrosis development. Immune system activation has also been consistently observed in diseases traditionally referred to as “non-immune mediated” kidney diseases such as hypertension and diabetic CKD.(Navarro-Gonzalez et al., 2011) Indeed, many current clinical studies targeting cytokines (such as MCP1)(Menne et al., 2016) (ClinicalTrials.gov Identifier: NCT01547897) and proinflammatory mediators (such as JAK) (ClinicalTrials.gov Identifier NCT01683409) have shown promise in reducing proteinuria in early clinical studies. The enrichment for immune system genes in fibrosis likely represents the influx of inflammatory cells rather than increased expression of inflammatory genes by resident cells. (Meng et al., 2014) This inflammatory cell influx is synonymous with the fibrotic stroma. Our unbiased analysis was highly sensitive in identifying inflammatory changes in fibrosis.
Our studies indicate a strong correlation between metabolic gene expression and kidney functional changes such as GFR. These results are very much in line with multiple recent publications indicating the importance of energy supply, including the role of fatty acid metabolism and mitochondrial function in acute and chronic kidney disease. (Mount and Power, 2015; Kang et al., 2015) These are more in line with the hypothesis that some of the functional changes could be acute and may correlate closer with acute functional-metabolic changes without associating with structural damage. Animal model studies show a strong role of metabolic genes both in acute and chronic injury. (Han et al., 2016; Woroniecka et al., 2011).
For the first time, we have performed a systemic analysis of kidney-specific gene expression changes of previously proposed urinary biomarkers. Easily accessible surrogate tissue samples such as blood or urine might be well suited to identify disease biomarkers, but do not always reflect renal pathology. (Ledo et al., 2015; Ju et al., 2015; Martini et al., 2014) For example, while biomarkers whose urinary levels were shown to be increased in patients with lower GFR were mostly associated with elevated kidney expression in samples with lower eGFR in our database, sometimes their gene expression level in such samples was decreased. Furthermore some of the urinary biomarkers did not show an association of kidney gene expression levels with eGFR. A possible explanation is that some of these markers could be filtered, therefore their expression level may not change in the kidney. Also, the predictive value of these markers has been examined using an unadjusted model and they may not replicate in the adjusted model.
Limitations of the work include the use of nephrectomies, instead of kidney biopsies. However, as all samples were obtained from nephrectomies this would represent a systemic bias and not a disease state-specific bias, and therefore would not change the differential expression analysis between the different groups. Unfortunately, comparable size expression data obtained from kidney biopsies are not available for diabetic and hypertensive CKD subjects. Moreover, as kidney biopsies are not routinely performed when diabetic or hypertensive nephropathy is the suspected diagnosis, when such biopsies are done, it is often for unusual clinical characteristics (e.g. rapid deterioration of kidney function) that may introduce a bias limiting the generalizability of the results. The use of nephrectomies allowed for certain advantages which would not be possible if biopsies were used, such as the ability to analyze samples with and without DM or HTN in the absence of kidney disease. The WGCNA analysis indicates that a large number of genes correlate with DM and HTN, but not with kidney function; thus highlighting that collecting and analyzing such samples is essential to understand CKD that occurs in the presence of DM and HTN.
In summary, genome-wide transcriptome analysis of microdissected human kidney samples and computational analyses indicates strong correlation between gene expression levels and structural changes, which mediate the relation of gene expression levels and kidney function levels; and highlights key differences between structural and functional manifestations of kidney disease.
The following are the supplementary data related to this article.
Genes whose expression levels correlate significantly with eGFR (FDR < 0.05). Presented are probe i.d., gene symbol, regression effect, p value and FDR adjusted p value.
Genes whose expression levels correlate significantly with eGFR after adjustment to 5 co-variables (age, race, gender, hypertension status and diabetes status) (FDR < 0.05). Presented are probe i.d., gene symbol, regression effect, p value and FDR adjusted p value.
Genes whose expression levels correlate significantly with interstitial fibrosis (FDR < 0.05). Presented are probe i.d., gene symbol, regression effect, p value and FDR adjusted p value.
Genes whose expression levels correlate significantly with interstitial fibrosis after adjustment to 5 co-variables (age, race, gender, hypertension status and diabetes status) (FDR < 0.05). Presented are probe i.d., gene symbol, regression effect, p value and FDR adjusted p value.
Genes whose expression levels correlate significantly with interstitial fibrosis after adjustment to 5 co-variables (age, race, gender, hypertension status and diabetes status) and to eGFR (FDR < 0.05). Presented are probe i.d., gene symbol, regression effect, p value and FDR adjusted p value.
Supplementary figures
Funding Resources
Work in the Susztak lab is supported by the National Institute of Health DK076077, DK105821, DK108220 and DP3087635.
Conflict of Interest
None.
Author Contribution
P.B.- data analysis and interpretation, figure design and manuscript writing. C.Q. and J.P.- data analysis and figure design. N.L., Y.K., A.D.P., S·YH. and P.C.- data collection M.BP.- pathological analysis and scoring K.S.- study design, data analysis, interpretation and supervision, manuscript writing.
References
- An Y., Xu F., Le W., Ge Y., Zhou M., Chen H., Zeng C., Zhang H., Liu Z. Renal histologic changes and the outcome in patients with diabetic nephropathy. Nephrol. Dial. Transplant. 2015;30:257–266. doi: 10.1093/ndt/gfu250. [DOI] [PubMed] [Google Scholar]
- Becker G.J., Hewitson T.D. Animal models of chronic kidney disease: useful but not perfect. Nephrol. Dial. Transplant. 2013;28:2432–2438. doi: 10.1093/ndt/gft071. [DOI] [PubMed] [Google Scholar]
- Betz B., Conway B.R. An update on the use of animal models in diabetic nephropathy research. Curr. Diab. Rep. 2016;16:18. doi: 10.1007/s11892-015-0706-2. [DOI] [PMC free article] [PubMed] [Google Scholar]
- Bohle A., Mackensen-Haen S., Von Gise H., Grund K.E., Wehrmann M., Batz C., Bogenschutz O., Schmitt H., Nagy J., Muller C. The consequences of tubulo-interstitial changes for renal function in glomerulopathies. A morphometric and cytological analysis. Pathol. Res. Pract. 1990;186:135–144. doi: 10.1016/S0344-0338(11)81021-6. [DOI] [PubMed] [Google Scholar]
- Bolignano D., Lacquaniti A., Coppolino G., Donato V., Campo S., Fazio M.R., Nicocia G., Buemi M. Neutrophil gelatinase-associated lipocalin (NGAL) and progression of chronic kidney disease. Clin. J. Am. Soc. Nephrol. 2009;4:337–344. doi: 10.2215/CJN.03530708. [DOI] [PMC free article] [PubMed] [Google Scholar]
- Botev R., Mallie J.P., Wetzels J.F., Couchoud C., Schuck O. The clinician and estimation of glomerular filtration rate by creatinine-based formulas: current limitations and quo vadis. Clin. J. Am. Soc. Nephrol. 2011;6:937–950. doi: 10.2215/CJN.09241010. [DOI] [PubMed] [Google Scholar]
- Brenner B.M., Cooper M.E., De Zeeuw D., Keane W.F., Mitch W.E., Parving H.H., Remuzzi G., Snapinn S.M., Zhang Z., Shahinfar S. Effects of losartan on renal and cardiovascular outcomes in patients with type 2 diabetes and nephropathy. N. Engl. J. Med. 2001;345:861–869. doi: 10.1056/NEJMoa011161. [DOI] [PubMed] [Google Scholar]
- Brosius F.C., III, Alpers C.E., Bottinger E.P., Breyer M.D., Coffman T.M., Gurley S.B., Harris R.C., Kakoki M., Kretzler M., Leiter E.H., Levi M., Mcindoe R.A., Sharma K., Smithies O., Susztak K., Takahashi N., Takahashi T. Mouse models of diabetic nephropathy. J. Am. Soc. Nephrol. 2009;20:2503–2512. doi: 10.1681/ASN.2009070721. [DOI] [PMC free article] [PubMed] [Google Scholar]
- Centers for Disease Control and Prevention. Chronic Kidney Disease Surveillence System-United States, (n.d.).
- Diaz Encarnacion M.M., Griffin M.D., Slezak J.M., Bergstralh E.J., Stegall M.D., Velosa J.A., Grande J.P. Correlation of quantitative digital image analysis with the glomerular filtration rate in chronic allograft nephropathy. Am. J. Transplant. 2004;4:248–256. doi: 10.1046/j.1600-6143.2003.00311.x. [DOI] [PubMed] [Google Scholar]
- Eddy A.A., Lopez-Guisa J.M., Okamura D.M., Yamaguchi I. Investigating mechanisms of chronic kidney disease in mouse models. Pediatr. Nephrol. 2012;27:1233–1247. doi: 10.1007/s00467-011-1938-2. [DOI] [PMC free article] [PubMed] [Google Scholar]
- Eisner C., Faulhaber-Walter R., Wang Y., Leelahavanichkul A., Yuen P.S., Mizel D., Star R.A., Briggs J.P., Levine M., Schnermann J. Major contribution of tubular secretion to creatinine clearance in mice. Kidney Int. 2010;77:519–526. doi: 10.1038/ki.2009.501. [DOI] [PMC free article] [PubMed] [Google Scholar]
- Fassett R.G., Venuthurupalli S.K., Gobe G.C., Coombes J.S., Cooper M.A., Hoy W.E. Biomarkers in chronic kidney disease: a review. Kidney Int. 2011;80:806–821. doi: 10.1038/ki.2011.198. [DOI] [PubMed] [Google Scholar]
- Fischbach H., Mackensen S., Grund K.E., Kellner A., Bohle A. Relationship between glomerular lesions, serum creatinine and interstitial volume in membrano-proliferative glomerulonephritis. Klin. Wochenschr. 1977;55:603–608. doi: 10.1007/BF01490515. [DOI] [PubMed] [Google Scholar]
- Gautier L., Cope L., Bolstad B.M., Irizarry R.A. Affy--analysis of Affymetrix GeneChip data at the probe level. Bioinformatics. 2004;20:307–315. doi: 10.1093/bioinformatics/btg405. [DOI] [PubMed] [Google Scholar]
- Gluck C., Ko Y.A., Susztak K. Precision medicine approaches to diabetic kidney disease: tissue as an issue. Curr. Diab. Rep. 2017;17:30. doi: 10.1007/s11892-017-0854-7. [DOI] [PMC free article] [PubMed] [Google Scholar]
- Gonzales M.M., Bentall A., Kremers W.K., Stegall M.D., Borrows R. Predicting individual renal allograft outcomes using risk models with 1-year surveillance biopsy and alloantibody data. J. Am. Soc. Nephrol. 2016 doi: 10.1681/ASN.2015070811. [DOI] [PMC free article] [PubMed] [Google Scholar]
- Han S.H., Malaga-Dieguez L., Chinga F., Kang H.M., Tao J., Reidy K., Susztak K. Deletion of Lkb1 in renal tubular epithelial cells leads to CKD by altering metabolism. J. Am. Soc. Nephrol. 2016;27:439–453. doi: 10.1681/ASN.2014121181. [DOI] [PMC free article] [PubMed] [Google Scholar]
- Ju W., Greene C.S., Eichinger F., Nair V., Hodgin J.B., Bitzer M., Lee Y.S., Zhu Q., Kehata M., Li M., Jiang S., Rastaldi M.P., Cohen C.D., Troyanskaya O.G., Kretzler M. Defining cell-type specificity at the transcriptional level in human disease. Genome Res. 2013;23:1862–1873. doi: 10.1101/gr.155697.113. [DOI] [PMC free article] [PubMed] [Google Scholar]
- Ju W., Nair V., Smith S., Zhu L., Shedden K., Song P.X., Mariani L.H., Eichinger F.H., Berthier C.C., Randolph A., Lai J.Y., Zhou Y., Hawkins J.J., Bitzer M., Sampson M.G., Thier M., Solier C., Duran-Pacheco G.C., Duchateau-Nguyen G., Essioux L., Schott B., Formentini I., Magnone M.C., Bobadilla M., Cohen C.D., Bagnasco S.M., Barisoni L., LV J., Zhang H., Wang H.Y., Brosius F.C., Gadegbeku C.A., Kretzler M. Tissue transcriptome-driven identification of epidermal growth factor as a chronic kidney disease biomarker. Sci. Transl. Med. 2015;7:316ra193. doi: 10.1126/scitranslmed.aac7071. [DOI] [PMC free article] [PubMed] [Google Scholar]
- Kamijo A., Sugaya T., Hikawa A., Okada M., Okumura F., Yamanouchi M., Honda A., Okabe M., Fujino T., Hirata Y., Omata M., Kaneko R., Fujii H., Fukamizu A., Kimura K. Urinary excretion of fatty acid-binding protein reflects stress overload on the proximal tubules. Am. J. Pathol. 2004;165:1243–1255. doi: 10.1016/S0002-9440(10)63384-6. [DOI] [PMC free article] [PubMed] [Google Scholar]
- Kang H.M., Ahn S.H., Choi P., Ko Y.A., Han S.H., Chinga F., Park A.S., Tao J., Sharma K., Pullman J., Bottinger E.P., Goldberg I.J., Susztak K. Defective fatty acid oxidation in renal tubular epithelial cells has a key role in kidney fibrosis development. Nat. Med. 2015;21:37–46. doi: 10.1038/nm.3762. [DOI] [PMC free article] [PubMed] [Google Scholar]
- Kauffmann A., Gentleman R., Huber W. Arrayqualitymetrics—a bioconductor package for quality assessment of microarray data. Bioinformatics. 2009;25:415–416. doi: 10.1093/bioinformatics/btn647. [DOI] [PMC free article] [PubMed] [Google Scholar]
- Lambers Heerspink H.J., Tighiouart H., Sang Y., Ballew S., Mondal H., Matsushita K., Coresh J., Levey A.S., Inker L.A. GFR decline and subsequent risk of established kidney outcomes: a meta-analysis of 37 randomized controlled trials. Am. J. Kidney Dis. 2014;64:860–866. doi: 10.1053/j.ajkd.2014.08.018. [DOI] [PubMed] [Google Scholar]
- Langfelder P., Horvath S. WGCNA: an R package for weighted correlation network analysis. BMC Bioinformatics. 2008;9:559. doi: 10.1186/1471-2105-9-559. [DOI] [PMC free article] [PubMed] [Google Scholar]
- Ledo N., Ko Y.A., Park A.S., Kang H.M., Han S.Y., Choi P., Susztak K. Functional genomic annotation of genetic risk loci highlights inflammation and epithelial biology networks in CKD. J. Am. Soc. Nephrol. 2015;26:692–714. doi: 10.1681/ASN.2014010028. [DOI] [PMC free article] [PubMed] [Google Scholar]
- Levey A.S., Inker L.A., Matsushita K., Greene T., Willis K., Lewis E., De Zeeuw D., Cheung A.K., Coresh J. GFR decline as an end point for clinical trials in CKD: a scientific workshop sponsored by the National Kidney Foundation and the US Food and Drug Administration. Am. J. Kidney Dis. 2014;64:821–835. doi: 10.1053/j.ajkd.2014.07.030. [DOI] [PubMed] [Google Scholar]
- Lewis E.J., Hunsicker L.G., Bain R.P., Rohde R.D. The effect of angiotensin-converting-enzyme inhibition on diabetic nephropathy. The Collaborative Study Group. N. Engl. J. Med. 1993;329:1456–1462. doi: 10.1056/NEJM199311113292004. [DOI] [PubMed] [Google Scholar]
- Lin S.L., Chen Y.M., Chien C.T., Chiang W.C., Tsai C.C., Tsai T.J. Pentoxifylline attenuated the renal disease progression in rats with remnant kidney. J. Am. Soc. Nephrol. 2002;13:2916–2929. doi: 10.1097/01.asn.0000034909.10994.8a. [DOI] [PubMed] [Google Scholar]
- Lin H.Y., Lee Y.T., Chan Y.W., Tse G. Animal models for the study of primary and secondary hypertension in humans. Biomed. Rep. 2016;5:653–659. doi: 10.3892/br.2016.784. [DOI] [PMC free article] [PubMed] [Google Scholar]
- Marcantoni C., Fogo A.B. A perspective on arterionephrosclerosis: from pathology to potential pathogenesis. J. Nephrol. 2007;20:518–524. [PubMed] [Google Scholar]
- Mariani L.H., Martini S., Barisoni L., Canetta P.A., Troost J.P., Hodgin J.B., Palmer M., Rosenberg A.Z., Lemley K.V., Chien H.P., Zee J., Smith A., Appel G.B., Trachtman H., Hewitt S.M., Kretzler M., Bagnasco S.M. Interstitial fibrosis scored on whole-slide digital imaging of kidney biopsies is a predictor of outcome in proteinuric glomerulopathies. Nephrol. Dial. Transplant. 2017 doi: 10.1093/ndt/gfw443. [DOI] [PMC free article] [PubMed] [Google Scholar]
- Martini S., Nair V., Keller B.J., Eichinger F., Hawkins J.J., Randolph A., Boger C.A., Gadegbeku C.A., Fox C.S., Cohen C.D., Kretzler M. Integrative biology identifies shared transcriptional networks in CKD. J. Am. Soc. Nephrol. 2014;25:2559–2572. doi: 10.1681/ASN.2013080906. [DOI] [PMC free article] [PubMed] [Google Scholar]
- Mathew A., Cunard R., Sharma K. Antifibrotic treatment and other new strategies for improving renal outcomes. Contrib. Nephrol. 2011;170:217–227. doi: 10.1159/000325671. [DOI] [PMC free article] [PubMed] [Google Scholar]
- Matsui K., Kamijo-Ikemori A., Imai N., Sugaya T., Yasuda T., Tatsunami S., Toyama T., Shimizu M., Furuichi K., Wada T., Shibagaki Y., Kimura K. Clinical significance of urinary liver-type fatty acid-binding protein as a predictor of ESRD and CVD in patients with CKD. Clin. Exp. Nephrol. 2016;20:195–203. doi: 10.1007/s10157-015-1144-9. [DOI] [PubMed] [Google Scholar]
- Meng X.M., Nikolic-Paterson D.J., Lan H.Y. Inflammatory processes in renal fibrosis. Nat. Rev. Nephrol. 2014;10:493–503. doi: 10.1038/nrneph.2014.114. [DOI] [PubMed] [Google Scholar]
- Menne J., Eulberg D., Beyer D., Baumann M., Saudek F., Valkusz Z., Wiecek A., Haller H. C-C motif-ligand 2 inhibition with emapticap pegol (NOX-E36) in type 2 diabetic patients with albuminuria. Nephrol. Dial. Transplant. 2016 doi: 10.1093/ndt/gfv459. [DOI] [PMC free article] [PubMed] [Google Scholar]
- Meyer M.H., Smith S., Meyer R.A., Jr. Creatinine assay by the fuller's earth procedure or by enzymatic determination is adequate for urine but not plasma of mice. Comp. Biochem. Physiol. B. 1993;106:685–689. doi: 10.1016/0305-0491(93)90150-4. [DOI] [PubMed] [Google Scholar]
- Mise K., Hoshino J., Ueno T., Hazue R., Sumida K., Hiramatsu R., Hasegawa E., Yamanouchi M., Hayami N., Suwabe T., Sawa N., Fujii T., Hara S., Ohashi K., Takaichi K., Ubara Y. Clinical and pathological predictors of estimated GFR decline in patients with type 2 diabetes and overt proteinuric diabetic nephropathy. Diabetes Metab. Res. Rev. 2015;31:572–581. doi: 10.1002/dmrr.2633. [DOI] [PubMed] [Google Scholar]
- Mount P.F., Power D.A. Balancing the energy equation for healthy kidneys. J. Pathol. 2015;237:407–410. doi: 10.1002/path.4600. [DOI] [PubMed] [Google Scholar]
- Navarro-Gonzalez J.F., Mora-Fernandez C., Muros de Fuentes M., Garcia-Perez J. Inflammatory molecules and pathways in the pathogenesis of diabetic nephropathy. Nat. Rev. Nephrol. 2011;7:327–340. doi: 10.1038/nrneph.2011.51. [DOI] [PubMed] [Google Scholar]
- O'connell P.J., Zhang W., Menon M.C., Yi Z., Schroppel B., Gallon L., Luan Y., Rosales I.A., Ge Y., Losic B., Xi C., Woytovich C., Keung K.L., Wei C., Greene I., Overbey J., Bagiella E., Najafian N., Samaniego M., Djamali A., Alexander S.I., Nankivell B.J., Chapman J.R., Smith R.N., Colvin R., Murphy B. Biopsy transcriptome expression profiling to identify kidney transplants at risk of chronic injury: a multicentre, prospective study. Lancet. 2016;388:983–993. doi: 10.1016/S0140-6736(16)30826-1. [DOI] [PMC free article] [PubMed] [Google Scholar]
- Ramachandrarao S.P., Zhu Y., Ravasi T., Mcgowan T.A., Toh I., Dunn S.R., Okada S., Shaw M.A., Sharma K. Pirfenidone is renoprotective in diabetic kidney disease. J. Am. Soc. Nephrol. 2009;20:1765–1775. doi: 10.1681/ASN.2008090931. [DOI] [PMC free article] [PubMed] [Google Scholar]
- Rodriguez-Iturbe B., Johnson R.J., Herrera-Acosta J. Tubulointerstitial damage and progression of renal failure. Kidney Int. Suppl. 2005:S82–6. doi: 10.1111/j.1523-1755.2005.09915.x. [DOI] [PubMed] [Google Scholar]
- Schenone M., Dancik V., Wagner B.K., Clemons P.A. Target identification and mechanism of action in chemical biology and drug discovery. Nat. Chem. Biol. 2013;9:232–240. doi: 10.1038/nchembio.1199. [DOI] [PMC free article] [PubMed] [Google Scholar]
- Stevens L.A., Greene T., Levey A.S. Surrogate end points for clinical trials of kidney disease progression. Clin. J. Am. Soc. Nephrol. 2006;1:874–884. doi: 10.2215/CJN.00600206. [DOI] [PubMed] [Google Scholar]
- Takaori K., Nakamura J., Yamamoto S., Nakata H., Sato Y., Takase M., Nameta M., Yamamoto T., Economides A.N., Kohno K., Haga H., Sharma K., Yanagita M. Severity and frequency of proximal tubule injury determines renal prognosis. J. Am. Soc. Nephrol. 2016;27:2393–2406. doi: 10.1681/ASN.2015060647. [DOI] [PMC free article] [PubMed] [Google Scholar]
- Tervaert T.W., Mooyaart A.L., Amann K., Cohen A.H., Cook H.T., Drachenberg C.B., Ferrario F., Fogo A.B., Haas M., De Heer E., Joh K., Noel L.H., Radhakrishnan J., Seshan S.V., Bajema I.M., Bruijn J.A. Pathologic classification of diabetic nephropathy. J. Am. Soc. Nephrol. 2010;21:556–563. doi: 10.1681/ASN.2010010010. [DOI] [PubMed] [Google Scholar]
- United States Renal Data System . National Institute of Diabetes and Digestive and Kideny disease; Bethesda, MD: 2015. USRDS Annual Data Report: Epidemiology of Kideny Disease in the United States; p. 2015. [Google Scholar]
- Weldegiorgis M., De Zeeuw D., Heerspink H.J. Renal end points in clinical trials of kidney disease. Curr. Opin. Nephrol. Hypertens. 2015;24:284–289. doi: 10.1097/MNH.0000000000000118. [DOI] [PubMed] [Google Scholar]
- Woroniecka K.I., Park A.S., Mohtat D., Thomas D.B., Pullman J.M., Susztak K. Transcriptome analysis of human diabetic kidney disease. Diabetes. 2011;60:2354–2369. doi: 10.2337/db10-1181. [DOI] [PMC free article] [PubMed] [Google Scholar]
- Wu Y., Su T., Yang L., Zhu S.N., Li X.M. Urinary neutrophil gelatinase-associated lipocalin: a potential biomarker for predicting rapid progression of drug-induced chronic tubulointerstitial nephritis. Am J Med Sci. 2010;339:537–542. doi: 10.1097/maj.0b013e3181dd0cb1. [DOI] [PubMed] [Google Scholar]
Associated Data
This section collects any data citations, data availability statements, or supplementary materials included in this article.
Supplementary Materials
Genes whose expression levels correlate significantly with eGFR (FDR < 0.05). Presented are probe i.d., gene symbol, regression effect, p value and FDR adjusted p value.
Genes whose expression levels correlate significantly with eGFR after adjustment to 5 co-variables (age, race, gender, hypertension status and diabetes status) (FDR < 0.05). Presented are probe i.d., gene symbol, regression effect, p value and FDR adjusted p value.
Genes whose expression levels correlate significantly with interstitial fibrosis (FDR < 0.05). Presented are probe i.d., gene symbol, regression effect, p value and FDR adjusted p value.
Genes whose expression levels correlate significantly with interstitial fibrosis after adjustment to 5 co-variables (age, race, gender, hypertension status and diabetes status) (FDR < 0.05). Presented are probe i.d., gene symbol, regression effect, p value and FDR adjusted p value.
Genes whose expression levels correlate significantly with interstitial fibrosis after adjustment to 5 co-variables (age, race, gender, hypertension status and diabetes status) and to eGFR (FDR < 0.05). Presented are probe i.d., gene symbol, regression effect, p value and FDR adjusted p value.
Supplementary figures