Figure 4.
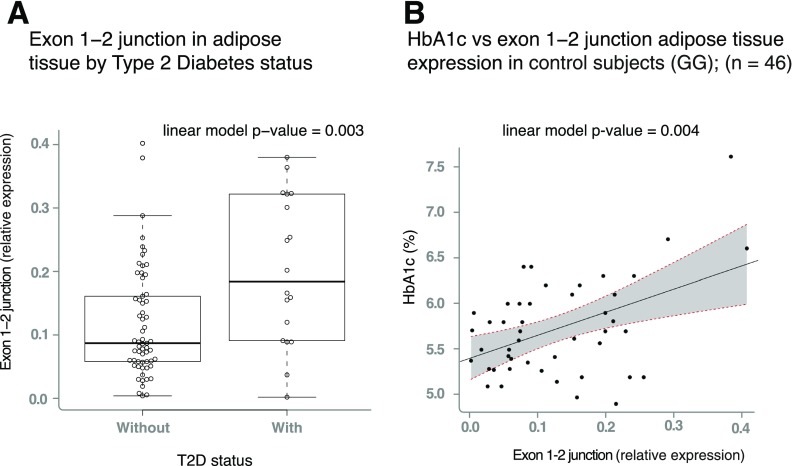
Expression of IGF2 isoform 2 is associated with T2D and HbA1c. A: Boxplots representing the expression of IGF2 isoform 2 across T2D case and control subjects in individuals homozygous for the G common allele. The linear model P value represents the association between IGF2 isoform 2 expression, adjusted by age, BMI, and sex. B: IGF2 isoform 2 positively correlates with higher HbA1c in participants without diabetes. The gray area limited by the dashed red lines represents the 95% CI of the slope of the linear regression. Patients with HbA1c above 6.5% did not have T2D according to the diagnostic criteria of Mexico at the time of extraction, as HbA1c was not considered a criterion in Mexico at the time of extraction. Therefore, none of the subjects were receiving any glucose-lowering treatment. For clarity, as the genotype is strongly associated with IGF2 isoform 2 expression, only individuals carrying the GG genotype are plotted in A and B.

