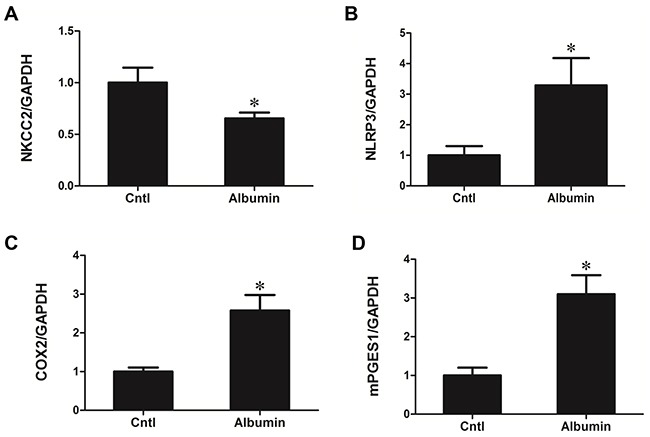
Figure 10. Albumin effects on the regulation of NKCC2 and involved signaling pathway in primary renal tubular cells.

qRT-PCR analysis of A. NKCC2, B. NLRP3, C. COX-2, and D. mPGES-1 mRNA expression following albumin treatment in primary renal tubular cells. The values represent the means±SDs (n=6 in each group). * p<0.01 vs. control.
