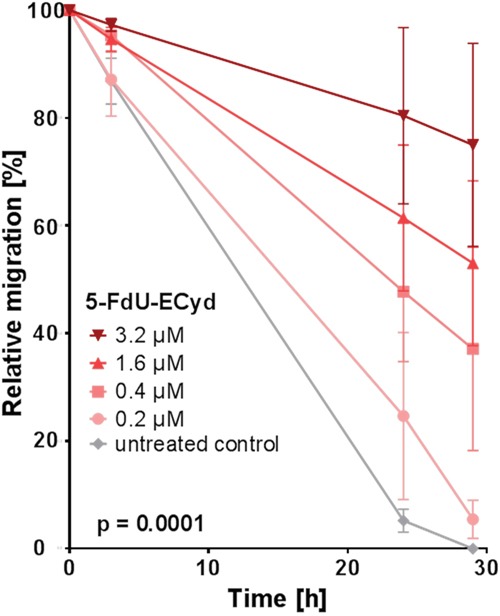
Figure 3. The effect of 5-FdU-ECyd on the migration of platinum-resistant Skov-3-IP cells.

The figure shows the relative migration of platinum-resistant Skov-3-IP ovarian cancer cells after treatment with a broad range of 5-FdU-ECyd concentrations (colored lines), compared to untreated control cells (grey line). Relative migration was calculated by measuring the percentage of the cell free area (closure of the gap) at the indicated time points and for each treatment condition. Values were calculated from three independent experiments and are reported as mean ± SEM. Statistical significance is indicated, according to the two-way ANOVA test.
