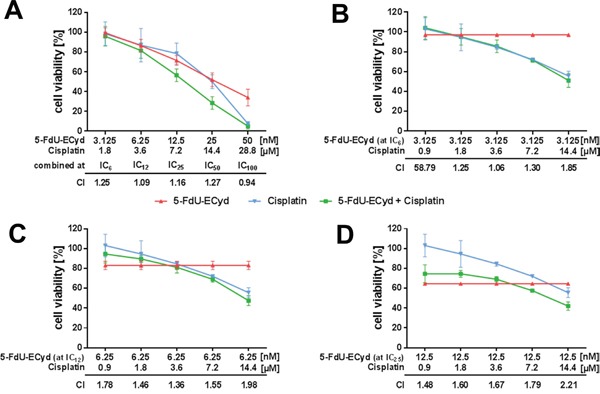
Figure 5. Drug interaction analysis of 5-FdU-ECyd and cisplatin.

(A) The figure shows cell viability dose-response curves for platinum-resistant A2780cis cells treated with 5-FdU-ECyd alone (red curve), cisplatin alone (blue curve) and both drugs combined (green curve). In this experiment, drugs were combined at five equipotent molar concentrations (IC6: 5-FdU-ECyd 3.125 nM + cisplatin 1.8 μM; IC12: 5-FdU-ECyd 6.25 nM + cisplatin 3.6 μM; IC25: 5-FdU-ECyd 12.5 nM + cisplatin 7.2 μM; IC50: 5-FdU-ECyd 25 nM + cisplatin 14.4 μM; IC100: 5-FdU-ECyd 50 nM + cisplatin 28.8 μM). For each combination, a combination index (CI) value was calculated and is indicated in the diagram, in order to describe drug interaction over the entire molar range of drug combinations. A CI-value < 0.9 indicates a synergistic interaction, a CI-value between 0.9 and 1.1 indicates an additive interaction and a CI-value > 1.1 indicates an antagonistic interaction [43]. (B-D) The figures show standard cell viability dose-response curves for cisplatin with a fixed concentration of low dose 5-FdU-ECyd as additional drug (green curves, 5-FdU-ECyd at IC25: 3.125 μM or IC12: 6.25 μM or IC6: 12.5 μM), compared to cisplatin alone (blue curves) and 5-FdU-ECyd alone (red curves). In all experiments, normalized percentages of cell viability were averaged from three independent experiments and are reported as mean ± SD.
