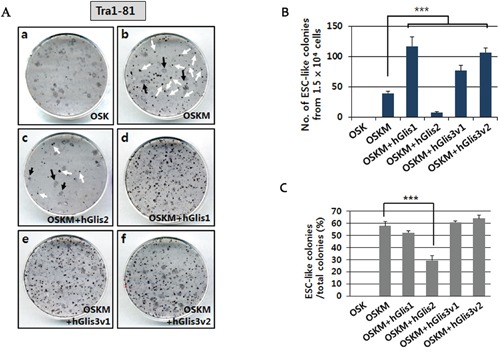
Figure 2. Comparison of the reprogramming activities of Glis proteins.

(A) The reprogramming efficiencies of the Glis proteins were compared by counting the number of ESC-like (iPSC) colonies generated after staining with the pluripotency marker Tra1-80. Immunostaining was performed at day 21 post-transduction of the hADSCs with the transgene-expressing retroviruses. Two different forms of colonies were detected, including ESC-like colonies with a clear boundary (i.e., white arrows in Figure 2A, b & c) and transformed cell colonies (i.e., black arrows in Figure 2A, b & c). (B) The number of ESC-like colonies formed from 1.5 × 10⁴ hADSCs is indicated in the graph. n = 3, ***p<0.001. (C) The percentage of ESC-like colonies among the total colonies (both ESC-like and transformed cell colonies) is shown in the graph. n = 3, ***p<0.001.
