

Abstract
Objective:
This observational multimodality brain imaging study investigates emergence of endophenotypes of late-onset Alzheimer disease (AD) risk during endocrine transition states in a cohort of clinically and cognitively normal women and age-matched men.
Methods:
Forty-two 40- to 60-year-old cognitively normal women (15 asymptomatic perimenopausal by age [CNT], 13 perimenopausal [PERI], and 14 postmenopausal [MENO]) and 18 age- and education-matched men were examined. All patients had volumetric MRI, 18F-fluoro-2-deoxyglucose (FDG)–PET (glucose metabolism), and Pittsburgh compound B–PET scans (β-amyloid [Aβ] deposition, a hallmark of AD pathology).
Results:
As expected, the MENO group was older than the PERI and CNT groups. Otherwise, groups were comparable on clinical and neuropsychological measures and APOE4 distribution. Compared to CNT women and to men, and controlling for age, PERI and MENO groups exhibited increased indicators of AD endophenotype, including hypometabolism, increased Aβ deposition, and reduced gray and white matter volumes in AD-vulnerable regions (p < 0.001). AD biomarker abnormalities were greatest in MENO, intermediate in PERI, and lowest in CNT women (p < 0.001). Aβ deposition was exacerbated in APOE4-positive MENO women relative to the other groups (p < 0.001).
Conclusions:
Multimodality brain imaging indicates sex differences in development of the AD endophenotype, suggesting that the preclinical AD phase is early in the female aging process and coincides with the endocrine transition of perimenopause. These data indicate that the optimal window of opportunity for therapeutic intervention in women is early in the endocrine aging process.
After advanced age, female sex is the major risk factor for late-onset Alzheimer disease (AD),1 even after accounting for women's greater longevity relative to men.2 While AD is not unique to women, women constitute the majority of people with the disease, accounting for up to 3.2 million cases in the United States alone.3
Increased risk of late-onset AD in women suggests pathophysiologic changes that may be mediated by endocrine transition states such as menopause, which is both female-specific and age-related.4
Perimenopause is a midlife neuroendocrine transition state that occurs on the background of an aging biology and results in reproductive senescence. While typically viewed as a reproductive transition, the symptoms of perimenopause are largely neurologic in nature, including disruption in estrogen-regulated systems such as thermoregulation, sleep, circadian rhythms, and sensory processing, as well as depression and impairment in multiple cognitive domains.4
Preclinical evidence indicates that estrogenic regulation of brain glucose metabolism is dismantled during perimenopause, inducing a hypometabolic state, which is accompanied by increased fatty acid catabolism, β-amyloid (Aβ) (a hallmark of AD pathology) deposition, and declines in synaptic plasticity,5–7 which in turn may increase risk of AD later in life.4
This multimodality neuroimaging study bridges discovery and clinical science to characterize sex-dependent emergence of well-established AD biomarkers8 such as Aβ deposition (11C–Pittsburgh compound B [PiB]–PET), glucose hypometabolism (18F-fluoro-2-deoxyglucose [FDG]–PET), and brain atrophy (MRI) in clinically and cognitively normal women at different endocrine transition stages (premenopause vs perimenopause vs menopause) and age-matched men.
METHODS
Participants.
Among a larger pool of clinically and cognitively normal individuals participating in brain imaging studies at New York University School of Medicine, this study focused on a subset of 60 participants age 40–60 years who completed clinical, MRI, FDG, and PiB-PET examinations between 2010 and 2015. Patients were derived from multiple community sources, including individuals interested in research participation and family members of impaired patients.
The study protocol has been published previously.9,10 Briefly, all patients underwent thorough physical examinations with detailed medical histories. Individuals with medical conditions, or history of conditions that may affect brain structure or function (e.g., stroke, unmanaged diabetes, depression, head trauma, any neurodegenerative diseases, hydrocephalus), and those taking psychoactive medications were excluded. Only patients 40–60 years of age, with education ≥12 years, Clinical Dementia Rating 0, Global Deterioration Scale ≤2, Mini-Mental State Examination ≥27, Hamilton Depression Scale <16, Modified Hachinski Ischemia Scale <4, and normal cognitive test performance for age and education were included.9,10
DNA was obtained from venous blood samples to determine APOE genotypes using standard quantitative PCR.9,10 Individuals with 1 or 2 ε4 alleles were categorized as ε4 carriers (APOE4+) and compared to noncarriers (APOE4−).
Standard protocol approvals, registrations, and patient consents.
Informed consent was obtained from all patients for participation in this institutional review board–approved study.
Determination of menopausal status.
Determination of menopausal status was based on clinical judgment, medical records, and detection of cluster symptoms according to the Stages of Reproductive Aging Workshop criteria.11 Detection of cluster symptoms was based on presence of sweatiness/hot flashes, mood swings, insomnia, change in appetite, loss of libido, cognitive problems/concentration, and short-term memory complaints.11
Detailed medical records of menopausal status were available for 52 women age 40–60 years. Ten of these women were excluded due to medical reasons including hysterectomy (3 cases), thyroid disease (2 cases), cancer (2 cases), and other comorbidities (3 cases).
The remaining 42 women included 15 asymptomatic perimenopausal women by age (e.g., regular cyclers, or premenopausal controls, CNT), 13 symptomatic perimenopausal women (e.g., irregular cyclers, PERI), and 14 postmenopausal women (e.g., no menstrual cycles for ≥12 months, MENO). These groups were compared to each other and to 18 age- and education-matched men selected on the basis of a complete imaging dataset.
Data acquisition and preparation.
All patients received volumetric MRI, PiB, and FDG-PET scans at Weill Cornell Medical College following standardized procedures.9,10,12 For PET, patients were positioned in the scanner 60 minutes postinjection of 15 mCi of 11C-PiB, and scanned for 30 minutes in 3D mode on an LS Discovery (GE Healthcare, Cleveland, OH) or BioGraph (Siemens, Munich, Germany) PET/CT scanner. The FDG scan was performed >30 minutes after completion of the PiB scan or on a separate day. After an overnight fast, patients were injected with 5 mCi of 18F-FDG, positioned in the scanner 35 minutes postinjection, and scanned for 20 minutes. All images were corrected for attenuation, scatter, and decay, and smoothed for uniform resolution.13
For each patient, summed PET images corresponding to 40–60 minutes of FDG data and 60–90 minutes of PiB data were coregistered to the corresponding MRI and to each other using the normalized mutual information routine of statistical parametric mapping (SPM12).14 MRIs were segmented into gray matter (GM), white matter (WM), and CSF and normalized to Montreal Neurological Institute space by high-dimensional warping (DARTEL).14 MRI-coregistered PET scans were spatially normalized using patient-specific transformation matrixes obtained from MRI, and smoothed with a 10-mm full width at half maximum (FWHM) filter. Jacobian modulation was applied to restore absolute GM and WM volumes in the segmented MRIs, which were smoothed with an 8-mm FWHM kernel.12
Statistical analysis.
SPSS (SPSS Inc., Chicago, IL) v22 and SPM12 were used for data analysis. Clinical and demographic measures were examined with univariate general linear models and χ2 tests at p < 0.05.
For SPM analysis, a full factorial model with post hoc t contrasts was used to test for regional differences in imaging measures across sex (women vs men) and reproductive aging groups (premenopausal vs perimenopausal vs postmenopausal women vs men), accounting for modality-specific reference values (e.g., total intracranial volume for MRI, pons uptake for FDG, and cerebellar GM uptake for PiB).9,10,12
Age, education, and APOE genotype were examined as covariates. APOE status was examined for interaction effects with sex and clinical group using adjusted models that included a 2-way interaction term for each comparison.
As we had specific a priori hypotheses on which brain regions would show possible biomarker effects, results were examined at p < 0.001, uncorrected (cluster extent ≥25 voxels) in the search volume defined by a masking image created from a set of predefined bilateral AD-related regions of interest.9,10,12 These included posterior cingulate cortex, precuneus, inferior and superior parietal lobule, lateral and medial temporal cortex, and medial, inferior, and prefrontal cortex. PET analyses were further restricted to a standardized GM mask.12
Anatomic location of brain regions showing significant effects was described using Talairach and Tournoux coordinates. Biomarker measures were extracted from clusters of voxels showing significant effects for further analysis.
Linear regressions were used to evaluate the associations among biomarkers, laboratory measures, neuropsychological measures, and clinical group, using the same confounds and interaction terms as above.
To directly compare the degree of biomarker abnormalities, z scores were generated for each woman and each biomarker modality against men, and examined with paired t tests across all patients and within groups.12,15 Stepwise linear regressions and receiver operating characteristic curves were used to compare biomarkers as predictors of group membership and to calculate associated relative risk and 95% confidence intervals. Results were considered significant at p < 0.05.
RESULTS
Participants.
Participant characteristics are shown in table 1. As expected, postmenopausal women (MENO) were on average 7 ± 3 years older than premenopausal (CNT) and perimenopausal (PERI) groups (p < 0.05). Groups were otherwise comparable for clinical measures and APOE4 distribution, as well as neuropsychological testing, with the exception of lower DSST scores in men relative to CNT and PERI women (ps ≤ 0.01), and a trend vs MENO (p = 0.07). A trend towards higher prevalence of subjective complaints was evident in the MENO group vs other groups (p = 0.08; table 1).
Table 1.
Demographic and clinical characteristics by clinical group
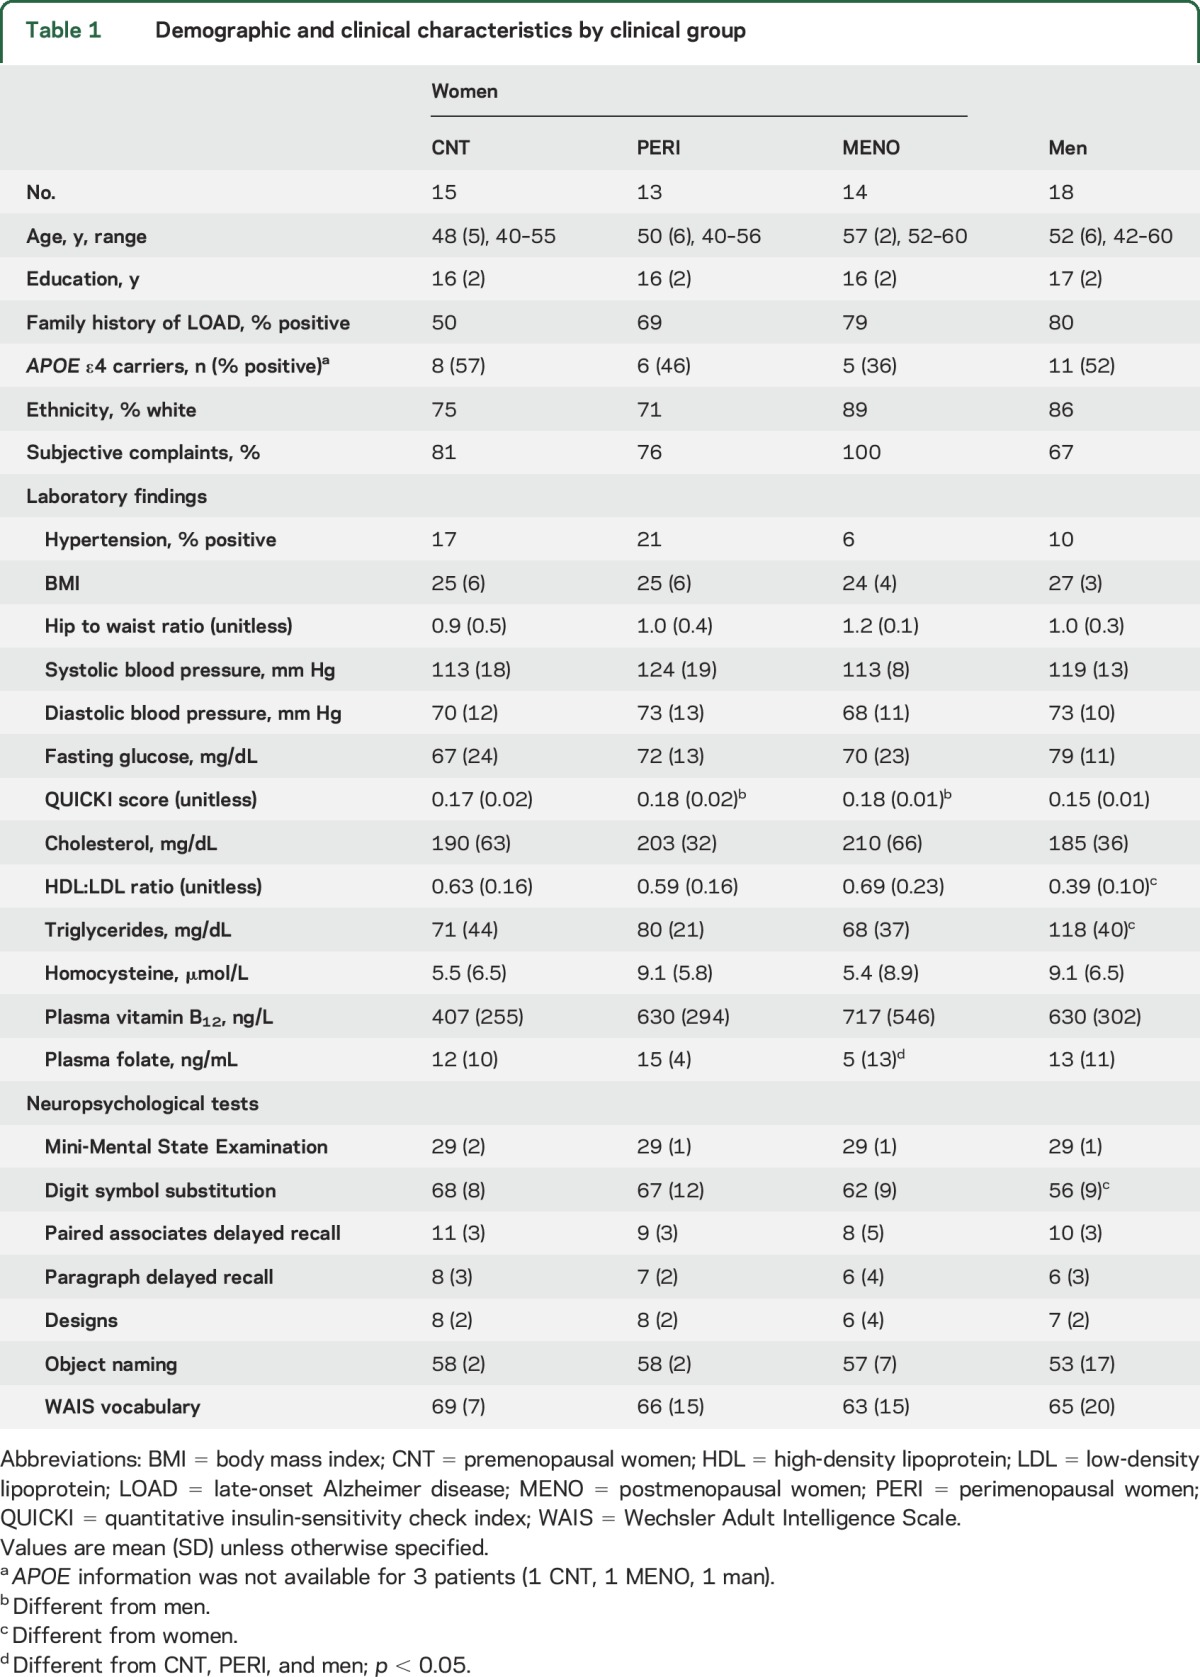
While all patients were normoglycemic, the PERI and MENO groups exhibited higher quantitative insulin-sensitivity check index (QUICKI) scores16 compared to men (ps < 0.01; table 1). The MENO group also had reduced plasma folate vs men (p < 0.05), while men had higher triglycerides and lower high-density lipoprotein/low-density lipoprotein ratios vs all female groups (ps < 0.02).
FDG-PET glucose metabolism.
Controlling for age and pons activity, women showed reduced glucose metabolism (CMRglc) in frontal cortex compared to men (p < 0.001; table e-1 at Neurology.org). On post hoc analysis, these effects were driven by the MENO and PERI groups (p < 0.001), while CNT showed a trend towards reduced CMRglc vs men (p < 0.01; figure 1). In addition, both PERI and MENO groups showed reduced CMRglc in posterior cingulate/precuneus (PCC) and parietal and temporal cortex vs CNT, with a gradient effect of CNT > PERI > MENO (p < 0.001; figure 1).
Figure 1. 18F-fluoro-2-deoxyglucose (FDG)–PET brain glucose metabolism as a function of chronologic vs endocrine aging.

Statistical parametric maps (SPMs) display FDG uptake reductions in (A) asymptomatic perimenopausal women, (B) perimenopausal women, and (C) menopausal women vs men. SPMs are represented on a color-coded scale (1 < z < 3, where z > 2 corresponds to p < 0.001) and displayed on a standardized MRI.
Results remained substantially unchanged including education and APOE as covariates. There were no significant APOE by group interactions in any of the above regions.
PiB-PET Aβ deposition.
Controlling for age and cerebellar uptake, women exhibited increased PiB uptake in PCC, fusiform, and frontal cortex vs men (p < 0.001; table e-2). On post hoc analysis, these effects were more pronounced in MENO and PERI groups, and less so in the CNT group (ps < 0.001; figure 2). In addition, both PERI and MENO groups showed increased PiB uptake in frontal and temporal cortex vs CNT (16% and 19%), with a gradient effect of CNT < PERI < MENO (p < 0.001; figure 2).
Figure 2. Pittsburgh compound B (PiB)–PET β-amyloid deposition as a function of chronologic vs endocrine aging.

Statistical parametric maps (SPMs) display increased 11C-PiB uptake in (A) asymptomatic perimenopausal women, (B) perimenopausal women, and (C) menopausal women vs men. SPMs are represented on a color-coded scale (1 < z < 3, where z > 2 corresponds to p < 0.001) and displayed on a standardized MRI.
As compared to any of the female groups, no brain regions showed increased PiB uptake in men.
Albeit limited by the small number of patients, APOE by group interaction effects were observed in the frontal cortex (p < 0.001). In these regions, APOE4+ MENO patients showed higher PiB binding than all other groups, ranging from 5% as compared to APOE4+ CNT to 20% compared to APOE4− men (figure e-1).
MRI GM and WM volumes.
Compared to men and controlling for age and total intracranial volume, women showed reduced GM volumes (GMV) and WM volumes (WMV) in PCC, frontal, temporal, and parietal regions (p < 0.001; table e-3). On post hoc analysis, these effects were more pronounced in the MENO and PERI groups than in the CNT group (figure 3). In addition, both PERI and MENO groups showed reduced frontal GMV and WMV vs CNT women, with a gradient indicating CNT > PERI > MENO (p < 0.001; figure 3).
Figure 3. MRI brain volumes as a function of chronologic vs endocrine aging.

Statistical parametric maps (SPMs) display (left) gray matter and (right) white matter volume reductions in (A) asymptomatic perimenopausal women, (B) perimenopausal women, and (C) menopausal women vs men. SPMs are represented on different color-coded scales (1 < z < 3, where z > 2 corresponds to p < 0.001) and displayed on a standardized MRI.
Men exhibited no reduction in GMV or WMV compared to any of the female groups.
Results remained substantially unchanged controlling for education and APOE as covariates.
Biomarker comparisons.
Within all female groups, the extent of hypometabolism and WMV loss exceeded that of PiB uptake and GMV loss (p ≤ 0.009; figure 4). Within the MENO group, WMV loss exceeded magnitude of hypometabolism (p = 0.03).
Figure 4. Comparing Alzheimer disease (AD) biomarker abnormalities across groups.

(A) 18F-fluoro-2-deoxyglucose (FDG) uptake. (B) Pittsburgh compound B (PiB) uptake. (C) Gray matter volumes. (D) White matter volumes. Biomarkers are extracted from frontal cortex clusters showing maximal statistical differences across groups and displayed on the same scale. Values are grand-mean scaled, reference-adjusted mean values, SEM. *p < 0.05, **p < 0.01. CNT = asymptomatic perimenopausal women by age; PERI = symptomatic perimenopausal women; MENO = postmenopausal women.
Logistic regressions indicated that the combination of CMRglc and WMV was the most accurate predictor of female vs male status with 90% accuracy and 4.5 relative risk (RR) (p < 0.001; table e-4). Adding PiB uptake to the model increased the discrimination accuracy of MENO vs men to 100% (36.5 RR; p < 0.001). Among female groups, the combination of CMRglc and PiB uptake was the most accurate predictor of MENO vs CNT (96% accuracy, RR 26.5, 1.7–408; p < 0.001; table e-4). These biomarkers independently predicted MENO vs PERI (CMRglc: 84% accuracy, 4.0 RR; PiB: 80% accuracy, 4.9 RR; ps < 0.001), while PiB uptake was the best predictor of PERI vs CNT (89% accuracy, 11.9 RR; p < 0.001; table e-4).
Correlations between biomarkers and clinical and cognitive measures.
Across all patients, controlling for age, QUICKI scores were associated with frontal CMRglc (pons-adjusted β = −0.33, p = 0.026) and WMV (β = −0.34, p = 0.025). On post hoc examination, CMRglc effects were driven by the PERI and MENO groups (β = −0.56 and β = −0.60, respectively, ps ≤ 0.05), while no significant associations occurred in CNT women or men. Similarly, WMV effects were evident in the MENO group (β = −0.68, p = 0.05), borderline in the PERI group (β = −0.56, p = 0.09), and not significant among CNT women or men.
DISCUSSION
The results indicate that as women go through menopause, and relative to age-matched men, multiple imaging endophenotypes indicative of AD risk emerge. These include reduced CMRglc, increased Aβ accumulation, and GM and WM loss in the same brain regions as patients with clinical AD. AD biomarker abnormalities were most pronounced in postmenopausal women, intermediate in perimenopausal women, and lowest in premenopausal women.
These results indicate progressively increased risk of AD as women undergo menopausal changes, suggesting that endocrine aging accelerates chronologic aging in the female brain several years, if not decades, prior to emergence of possible clinical symptoms of AD.
These findings are particularly relevant given current understanding of AD as a progressive disorder characterized by an extended preclinical phase during which the disease is underway but has not led to any recognizable clinical or cognitive symptoms.17 Given the known relationship between altered AD biomarkers and onset of clinical symptoms,8 our data indicate that female-specific endocrine transitions at least in part account for the increased AD risk observed in women.
This is consistent with mechanistic evidence of a bioenergetic crisis in the female brain that emerges specifically during perimenopause.4 In animal studies, estrogenic control of glucose metabolism in the brain is disassembled during the perimenopausal transition, leading to an adaptive activation of ketone body metabolism.18 Ultimately, the reliance of ketone bodies as an alternative metabolic fuel to generate adenosine triphosphate can lead to catabolism of white matter to generate ketones.19 This in turn promotes neuronal loss and accumulation of AD pathology.20
The human brain imaging findings described herein are consistent with mechanistic preclinical pathway analyses.4,18–21 Perimenopausal and postmenopausal women exhibited an energetically compromised brain, as reflected in a 4-fold increased risk of hypometabolism and white matter loss relative to premenopausal women and age-matched men. In addition, although all participants were normoglycemic, brain metabolic markers correlated with indicators of insulin resistance, consistent with prior reports of systemic dysmetabolism during perimenopause and postmenopause.4,21
Our data also suggest that the 3 greatest risk factors for late-onset AD—age, female sex, and APOE4 genotype22—interact during the endocrine aging process to cooperatively drive development of AD pathology. PiB uptake in postmenopausal women was exacerbated by APOE4 genotype, a well-known genetic risk factor that disproportionally affects AD risk in women.1,23 Maximum group differences were observed in frontal cortex, a brain region particularly vulnerable to the combined effects of aging and APOE4 genotype in predisposed individuals.24 Even in the absence of dementia, APOE4 is known to significantly increase brain atrophy and decrease brain connectivity much more strongly in women than in men.25,26 Together with previous reports, our findings of exacerbated Aβ load in postmenopausal women positive for APOE4 genotype provide a possible pathophysiologic as well as endocrine substrate to the clinical data.
While it seems likely that loss of estrogen during perimenopause may be driving the observed AD biomarker shifts, other explanations exist. For example, the drop in estrogen levels may be acting as a surrogate biomarker of other underlying molecular changes, such as age-related declines in bioenergetic function. As mitochondria are needed for estrogen synthesis and mitochondrial deficits have long been implicated in AD,27 studies are needed to investigate whether AD biomarker changes in menopausal women are related to altered mitochondria activity.
The observed sex differences may also be related to lifestyle and vascular risk factors known to affect AD risk.28 While our postmenopausal women showed lower folate levels compared to the other groups, their homocysteine was not affected, possibly due to their higher plasma vitamin B12 levels. The higher blood lipids in men are also suggestive of increased vascular risk relative to women,28 though this group did not show biomarker abnormalities. Other studies with larger samples are needed to assess whether diet, exercise, and vascular risk factors influence biomarker and cognitive outcomes in aging men and women.
Several issues require further investigation. First, our results are cross-sectional in nature and do not allow for determination of causality or temporal relationships between biomarkers. Second, as with other studies in asymptomatic at-risk individuals,12,24,29 imaging biomarkers were not associated with neuropsychological measures, most likely because our patients were all cognitively normal, relatively young, and high school graduates, which could have resulted in a ceiling effect. Other studies with larger samples and longitudinal follow-up are warranted to determine whether biomarker abnormalities observed in perimenopausal and postmenopausal women are predictive of cognitive decline.
Our determination of menopausal state in the absence of hormonal confirmation is vulnerable to error. Characterization of reproductive stage was based on self-report, clinical judgment, and established diagnostic criteria known to have good agreement with clinical and laboratory findings,11 which reduce potential for misclassification. While we consider it likely that the changes in menstrual cycle frequency reported by our participants reflect their actual menopausal status, because of the synchronous timing of medical assessments and brain imaging examinations, our menopausal group may have included patients still in perimenopause. Likewise, our premenopausal controls may have included patients undergoing perimenopausal changes. This would, however, conservatively reduce power in detecting differences between groups. Our findings of gradual increases in biomarker abnormalities in perimenopausal and postmenopausal patients vs premenopausal controls and vs men are consistent with preclinical and neuropsychological indicators of change in cognitive function30–32 and provide support that our group assignment criteria were likely correct. Future studies are warranted to examine hormonal levels,33 as well as additional metabolic indicators21 to further refine reproductive staging.
Two of the 14 postmenopausal women reported being on hormonal replacement therapy (HRT). While these participants' CMRglc values were on the lower end of the spectrum (1.3 and 1.45 standardized uptake value ratio [SUVR], respectively), their Aβ load was within average (1.1 and 1.25 SUVR). As such, it is difficult to conclude whether these women had benefited from therapy. Clinical trials have shown that HRT is effective at preserving CMRglc in AD regions, especially if initiated prior to menopause,34,35 whereas it can be deleterious when initiated after menopause36 or in type 2 diabetic women.34,37,38 Our neuroimaging supports further investigation of the potential efficacy of estrogen-based therapies in preventing decline in brain bioenergetic capacity in women of perimenopausal age.
In keeping with previous studies with similar middle-aged cohorts,24 PiB measures were examined as continuous rather than dichotomous variables. Using this method, we observed significant quantitative differences across sex and female groups, which included so-called PiB-negative patients. These findings are consistent with previous evidence that the PiB signal is sensitive to detect early, albeit mild Aβ accumulation within middle-aged patients at risk for AD, especially APOE4 carriers.10,12,24,39,40
We caution that the present results were found in small numbers of carefully screened patients under controlled clinical conditions. Replication of these preliminary findings in community-based populations with more diversified socioeconomic and medical status as well as with other AD biomarkers is warranted.
Supplementary Material
GLOSSARY
- Aβ
β-amyloid
- AD
Alzheimer disease
- CMRglc
glucose metabolism
- CNT
premenopausal women
- FDG
18F-fluoro-2-deoxyglucose
- FWHM
full width at half maximum
- GM
gray matter
- GMV
gray matter volumes
- HRT
hormonal replacement therapy
- MENO
postmenopausal women
- PCC
posterior cingulate/precuneus
- PERI
perimenopausal women
- PiB
Pittsburgh compound B
- QUICKI
quantitative insulin-sensitivity check index
- RR
relative risk
- SPM
statistical parametric mapping
- SUVR
standardized uptake value ratio
- WM
white matter
- WMV
white matter volumes
Footnotes
Supplemental data at Neurology.org
AUTHOR CONTRIBUTIONS
Dr. Mosconi: study concept and design, acquisition of data, analysis and interpretation, critical revision of the manuscript for important intellectual content, study supervision. Dr. Berti: study concept and design, analysis and interpretation, critical revision of the manuscript for important intellectual content. Dr. Quinn: acquisition of data, analysis and interpretation, critical revision of the manuscript for important intellectual content. Dr. McHugh: acquisition of data, critical revision of the manuscript for important intellectual content. G. Petrongolo: acquisition of data, critical revision of the manuscript for important intellectual content. I. Varsavsky: acquisition of data, critical revision of the manuscript for important intellectual content. Dr. Osorio: acquisition of data, critical revision of the manuscript for important intellectual content. Dr. Pupi: study concept and design, critical revision of the manuscript for important intellectual content. Dr. Vallabhajosula: acquisition of data, analysis and interpretation, critical revision of the manuscript for important intellectual content. Dr. Isaacson: study concept and design, critical revision of the manuscript for important intellectual content. Dr. de Leon: acquisition of data, critical revision of the manuscript for important intellectual content. Dr. Brinton: study concept and design, analysis and interpretation, critical revision of the manuscript for important intellectual content.
STUDY FUNDING
Study funded by NIH/NIA (AG035137, AG13616, 2P01AG026572); funding from the Department of Neurology at Weill Cornell Medical College; and philanthropic support of the Alzheimer's Prevention Clinic, Weill Cornell Memory Disorders Program.
DISCLOSURE
The authors report no disclosures relevant to the manuscript. Go to Neurology.org for full disclosures.
REFERENCES
- 1.Farrer LA, Cupples LA, Haines JL, et al. Effects of age, sex, and ethnicity on the association between apolipoprotein E genotype and Alzheimer disease: a meta-analysis: APOE and Alzheimer Disease Meta Analysis Consortium. JAMA 1997;278:1349–1356. [PubMed] [Google Scholar]
- 2.Vina J, Lloret A. Why women have more Alzheimer's disease than men: gender and mitochondrial toxicity of amyloid-beta peptide. J Alzheimers Dis 2010;20(suppl 2):S527–S533. [DOI] [PubMed] [Google Scholar]
- 3.Alzheimer's Association. 2016 Alzheimer's disease facts and figures. Alzheimers Dement 2016;12:459–509. [DOI] [PubMed] [Google Scholar]
- 4.Brinton RD, Yao J, Yin F, Mack WJ, Cadenas E. Perimenopause as a neurological transition state. Nat Rev Endocrinol 2015;11:393–405. [DOI] [PMC free article] [PubMed] [Google Scholar]
- 5.Brinton RD. Estrogen-induced plasticity from cells to circuits: predictions for cognitive function. Trends Pharmacol Sci 2009;30:212–222. [DOI] [PMC free article] [PubMed] [Google Scholar]
- 6.Yao J, Brinton RD. Estrogen regulation of mitochondrial bioenergetics: implications for prevention of Alzheimer's disease. Adv Pharmacol 2012;64:327–371. [DOI] [PMC free article] [PubMed] [Google Scholar]
- 7.Liu F, Day M, Muniz LC, et al. Activation of estrogen receptor-beta regulates hippocampal synaptic plasticity and improves memory. Nat Neurosci 2008;11:334–343. [DOI] [PubMed] [Google Scholar]
- 8.Jack CR Jr, Knopman DS, Jagust WJ, et al. Tracking pathophysiological processes in Alzheimer's disease: an updated hypothetical model of dynamic biomarkers. Lancet Neurol 2013;12:207–216. [DOI] [PMC free article] [PubMed] [Google Scholar]
- 9.Mosconi L, Brys M, Switalski R, et al. Maternal family history of Alzheimer's disease predisposes to reduced brain glucose metabolism. Proc Natl Acad Sci USA 2007;104:19067–19072. [DOI] [PMC free article] [PubMed] [Google Scholar]
- 10.Mosconi L, Rinne JO, Tsui WH, et al. Increased fibrillar amyloid-β burden in normal individuals with a family history of late-onset Alzheimer's. Proc Natl Acad Sci USA 2010;107:5949–5954. [DOI] [PMC free article] [PubMed] [Google Scholar]
- 11.Harlow SD, Gass M, Hall JE, et al. Executive summary of the Stages of Reproductive Aging Workshop + 10: addressing the unfinished agenda of staging reproductive aging. Menopause 2012;19:387–395. [DOI] [PMC free article] [PubMed] [Google Scholar]
- 12.Mosconi L, Murray J, Tsui WH, et al. Brain imaging of cognitively normal individuals with 2 parents affected by late-onset AD. Neurology 2014;82:752–760. [DOI] [PMC free article] [PubMed] [Google Scholar]
- 13.Joshi A, Koeppe RA, Fessler JA. Reducing between scanner differences in multi-center PET studies. NeuroImage 2009;46:154–159. [DOI] [PMC free article] [PubMed] [Google Scholar]
- 14.Ashburner J, Friston KJ. Voxel-based morphometry: the methods. NeuroImage 2000;11:805–821. [DOI] [PubMed] [Google Scholar]
- 15.Chetelat G, Desgranges B, Landeau B, et al. Direct voxel-based comparison between grey matter hypometabolism and atrophy in Alzheimer's disease. Brain 2008;131:60–71. [DOI] [PubMed] [Google Scholar]
- 16.Rabasa-Lhoret R, Bastard JP, Jan V, et al. Modified quantitative insulin sensitivity check index is better correlated to hyperinsulinemic glucose clamp than other fasting-based index of insulin sensitivity in different insulin-resistant states. J Clin Endocrinol Metab 2003;88:4917–4923. [DOI] [PubMed] [Google Scholar]
- 17.Sperling RA, Karlawish J, Johnson KA. Preclinical Alzheimer disease: the challenges ahead. Nat Rev Neurol 2013;9:54–58. [DOI] [PMC free article] [PubMed] [Google Scholar]
- 18.Yin F, Yao J, Sancheti H, et al. The perimenopausal aging transition in the female rat brain: decline in bioenergetic systems and synaptic plasticity. Neurobiol Aging 2015;36:2282–2295. [DOI] [PMC free article] [PubMed] [Google Scholar]
- 19.Ding F, Yao J, Rettberg JR, Chen S, Brinton RD. Early decline in glucose transport and metabolism precedes shift to ketogenic system in female aging and Alzheimer's mouse brain: implication for bioenergetic intervention. PLoS One 2013;8:e79977. [DOI] [PMC free article] [PubMed] [Google Scholar]
- 20.Yao J, Irwin R, Chen S, Hamilton R, Cadenas E, Brinton RD. Ovarian hormone loss induces bioenergetic deficits and mitochondrial beta-amyloid. Neurobiol Aging 2012;33:1507–1521. [DOI] [PMC free article] [PubMed] [Google Scholar]
- 21.Rettberg JR, Dang H, Hodis HN, et al. Identifying postmenopausal women at risk for cognitive decline within a healthy cohort using a panel of clinical metabolic indicators: potential for detecting an at-Alzheimer's risk metabolic phenotype. Neurobiol Aging 2016;40:155–163. [DOI] [PMC free article] [PubMed] [Google Scholar]
- 22.Bertram L, Lill CM, Tanzi RE. The genetics of Alzheimer disease: back to the future. Neuron 2010;68:270–281. [DOI] [PubMed] [Google Scholar]
- 23.Ungar L, Altmann A, Greicius MD. Apolipoprotein E, gender, and Alzheimer's disease: an overlooked, but potent and promising interaction. Brain Imaging Behav 2014;8:262–273. [DOI] [PMC free article] [PubMed] [Google Scholar]
- 24.Reiman EM, Chen K, Liu X, et al. Fibrillar amyloid-beta burden in cognitively normal people at 3 levels of genetic risk for Alzheimer's disease. Proc Natl Acad Sci USA 2009;106:6820–6825. [DOI] [PMC free article] [PubMed] [Google Scholar]
- 25.Fleisher A, Grundman M, Jack CR Jr, et al. Sex, apolipoprotein E epsilon 4 status, and hippocampal volume in mild cognitive impairment. Arch Neurol 2005;62:953–957. [DOI] [PubMed] [Google Scholar]
- 26.Damoiseaux JS, Seeley WW, Zhou J, et al. Gender modulates the APOE epsilon4 effect in healthy older adults: convergent evidence from functional brain connectivity and spinal fluid tau levels. J Neurosci 2012;32:8254–8262. [DOI] [PMC free article] [PubMed] [Google Scholar]
- 27.Swerdlow RH, Burns JM, Khan SM. The Alzheimer's disease mitochondrial cascade hypothesis. J Alzheimer Dis 2010;20(suppl 2):S265–S279. [DOI] [PMC free article] [PubMed] [Google Scholar]
- 28.Hogervorst E, Clifford A, Stock J, Xin X, Bandelow S. Exercise to prevent cognitive decline and Alzheimer's disease: for whom, when, what, and (most importantly) how much? J Alzheimer Dis 2012;2:3–8. [Google Scholar]
- 29.Vlassenko AG, Mintun MA, Xiong C, et al. Amyloid-beta plaque growth in cognitively normal adults: longitudinal [11C]Pittsburgh compound B data. Ann Neurol 2011;70:857–861. [DOI] [PMC free article] [PubMed] [Google Scholar]
- 30.Greendale GA, Derby CA, Maki PM. Perimenopause and cognition. Obstet Gynecol Clin North Am 2011;38:519–535. [DOI] [PMC free article] [PubMed] [Google Scholar]
- 31.Rentz DM, Weiss BK, Jacobs EG, et al. Sex differences in episodic memory in early midlife: impact of reproductive aging. Menopause 2017;24:400–408. [DOI] [PMC free article] [PubMed] [Google Scholar]
- 32.Santoro N. The Study of Women's Health Across the Nation (SWAN). Obstet Gynecol Clin North Am 2011;38:xvii–xix. [DOI] [PubMed] [Google Scholar]
- 33.Klein NA, Soules MR. Endocrine changes of the perimenopause. Clin Obstet Gynecol 1998;41:912–920. [DOI] [PubMed] [Google Scholar]
- 34.Rasgon NL, Geist CL, Kenna HA, Wroolie TE, Williams KE, Silverman DH. Prospective randomized trial to assess effects of continuing hormone therapy on cerebral function in postmenopausal women at risk for dementia. PLoS One 2014;9:e89095. [DOI] [PMC free article] [PubMed] [Google Scholar]
- 35.Maki PM, Resnick SM. Longitudinal effects of estrogen replacement therapy on PET cerebral blood flow and cognition. Neurobiol Aging 2000;21:373–383. [DOI] [PubMed] [Google Scholar]
- 36.Hodis HN, Mack WJ, Shoupe D, et al. Methods and baseline cardiovascular data from the Early versus Late Intervention Trial with Estradiol testing the menopausal hormone timing hypothesis. Menopause 2015;22:391–401. [DOI] [PMC free article] [PubMed] [Google Scholar]
- 37.Rasgon NL, Kenna HA, Wroolie TE, et al. Insulin resistance and hippocampal volume in women at risk for Alzheimer's disease. Neurobiol Aging 2011;32:1942–1948. [DOI] [PMC free article] [PubMed] [Google Scholar]
- 38.Silverman DH, Geist CL, Kenna HA, et al. Differences in regional brain metabolism associated with specific formulations of hormone therapy in postmenopausal women at risk for AD. Psychoneuroendocrinology 2011;36:502–513. [DOI] [PMC free article] [PubMed] [Google Scholar]
- 39.Morris JC, Roe CM, Xiong C, et al. APOE predicts amyloid-beta but not tau Alzheimer pathology in cognitively normal aging. Ann Neurol 2010;67:122–131. [DOI] [PMC free article] [PubMed] [Google Scholar]
- 40.Willette AA, Johnson SC, Birdsill AC, et al. Insulin resistance predicts brain amyloid deposition in late middle-aged adults. Alzheimers Dement 2015;11:504–510. [DOI] [PMC free article] [PubMed] [Google Scholar]
Associated Data
This section collects any data citations, data availability statements, or supplementary materials included in this article.