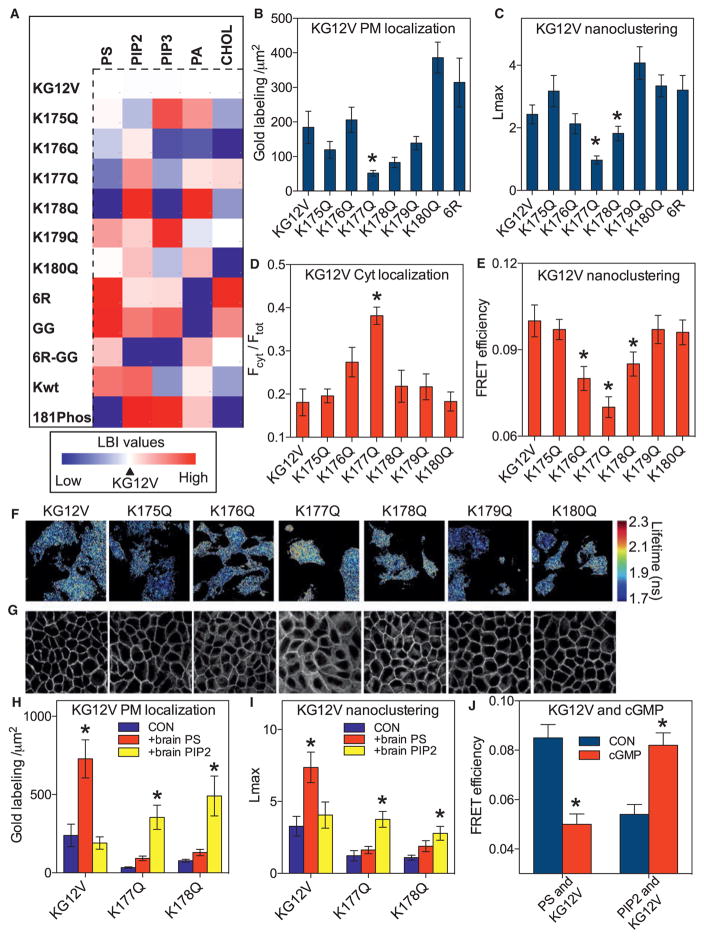
Figure 2. The K-Ras Membrane Anchor Is a Combinatorial Code for Lipid Sorting.
(A) A heatmap was constructed with EM-derived mean LBI values (n ≥15 for each condition) to quantify co-clustering between GFP-lipid-binding domains and RFP-K-RasG12V mutants. The mutants include K → Q point mutations at each lysine in the PBD (K175-K180), replacement of all lysines with arginines (6R), replacement of farnesyl with geranylgeranyl (GG). K-RasG12V phosphorylated at Ser181 (S181-Phos) and wild-type K-Ras (Kwt) were also evaluated. For each lipid, the LBI value for K-RasG12V and the cognate lipid probe was assigned as midpoint (marked in white), with lower and higher values marked in blue and red, respectively. The heatmap thus shows positive or negative deviations from the lipid content of K-RasG12V nanoclusters. For raw LBI values see Figures S3A–S3E. The LactC2 domain did not compete for PtdSer because the PM binding and nanoclustering of GFP-K-RasG12V and each PBD mutant was unaffected by RFP-LactC2 expression (Figures S3K–S3N). Co-expression of the LactC2 domain also had no effect on K-RasG12V signaling (Figures S3L and S3M).
(B) PM sheets from BHK cells expressing each GFP-K-RasG12V PBD mutant were labeled with anti-GFP-4.5 nm gold and imaged by EM. Localization to the inner PM was quantified as the number of gold particles per 1 μm2 and is shown as mean ± SEM (n ≥15 for each condition). Significant differences from control were evaluated by one-way ANOVA (*p < 0.05).
(C) The gold point patterns from (B) were analyzed for the extent of GFP-K-RasG12V nanoclustering as in Figure 1C. The results show mean Lmax values ± SEM (n ≥ 15 for each condition). Significant differences between control and each mutant were evaluated in bootstrap tests (*p < 0.05).
(D) MDCK cells stably expressing each GFP-K-RasG12V PBD mutant were imaged by confocal microscopy. Fractional cytosolic mislocalization (mean ± SEM of >15 images) was estimated with a custom ImageJ algorithm. Statistical significance was evaluated by one-way ANOVA (*p < 0.05).
(E) BHK cells co-expressing GFP-K-RasG12V and RFP-K-RasG12V PBD mutants were imaged in a FLIM microscope to measure GFP fluorescence lifetime and mean FRET efficiency ± SEM (n ≥ 50 cells for each condition) calculated. Significant differences were evaluated by one-way ANOVA (*p < 0.05).
(F) Representative images of cells from (E) showing GFP fluorescence lifetime values.
(G) Representative confocal images from (D).
(H) Lipid add-back experiments using brain PtdSer or brain PIP2 were carried out as in Figure 1 in BHK cells expressing GFP-K-RasG12V, GFP-K-RasG12V,K177Q, or GFP-K-RasG12V,K178Q (not treated with fendiline). Inner PM leaflet localization was quantified as the number of gold particles per 1 μm2 and is shown as mean ± SEM (n ≥ 15 for each condition). Significant differences between cells with and without lipid add-back were evaluated by one-way ANOVA (*p < 0.05).
(I) Gold point patterns from (H) were analyzed for the extent of nanoclustering. The results show mean Lmax values ± SEM (n ≥ 15 for each condition). Bootstrap tests were used to evaluate statistical significance of differences induced by lipid supplementation (*p < 0.001).
(J) Co-localization between PtdSer (GFP-LactC2) or PIP2 (GFP-PH-PLCδ) and RFP-K-RasG12V was tested in a FLIM experiment as in (A) before and after treatment with 500 μM cGMP for 15 min to activate PKG and phosphorylate S181 in the PBD.
See also Figure S3.

