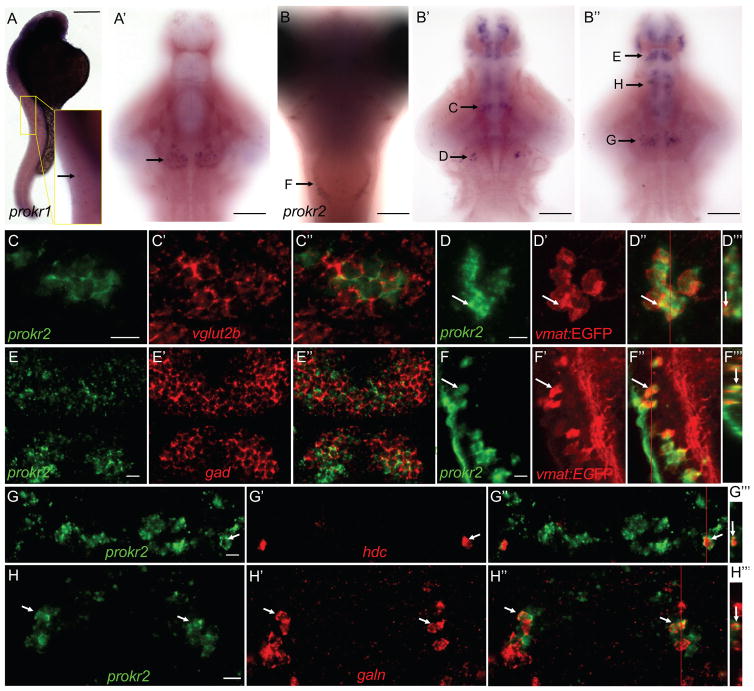
Figure 7. Expression patterns of prokr1 and prokr2 in larval zebrafish.
prokr1 is expressed in a row of cells in the spinal cord at 24 hpf (A, enlarged in inset), and in a bilateral cluster of cells in the ventral hypothalamus at 5 dpf (arrow in A′). Most of the embryo in (A) is overstained in order to see the weak prokr1-expressing cells in the spinal cord. prokr2 is expressed in discrete clusters of cells in the hindbrain (B), midbrain (B′, B″) and forebrain (B′, B″) at 5 dpf. Arrows indicate domains of prokr2-expressing cells that are shown at higher magnification in the indicated panels. Side (A), ventral (A′, B′, B″) and dorsal (B) views are shown, with rostral at top. (B′) and (B″) show dorsal and ventral optical sections, respectively. prokr2-expressing neurons express vesicular glutamate transporter 2b (vglut2b) in the thalamic region (C) and glutamate decarboxylase (gad65 and gad67 probes combined) in the forebrain (E). prokr2-expressing neurons in the locus coeruleus (D) and medulla oblongata (F) express vmat:EGFP, which labels noradrenergic neurons. prokr2 is expressed in a subset of hypothalamic neurons that express hdc (G) and galn (H). Images show 0.46 (C, E), 10 (D, F), 2.3 (G) and 2.9 (H) μm thick confocal projections. Ventral views are shown in (C–H, C′-H′, C″-H″). (D‴, F‴, G‴, H‴) show orthogonal views of (D″, F″, G″, H″) at positions indicated by red lines. Arrows in (D, F, G, H) indicate representative neurons. In (C–H), samples were fixed at 5 dpf and are oriented with rostral at top. Scale bar: (A, B) 100 μm, (C–H) 10 μm. See also Figures S6 and S7.

