

Abstract
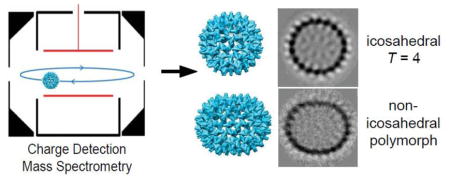
Woodchuck hepatitis virus (WHV) is prone to aberrant assembly in vitro, and can form a broad distribution of oversized particles. Characterizing aberrant assembly products is challenging because they are both large and heterogeneous. In this work, charge detection mass spectrometry (CDMS) is used to measure the distribution of WHV assembly products. CDMS is a single particle technique where the masses of individual ions are determined from simultaneous measurement of each ion’s charge and m/z ratio. Under relatively aggressive assembly-promoting conditions, roughly half of the WHV assembly products are T=4 capsids composed of exactly 120 dimers while the other half are a broad distribution of larger species that extends to beyond 210 dimers. There are prominent peaks at around 132 dimers and at 150 dimers. In part, the 150 dimer complex can be attributed to elongating a T=4 capsid along its five-fold axis by adding a ring of hexamers. However, most of the other features cannot be explained by existing models for hexameric defects. Cryo-electron microscopy provides evidence of elongated capsids. However, image analysis reveals that many of them are not closed, but have “spiral-like” morphologies. The CDMS data indicates that oversized capsids have a preference for growth by addition of 3 or 4 dimers, probably by completion of hexameric vertices.
Keywords: capsid assembly, self-assembly, woodchuck hepatitis virus, mass spectrometry
Graphical Abstract
Introduction
For many viruses, the assembly of hundreds of identical protein subunits into highly-ordered icosahedral capsids occurs with remarkable fidelity and efficiency. However, under some conditions the assembly process can produce distributions of irregular particles and polymorphs in addition to the expected icosahedral particles.1,2,3 The factors that control the formation of polymorphs are not well understood. Characterization of the non-icosahedral particles is challenging because they are often large and heterogeneous, with most species present in low abundance.
A firm understanding of the thermodynamic, kinetic, and geometric factors driving capsid assembly is key to optimizing and manipulating self-assembly for biomedical and nanomaterials applications. Viral self-assembly has been studied extensively by experiment, simulation, and theory.4,5 Interest in this topic stems in part from the desire to direct capsid self-assembly, either to prevent the formation of non-icosahedral structures or to generate specific structures when desired.
Several groups have used simulations to provide insight into non-icosahedral particles formed during assembly. Nguyen and coworkers6,7 have performed coarse-grained molecular dynamics simulations where some capsids were oversized because of defects resulting from the addition of hexamers. In biology, prolate capsids8,9 such as bacteriophage T410 and rice tungro bacilliform virus11 are elongated along a fivefold axis and extended by discrete steps of hexamers. Alfalfa mosaic virus is a T=1 bacilliform whose length is directly proportional to the length of packaged RNA.12,13 Capsids can also be extended along threefold and twofold axes by discrete steps of hexamers.14,15
Experimentally, irregular non-icosahedral structures most often arise from cases where the capsid is frustrated from reaching a thermodynamic minimum. This may be the case for HIV capsids that appear irregular and incomplete16,17,18 In bacteriophage P22, spiral structures that fail to close arise from assembly without scaffold protein.19,20 In hepatitis B virus (HBV), very large amorphous complexes arise when a defect is incorporated at the subunit-subunit interface by capsid-directed antivirals.21
The large size and heterogeneous nature of the non-icosahedral capsids makes them difficult to characterize experimentally. Conventional mass spectrometry methods, where only the m/z ratio is measured, are stymied by overlapping charge state distributions. In this work we used charge detection mass spectrometry (CDMS)22,23,24,25,26,27,28 to measure the mass distribution of the assembly products of woodchuck hepatitis virus (WHV). CDMS is a single particle technique where the masses of individual ions are determined from simultaneous measurements of the m/z and charge of each ion. It was first used in a primitive form in 1960 to determine the masses of micron-sized metal particles for hypervelocity impact studies.29 In the 1990’s Fuerstenau and Benner22,23 applied the method to electrosprayed DNA and virus ions. We have recently introduced a number of improvements that have substantially increased the accuracy and resolution, and lowered the limit of detection.25,26,27 CDMS has been used to detect intermediates in the assembly of HBV capsids.30
WHV and HBV are closely related hepadnaviruses. These are enveloped DNA viruses with an icosahedral core.31 In vivo, the cores assemble on a viral RNA-reverse transcriptase complex; reverse transcription takes place within the core while it resides in the host cytoplasm.32 The predominant form of the core has T=4 symmetry and is composed of 120 capsid protein dimers. WHV is a close relative of HBV.33 The assembly domains of WHV and HBV capsid proteins, the first 149 residues, (wCp149 and hCp149, respectively) have 65% sequence identity.34,35 In vitro assembly of HBV has been extensively studied, largely with the 149 residue assembly domain (Cp149).36 Cp149 assembly is based on a weak interaction energy of −3 to −4 kcal/mol; assembly is more aggressive at higher temperature and higher ionic strength.36 Assembly is supported because each dimer is tetravalent, resulting in a pseudo critical concentration in the low micromolar range. Inter-subunit association is entropically driven by burial of hydrophobic surface with relatively poor complementarity. Indeed, filling gaps in the surface with mutations or small molecules proportionately strengthens the association energy.37,38 In vitro assembly of HBV shows high fidelity though incomplete particles can be trapped.30 By comparison, the WHV association energy is 1 kcal/mol stronger under similar assembly conditions, it has a strongly positive heat capacity (possibly related to the fluctuating body temperature of its woodchuck host), and has a tendency to form particles with atypical geometry.39 It is not clear whether geometric defects are due to the permissive geometry of the subunits or the failure of assembly errors to self-correct. Here we use Woodchuck hepatitis virus (WHV) to investigate the stepwise nature of assembly and miss-assembly, taking advantage of the single molecule sensitivity of CDMS.
Results
The CDMS mass spectrum of the wCp149 assembly products (Figure 1A) shows a peak at around 4.15 MDa close to the mass expected for the T=4 capsid (4.1064 MDa, based on the sequence mass). There is no peak at the mass expected for the T=3 (around 3 MDa). However, there is a distribution that extends to higher masses than the T=4 peak, with broad peaks at around 4.6 MDa and 5.2 MDa. The integrated intensities of the high mass distribution and the T=4 peak are roughly the same. The peak for a single species is expected to be Gaussian with a width determined by the uncertainties in the m/z and charge measurements. The nature and magnitudes of these uncertainties are described in the Methods section below. The dashed black line in Figure 1A shows the peak expected for a single species. Clearly the peak assigned to the T=4 capsid is composed of more than one species.
Figure 1.

A) CDMS mass spectrum for WHV assembly products. The bin widths are 20 kDa. The dashed black line shows the peak width expected for a single homogeneous species. B) Scatter plot of charge against mass for WHV assembly products. Each point represents an individual ion measured by CDMS. The two charge components (see text) are separated by the orange dashed-dotted line. C) Mass distributions obtained for the two charge components revealed in the scatter plot. The blue spectrum is for ions falling above the dashed-dotted line (the high charge component) and the red spectrum is for ions falling below. The bin widths are 20 kDa. The vertical dashed lines are guides.
CDMS is a single particle technique, so the charge and mass of individual WHV ions can be correlated, allowing a dissection of the mass spectrum. Figure 1B is a scatter plot of charge against mass where each point represents an individual ion. The plot shows the three main groups of ions at approximately 4.15, 4.6, and 5.2 MDa. Each of the three groups is comprised of two distinct charge clusters. For example, the group at 4.15 MDa has a cluster of ions with an average charge of approximately 167 elementary charges (e) and a second cluster with an average charge of approximately 187 e. The high and low charge clusters are centered around slightly different masses. The two clusters near 4.15 MDa have masses of 4.11 and 4.19 MDa. In this data set, the lower charged clusters appear to be roughly 80 kDa more massive than their more highly-charged counterparts. We have recorded many data sets similar to that shown in Figure 1 and the separation between the low charged and the high charged clusters varies. In most cases the separation falls between 80 and 100 kDa, but in some cases it is larger. The mass of the higher charge (lower mass) component remains relatively constant and it is the mass of the lower charge (higher mass) component that moves around.
The two charge components can be separated by defining a line that passes between them (the orange dashed-dotted line in Figure 1B). The ions that fall above the line are binned in mass and plotted in blue in Figure 1C; the ions that fall below the line are plotted in red. The blue peak at around 4.11 MDa is assigned to the T=4 capsid. This peak is narrow enough to consist predominantly of one species, though it does have a high-mass tail. In addition to the main peak at around 4.11 MDa, there is a broad distribution of higher mass ions with peaks centered around 4.6 MDa and 5.2 MDa. These peaks are narrower than in the composite spectrum (Figure 1A) but they are still broader than expected for a single species and do not have baseline separation. The low charge mass spectrum (red) almost exactly recapitulates the high charge component and if it is shifted down by ~80 kDa, it overlaps the blue spectrum. The peaks in the red spectrum are slightly broader than in the blue.
To obtain quantitative information about the size of the assembly products, the mass histogram for the high charge component was fit with a series of Gaussian functions. Because the m/z and charge uncertainty are well characterized (see Methods section), we can use the peak widths to determine whether or not a peak consists of more than one species. The centers of Gaussian functions were fixed to the masses of integral numbers of dimers, and the widths were set by the experimental mass resolution (which is determined by the uncertainty in the m/z and charge measurements). The amplitudes of the Gaussians were optimized by Monte Carlo sampling to produce the best fit to the measured spectrum using a least-squares criterion. The results of this analysis are shown in Figure 2. The black points are the experimental data, the blue bars represent the centers and intensities of the Gaussians, and the red trace is the fit of the Gaussians to the experimental data. The main peak can be fit by a single component of 120 dimers, with a small shoulder from species with 123 and 124 dimers. The second peak centered around 4.6 MDa is broad. In the simulations it can be fit by contributions from species with between 130 and 137 dimers. The third peak at around 5.2 MDa, is mainly due to a species with 150 dimers. There is a high mass tail on this peak with prominent contributions from species with 154, 158, 162, and 165 dimers. The high mass tail extends past 210 dimers. In addition to the results shown in Figure 2 we have analyzed several other data sets. The main features described above were reproduced (see Supplementary Figures 1 and 2).
Figure 2.
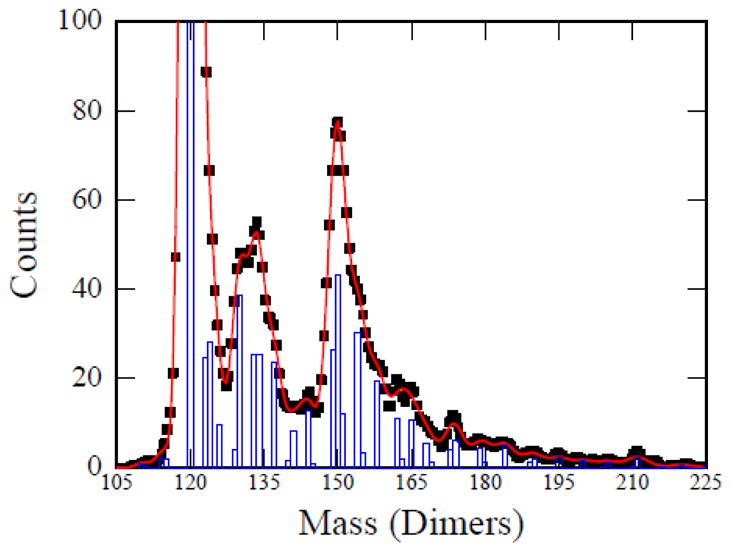
Analysis of the high charge component (blue) mass histogram from Figure 1c. The points are the measured histogram and the red curve is a least squares fit to the points using the procedure described in the text. Each integral number of WHV dimers is represented by a Gaussian with a width determined by the mass resolution. The blue bars show the intensities of the Gaussians that provide the best fit to the experimental data. The mass scale is plotted as a function of the number of WHV dimers.
To obtain more information about the oversized capsid structures, we performed cryo-electron microscopy (cryo-EM) and image analysis. Cryo-micrographs of WHV capsids show that the capsids indeed have different conformations (Figure 3A): spherical icosahedral particles (black arrows) and elongated elliptical particles (white arrows). We did not observe any T=3 particles. A reference-free 2-D image analysis of the spherical particles shows a continuous protein layer with spikes protruding from the capsid surface (Figure 3B, 1). On the other hand, the elongated particles (Figure 3B, 2–4) are bounded by regions of strong, continuous density, similar to the spherical particles, mixed with regions where the capsid surface appears to be smeared (Figure 3B, red dashed line). If all the particles within a class had the same elliptical morphology, we would expect to see a homogenous density distribution for the capsid surface. The weak, smeared density suggests that there are still some differences between the particles within each class average. Further classification of the particles in the most elongated group (Figure 3B, 4) shows that many of these particles are not closed (Figure 3C). One edge of the capsid overlaps the other edge, resulting in a spiral-like organization (Figure 3C, red arrows).
Figure 3.

Cryo-EM image analysis for WHV particles. A) A representative cryo-EM image of WHV assembly products. Note that heterogeneous particle populations were observed. The black arrows indicate icosahedral particles and the white arrows indicate elliptical particles. B) Selected reference-free 2-D class averages of (1) icosahedral and (2–4) elliptical particles. C) Further classification of the particles from B4. The red arrows show the thick capsid shell, where one layer overlaps the other.
Due to the low number of particles and the heterogeneity within class averages of elongated particles, we were unable to compute a reliable asymmetric 3-D reconstruction for the elongated particles. However, with the spherical particles we calculated a reconstruction of reassembled WHV capsids, with icosahedral symmetry, to 6.9 Å resolution (Supplementary Figure 3).40 The morphology of the reassembled WHV capsid appeared to be virtually identical to WHV T=4 capsids purified from E. coli.39 There is no evidence for a defect in the wCp149 capsid protein that leads it, in some cases, to form aberrant particles.
Discussion
WHV and HBV are similar viruses in terms of their biology, sequence, and structure.33 Yet, wCp149 shows a greater diversity of assembly products than hCp149. Characterizing these products is a necessary first step to learning how WHV assembly is regulated in vivo and how to deliberately regulate their quaternary structure in vitro. CDMS and cryo-EM provide a description of the assembly products. Because of the complexity of viruses, their assembly reactions, and the novelty of CDMS we necessarily must develop new approaches to interpret these data.
The CDMS mass histogram can be resolved into high charge and low charge contributions, where the low charge histogram is offset from the high charge by 80–100 kDa. The offset between the low charge and high charge histograms shows some variability. The masses of the high charge component are reproducible, while the masses of the low charge component vary from experiment to experiment. Thus we attribute the peak at 4.11 MDa in the high charge histogram (blue trace in Figure 1c) to empty T=4 capsids. The fact that the masses of the low charge, high mass component fluctuate indicates that they do not result from adduct formation by a single high mass impurity.
Large ions like those studied here (i.e. capsids) are believed to be generated from electrospray droplets by a charge residue mechanism,41,42 where the charged droplets evaporate away and leave the ion with a charge close to the Rayleigh limit43 for a water droplet of the same diameter as the ion. Ions with a larger radius will obtain a larger average charge. Thus the ions that make up the low charge, high mass component should have a smaller average radius than the high charge, low mass component. Finally, we mention that we have observed similar behavior (i.e., high charge, low mass and low charge, high mass components) in the charge versus mass plot for other empty capsids. Thus this behavior is not unique to WHV and must result from a common phenomenon.
We suggest that the low charge, high mass components are due to compaction of some of the WHV ions as they are dehydrated during the electrospray process.44,45 For WHV, the putative compact capsids have approximately 20 fewer charges than the more highly-charged component, which corresponds to a difference in diameter of a few nm, assuming that both capsids are charged to the same percentage of the Rayleigh limit. Virus capsids lacking a genome, like WHV in this study, are more susceptible to compaction since the genome may play a structural role46 and even exert internal pressure on the capsid wall.47 Salt and other species from solution that are inside the virus capsid as it transitions into the gas phase will find it easier to exit the uncompacted viruses than the compacted. Thus the compacted virus capsids are more likely to trap salt and other species in solution inside their cavities; this may explain the slightly larger mass observed for the low-charged (more compact) ions. In an m/z spectrum such mass heterogeneity would result in loss of m/z resolution but does not resist analysis by CDMS. Since we are concerned with masses of empty WHV capsids we focus on the ions in the blue spectrum of Figure 1c.
Focusing on the species seen in the low mass, high charge spectrum (Figure 2), the peak at 4.11 MDa (which consists mostly of one species) is attributed to the T=4 capsid. This is consistent with the cryo-EM results which showed an abundance of spherical icosahedral particles (Figure 3 and Supplementary Figure 1). There are two other large peaks in the mass distributions; one centered around 132 and the other at 150 dimers. The species with 150 dimers must be a particularly stable oversized particle since it has a greater abundance than all but the T=4 capsids (it is roughly 10 % of the intensity of the T=4 peak). The data in Figure 2 was collected the day after the assembly reaction was initiated. Supplementary Figure 1 shows the spectrum measured (with the same sample) 26 days later. The spectra are almost identical. There are small differences in the fits to the data and the peak at 150 dimers appears to be slightly more prominent in the spectrum measured later (supplementary Figure 1). These result show that the larger particles are stable and persist in solution for an extended time. Supplementary Figure 2 shows the spectrum measured for assembly under different (though still relatively aggressive) conditions. This spectrum is also very similar to the spectrum in Figure 2, though the abundances of species above the 150 dimer peak are somewhat reduced.
Several groups have developed models for enlarging capsids. Nguyen et al,6 based on coarse-grained molecular dynamics, suggested that under conditions where defects are likely, consistent with our assembly conditions, complexes would enlarge by addition of two or more hexamers. For a T=4 capsid their model predicts complexes with dimer counts of 144, 156, 168, 180, and so on, most of which are not found in our data. This model also does not predict the 150-mer. Moody8,9 suggested elongation could be accomplished by adding rings of hexamers to the waist of the icosahedron. Luque and Reguera14 generalized Moody’s rules to elongation along the two-fold and three-fold axes of an icosahedron. Moody’s model for elongation of the T=4 capsid along the 5-fold axis can account for the prominent species with 150 dimers (see Figure 4). This prolate structure is generated by adding a ring of ten hexamers and rotating one of the icosahedral endcaps by 18° relative to its orientation in the T=4 capsid. Monte Carlo simulations suggest that T=4 capsids extended by rings of ten hexamers are particularly stable.48 However, there is little correspondence between predictions for regular capsids and our observed heterogeneous series of species (Figure 2). Indeed none of these predictions are consistent with spirals (Figure 3).
Figure 4.
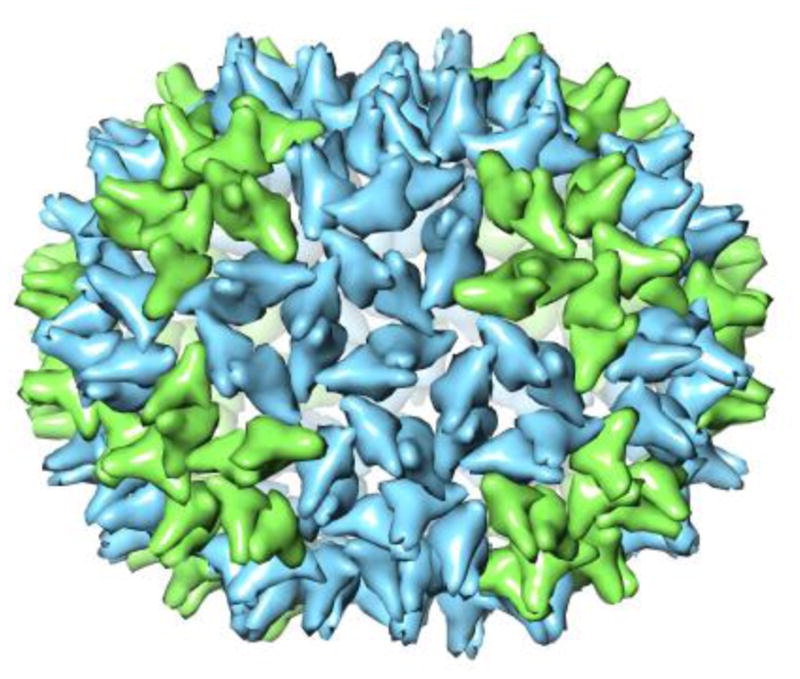
Model of the structure for the 150-dimer species obtained by elongating the T=4 capsid along the five-fold axis by adding a ring of hexamers. Two classes of dimers are shown: green dimers extend from pentamers to hexamers, and the blue dimers extend between two hexamers.
A closer inspection of Figure 2 (and Supplementary Figures 2 and 3) reveals evidence for preferential growth of the open and spiral particles through the addition of a repeat of dimer subunits. The blue histogram plots in the figures show the intensities, as a function of the number of dimers that give the best fit to the experimental data when the mass resolution is taken into account. For Figure 2, there is a sequence of peaks in the blue histogram plot starting at 150 dimers and separated by units of 4 dimers (i.e., 150, 154, 158, and 162). Above 162 dimers, the peaks are separated by units of about three dimers. Sequences of peaks separated by units of three and four subunits are also evident in Figure 2 for species with between 120 and 150 dimers. To further test these observations we performed an autocorrelation analysis of the results in Figure 2. The results of this analysis are presented in Supplementary Figure 4. They confirm the preference for addition of three or four subunits. Further inspection of the results shown in Supplementary Figures 2 and 3 further support this conclusion. Although the results of the individual experiments are not identical, they all show a preference for addition of three or four subunits.
The observation that the species with 150 dimers appears to be part of a growth sequence occurring through the sequential addition of four dimer subunits suggests that some of the 150 dimer species are incomplete (i.e., not closed) capsids. This suggestion is consistent with the wide variety of oval structures seen in the cryo-EM class averages (Figure 3C).
Comparison of trapped intermediates in the assembly of HBV and WHV capsids is enlightening. A variety of nearly complete HBV Cp149 capsids can be trapped, most of which can be assigned to local minima in the assembly path – complexes where the hole in the capsid is lined by dimers that make either three or four interdimer contacts.30 Larger HBV species are relatively rare. When HBV assembly is poisoned by small molecules that drive assembly and lead to large aberrant structures, the complexes are dominated by formation of a hexagonal sheet.37,49 In contrast to HBV, wCp149 assembly frequently forms complexes larger than a T=4 capsid. The closed 150-dimer structure is likely to incorporate an extra band of hexamers separating two T=4 caps (Figure 4). Other oversize wCp149 structures are not closed, are extremely stable, and appear to grow in steps of three or four subunits. The basis for growth in steps of three to four dimers makes geometric sense when one considers the dimeric nature of subunits. The edge of a growing polymer will have numerous available sites but can only be extended to the next metastable state by completion of a hexamer, this is usually achieved by the addition of at least two dimers. If, due to poor geometry of interaction or disclinations buried in the polymer, the edges of the growing wCp149 polymer do not align, then we can expect spirals to form. These results suggest a stepwise assembly path for in vitro assembly based on completion of a sequence of metastable intermediates. This is a concept that we are now testing computationally and experimentally.
Materials and Methods
WHV core protein samples
WHV core protein wCp149 was expressed and purified, as previously described.39 wCp149 was assembled under relatively aggressive conditions to enrich the fraction of non-icosahedral particles under conditions that also led to virus-like T=4 capsids. Assembly of 40 μM wCp149 dimer in 10 mM HEPES pH 7.5 was induced by addition of NaCl to 100 mM final concentration. The resulting solution was equilibrated for 48 h at room temperature before dialysis into 100 mM NH4OAc. Samples were passed through a 0.2 μm filter before mass analysis.
Charge Detection Mass Spectrometry
Mass spectra were measured using a home-built charge detection mass spectrometer that is described in detail elsewhere.25,26,27,28 In brief, ions are produced with a nanoelectrospray source (Advion Biosciences, Ithaca, NY, USA) and introduced into the mass spectrometer through a heated, stainless-steel capillary. The ions are separated from the background gas by three differentially-pumped regions containing an RF ion funnel, an RF hexapole, and an RF quadrupole. A DC offset on the hexapole sets the nominal ion kinetic energy to 100 eV/charge. The final differentially-pumped region contains a dual hemispherical deflection analyzer (HDA) and a cylindrical charge detector centered between the end caps of an electrostatic ion trap. The dual HDA selects a narrow band of ion kinetic energies and focuses those ions into the trap. As a trapped ion oscillates back and forth through the charge detector, a periodic charge is induced. The detector is connected to a cryogenically-cooled JFET (2SK152) and the induced charge is amplified with a charge-sensitive pre-amplifier (Amptek A250). The signal is digitized and stored for offline analysis by a Fortran program using fast Fourier transforms (FFTs). The oscillation frequency is related to the m/z and the magnitude of the fundamental is proportional to the charge. Multiple ion trapping events are discarded by the data analysis program. Multiplying m/z and z for each ion yields m. The m values can be binned to form a mass histogram. Ions trapped for less than the full trapping period (94 ms) and multiple ion trapping events are discarded.
The mass resolution depends on the uncertainties in the m/z and charge measurements. In the case of the charge, the uncertainty is well characterized. 27,28 It is proportional to one over the square root of the trapping time. It also depends on the ion’s oscillation frequency in the trap because the 1/f noise increases as the oscillation frequency decreases. With the 94 ms trapping time employed here, the charge RMSD is around 1.2–1.3 e for the WHV T=4 peak, and the relative RMSD (charge RMSD/charge) is around 0.0064–0.0071. The uncertainty in the m/z measurement is mainly determined by the kinetic energy distribution of the trapped ions. The distribution is around 1 eV FWHM which leads to a relative m/z RMSD of around 0.0076. Combining the relative RMSDs for the charge and m/z yields a relative RMSD for the mass of around 0.00102 for the WHV T=4 peak. This RMSD was used to generate the expected Gaussian peak shape shown in Figure 1A as the black dashed line.
The accuracy of the mass measurement depends on the accuracy of the m/z and charge measurements. The relationship between the average oscillation frequency and the m/z is
where C is a constant determined from Simion50 simulations of ion trajectories in the trap, and f is the frequency. C depends on the trap geometry, the voltages on the end caps, and the ion kinetic energy. The charge is determined from the magnitude of the fundamental in the FFT. The relationship between these quantities is determined by loading simulated signals into a function generator and applying them through a known capacitance into the input of the JFET. This procedure must be performed with relatively large charges, typically between 2,000 and 10,000 e. However, measurements for light ions where the charge states can be resolved in the m/z spectrum show that the relationship between the charge and the magnitude of the FFT remains close to linear all the way down to a charge of 7 e.28 Experience has taught us that the measured masses are systematically overestimated by a few percent and so we apply a correction to the measured masses to account for this overestimate. The most likely source of this overestimate is the m/z calibration which is based on simulations rather than measurement. The center masses of the WHV high charge T=4 peak measured over a period of several months showed an RMSD of 13 kDa. Thus the measured masses are highly reproducible.
Electron Microscopy
Cryo-EM specimens were prepared by adding 4-μl of WHV sample on a glow-discharged holey carbon-coated grid (Quantifoil, R2/2) for 25 s and blotted with filter papers from both sides for 4 s using an FEI Vitrobot™. Subsequently the grid was plunged into a liquid ethane bath cooled by liquid nitrogen. The frozen specimen was quickly transferred into a Gatan 626DH cryo-holder (Gatan Inc., Oxford, UK) and examined using a 300-kV JEM-3200FS transmission electron microscope (JEOL Ltd., Japan) operated under low dose conditions (≤ 20 e−/Å2). Images were recorded at a nominal magnification of 80,000x on a Gatan UltraScan™ 4k x 4k CCD camera (pixel size is equal to 1.48 Å) with defocus levels ranging from 0.92 to 4.73 μm. Individual particles were semi-automatically extracted from the digital images using the e2boxer.py program. In total 9290 spherical (icosahedral) particles and 2392 elongated particles were extracted. We did not select the particles that were clearly broken or particles that had a minor axis much greater than the diameter of the T=4 capsid (36 nm). For 2-D reference-free classification, both datasets were processed separately using CL2D from the XMIPP software package.
Supplementary Material
Highlights.
Mass spectrometry characterizes non-icosahedral assembly products of WHV
A 150-dimer capsid is the most abundant non-icosahedral polymorph
Cryo-EM provides evidence for ellipsoidal and spiral-like morphologies
Most features cannot be explained by existing models for hexameric defects
Acknowledgments
We gratefully acknowledge the support of the NSF through award number 0832651 to MFJ and the NIH through award number R56-AI077688 to AZ. Electron microscopy was performed in the cryo-TEM facility at IU.
Abbreviations
- WHV
woodchuck hepatitis virus
- HBV
hepatitis B virus
- CDMS
charge detection mass spectrometry
- m/z
mass-to-charge ratio
- cryo-EM
cryo-electron microscopy
- T
triangulation number
- wCp149
woodchuck hepatitis virus capsid protein
- hCp149
human hepatitis B virus capsid protein
- MDa
megadalton
- kDa
kilodalton
Footnotes
Publisher's Disclaimer: This is a PDF file of an unedited manuscript that has been accepted for publication. As a service to our customers we are providing this early version of the manuscript. The manuscript will undergo copyediting, typesetting, and review of the resulting proof before it is published in its final citable form. Please note that during the production process errors may be discovered which could affect the content, and all legal disclaimers that apply to the journal pertain.
References
- 1.Bancroft JB, Bracker CE, Wagner GW. Structures Derived From Cowpea Chlorotic Mottle and Brome Mosaic Virus Protein. Virology. 1969;38:324–335. doi: 10.1016/0042-6822(69)90374-2. [DOI] [PubMed] [Google Scholar]
- 2.Cusack S, Oostergetel GT, Krijgsman PCJ, Mellema JE, Klug A. Structure of the Top a-t Component of Alfalfa Mosaic Virus. A Non-Icosahedral Virion. J Mol Biol. 1983;171:139–155. doi: 10.1016/s0022-2836(83)80350-7. [DOI] [PubMed] [Google Scholar]
- 3.Dong XF, Natarajan P, Tihova M, Johnson JE, Schneemann A. Particle Polymorphism Caused by Deletion of a Peptide Molecular Switch in a Quasiequivalent Icosahedral Virus. J Virol. 1998;72:6024–6033. doi: 10.1128/jvi.72.7.6024-6033.1998. [DOI] [PMC free article] [PubMed] [Google Scholar]
- 4.Perlmutter JD, Hagan MF. Mechanisms of Virus Assembly. Annu Rev Phys Chem. 2015;66 doi: 10.1146/annurev-physchem-040214-121637. (published online). http://dx.doi.org/10.1146/annurev-physchem-040214-121637. [DOI] [PMC free article] [PubMed] [Google Scholar]
- 5.Zlotnick A, Mukhopadhyay S. Virus Assembly Allostery and Antivirals. Trends Microbiol. 2011;19:14–23. doi: 10.1016/j.tim.2010.11.003. [DOI] [PMC free article] [PubMed] [Google Scholar]
- 6.Nguyen HD, Brooks CL. Generalized Structural Polymorphism in Self-Assembled Viral Particles. Nano Letts. 2008;8:4574–4581. doi: 10.1021/nl802828v. [DOI] [PMC free article] [PubMed] [Google Scholar]
- 7.Nguyen HD, Reddy VS, Brooks CL. Invariant Polymorphism in Virus Capsid Assembly. J Am Chem Soc. 2009;131:2606–2614. doi: 10.1021/ja807730x. [DOI] [PMC free article] [PubMed] [Google Scholar]
- 8.Moody MF. The Shape of the T-Even Bacteriophage Head. Virology. 1965;26:567–576. doi: 10.1016/0042-6822(65)90319-3. [DOI] [PubMed] [Google Scholar]
- 9.Moody MF. Geometry of Phage Head Construction. J Mol Biol. 1999;293:401–433. doi: 10.1006/jmbi.1999.3011. [DOI] [PubMed] [Google Scholar]
- 10.Fokine A, Chipman PR, Leiman PG, Mesyanzhinov VV, Rao VB, Rossmann MG. Molecular Architecture of the Prolate Head of Bacteriophage T4. Proc Natl Acad Sci US A. 2004;101:6003–6008. doi: 10.1073/pnas.0400444101. [DOI] [PMC free article] [PubMed] [Google Scholar]
- 11.Hull R. Molecular Biology of Rice Tungro Viruses. Annu Rev Phytopathol. 1996;34:275–297. doi: 10.1146/annurev.phyto.34.1.275. [DOI] [PubMed] [Google Scholar]
- 12.Hull R, Hills GJ, Markham R. Studies on Alfalfa Mosaic Virus. II. The Structure of the Virus Components. Virology. 1969;37:416–428. doi: 10.1016/0042-6822(69)90225-6. [DOI] [PubMed] [Google Scholar]
- 13.Heijtink RA, Houwing CJ, Jaspars EMJ. Molecular Weights of Particles and RNAs of Alfalfa Mosaic Virus. Number of Subunits in Protein Capsids. Biochemistry. 1977;16:4684–4693. doi: 10.1021/bi00640a024. [DOI] [PubMed] [Google Scholar]
- 14.Luque A, Reguera D. The Structure of Elongated Viral Capsids. Biophys J. 2010;98:2993–3003. doi: 10.1016/j.bpj.2010.02.051. [DOI] [PMC free article] [PubMed] [Google Scholar]
- 15.Burns K, Mukherjee S, Keef T, Johnson JM, Zlotnick A. Altering the Energy Landscape of Virus Self-Assembly to Generate Kinetically Trapped Nanoparticles. Biomacromolecules. 2010;11:439–442. doi: 10.1021/bm901160b. [DOI] [PubMed] [Google Scholar]
- 16.Wright ER, Schooler JB, Ding HJ, Kieffer C, Fillmore C, Sundquist WI, Jensen GJ. Electron Cryotomography of Immature HIV-1 Virions Reveals the Structure of the CA and Sp1 Gag Shells. EMBO J. 2007;26:2218–2226. doi: 10.1038/sj.emboj.7601664. [DOI] [PMC free article] [PubMed] [Google Scholar]
- 17.Briggs JAG, Riches JD, Glass B, Bartonova V, Zanetti G, Kräusslich H-G. Structure and Assembly of Immature HIV. Proc Natl Acad Sci US A. 2009;106:11090–10095. doi: 10.1073/pnas.0903535106. [DOI] [PMC free article] [PubMed] [Google Scholar]
- 18.Yu Z, Dobro MJ, Woodward CL, Levandovsky A, Danielson CM, Sandrin V, Shi J, Aiken C, Zandi R, Hope TJ, Jensen GJ. Unclosed HIV-1 Capsids Suggest a Curled Sheet Model of Assembly. J Mol Biol. 2013;425:112–123. doi: 10.1016/j.jmb.2012.10.006. [DOI] [PMC free article] [PubMed] [Google Scholar]
- 19.Earnshaw W, King J. Structure of Phage P22 Coat Protein Aggregates Formed in the Absence of the Scaffolding Protein. J Mol Biol. 1978;126:721–747. doi: 10.1016/0022-2836(78)90017-7. [DOI] [PubMed] [Google Scholar]
- 20.Prevelige PE, Thomas D, King J. Nucleation and Growth Phases in Polymerization of Coat and Scaffolding Subunits into Icosahedral Procapsid Shells. Biophys J. 1993;64:824–835. doi: 10.1016/S0006-3495(93)81443-7. [DOI] [PMC free article] [PubMed] [Google Scholar]
- 21.Bourne CR, Lee S, Venkataiah B, Lee A, Korba B, Finn MG, Zlotnick A. Small-Molecule Effectors of Hepatitis B Virus Capsid Assembly Give Insight into Virus Life Cycle. J Virol. 2008;82:10262–10270. doi: 10.1128/JVI.01360-08. [DOI] [PMC free article] [PubMed] [Google Scholar]
- 22.Fuerstenau SD, Benner WH. Molecular Weight Determination of Megadalton DNA Electrospray Ions Using Charge Detection Time-of-Flight Mass Spectroemtry. Rapid Comm Mass Spectrom. 1995;9:1528–1538. doi: 10.1002/rcm.1290091513. [DOI] [PubMed] [Google Scholar]
- 23.Fuerstenau SD, Benner WH, Thomas JJ, Brugidou C, Bothner B, Siuzdak G. Mass Spectrometry of an Intact Virus. Angew Chem Int Ed. 2001;40:541–544. doi: 10.1002/1521-3773(20010202)40:3<541::AID-ANIE541>3.0.CO;2-K. [DOI] [PubMed] [Google Scholar]
- 24.Gamero-Castano M. Image Charge Detector With Multiple Sensing Stages. Rev Sci Instrum. 2007;78:043301. doi: 10.1063/1.2721408. [DOI] [PubMed] [Google Scholar]
- 25.Contino NC, Jarrold MF. Charge Detection Mass Spectrometry for Single Ions With a Limit of Detection of 30 Charges. Int J Mass Spectrom. 2013;345–347:153–159. [Google Scholar]
- 26.Contino N, Pierson E, Keifer D, Jarrold M. Charge Detection Mass Spectrometry With Resolved Charge States. J Am Soc Mass Spectrom. 2013;24:101–108. doi: 10.1007/s13361-012-0525-5. [DOI] [PubMed] [Google Scholar]
- 27.Pierson EE, Keifer DZ, Contino NC, Jarrold MF. Probing Higher Order Multimers of Pyruvate Kinase With Charge Detection Mass Spectrometry. Int J Mass Spectrom. 2013;337:50–56. [Google Scholar]
- 28.Pierson EE, Contino NC, Keifer DZ, Jarrold MF. Charge Detection Mass Spectrometry for Single Ions With an Uncertainty in the Charge Measurement of 0.65 e. J Am Soc Mass Spectrom. 2015;26:1213–1220. doi: 10.1007/s13361-015-1126-x. [DOI] [PubMed] [Google Scholar]
- 29.Shelton H, Hendricks CD, Wuerker RF. Electrostatic Acceleration of Microparticles to Hypervelocities. J Appl Phys. 1960;31:1243–1246. [Google Scholar]
- 30.Pierson EE, Keifer DZ, Selzer L, Lee LS, Contino NC, Wang JCY, Zlotnick A, Jarrold MF. Detection of Late Intermediates in Virus Capsid Assembly by Charge Detection Mass Spectrometry. J Am Chem Soc. 2014;136:3536–3541. doi: 10.1021/ja411460w. [DOI] [PMC free article] [PubMed] [Google Scholar]
- 31.Seeger C, Zoulim F, Mason WS. Hepadnaviruses. In: Knipe DM, Griffin DE, Lamb RA, Martin MA, Roizman B, Straus SE, editors. Fields Virology. Vol. 2. Lippincott Williams & Wilkins; Philadelphia: 2007. pp. 2977–3029. [Google Scholar]
- 32.Nassal M. Hepatitis B Viruses: Reverse Transcription a Different Way. Virus Res. 2008;134:235–49. doi: 10.1016/j.virusres.2007.12.024. [DOI] [PubMed] [Google Scholar]
- 33.Menne S, Cote PJ. The Woodchuck as an Animal Model for Pathogenesis and Therapy of Chronic Hepatitis B Virus Infection. World J Gastroentero. 2007;13:104–124. doi: 10.3748/wjg.v13.i1.104. [DOI] [PMC free article] [PubMed] [Google Scholar]
- 34.Crowther RA, Kiselev NA, Böttcher B, Berriman JA, Borisova GP, Ose V, Pumpens P. Three-Dimensional Structure of Hepatitis B Virus Core Particles Determined by Electron Cryomicroscopy. Cell. 1994;77:943–950. doi: 10.1016/0092-8674(94)90142-2. [DOI] [PubMed] [Google Scholar]
- 35.Yu M, Miller RH, Emerson S, Purcell RH. A Hydrophobic Heptad Repeat of the Core Protein of Woodchuck Hepatitis Virus Is Requred for Capsid Assembly. J Virol. 1996;70:7085–7091. doi: 10.1128/jvi.70.10.7085-7091.1996. [DOI] [PMC free article] [PubMed] [Google Scholar]
- 36.Zlotnick A, Johnson JM, Wingfield PW, Stahl SJ, Endres DA. Theoretical Model Successfully Identifies Features of Hepatitis B Virus Capsid Assembly. Biochemistry. 1999;38:14644–14652. doi: 10.1021/bi991611a. [DOI] [PubMed] [Google Scholar]
- 37.Bourne C, Lee S, Venkataiah B, Lee A, Korba B, Finn MG, Zlotnick A. Small-Molecule Effectors of Hepatitis B Virus Capsid Assembly Give Insight into Virus Life Cycle. J Virol. 2008;82:10262–10270. doi: 10.1128/JVI.01360-08. [DOI] [PMC free article] [PubMed] [Google Scholar]
- 38.Tan Z, Pionek K, Unchwaniwala N, Maguire ML, Loeb DD, Zlotnick A. The Interface between Hepatitis B Virus Capsid Proteins Affects Self-Assembly Pregenomic RNA Packaging and Reverse Transcription. J Virol. 2015;89:3275–84. doi: 10.1128/JVI.03545-14. [DOI] [PMC free article] [PubMed] [Google Scholar]
- 39.Kukreja AA, Wang JC, Pierson EE, Keifer DZ, Selzer L, Tan Z, Dragnea B, Jarrold MF, Zlotnick A. Structurally Similar Woodchuck and Human Hepadnavirus Core Proteins Have Distinctly Different Temperature Dependences of Assembly. J Virol. 2014;88:14105–15. doi: 10.1128/JVI.01840-14. [DOI] [PMC free article] [PubMed] [Google Scholar]
- 40.Wang JC, Dhason MS, Zlotnick A. Structural Organization of Pregenomic RNA and the Carboxy-Terminal Domain of the Capsid Protein of Hepatitis B Virus. PLoS Pathog. 2012;8:e1002919. doi: 10.1371/journal.ppat.1002919. [DOI] [PMC free article] [PubMed] [Google Scholar]
- 41.Dole M, Mack LL, Hines RL, Mobley RC, Ferguson LP, Alice MB. Molecular Beams of Macroions. J Chem Phys. 1968;49:2240–2249. [Google Scholar]
- 42.Fernandez de la Mora J. Electrospray Ionization of Large Multiply Charged Species Proceeds Via Dole’s Charged Residue Mechanism. Anal Chim Acta. 2000;406:93–104. [Google Scholar]
- 43.Lord Rayleigh On the Equilibrium of Liquid Conducting Masses Charged With Electricity. Phil Mag. 1882;14:184–186. [Google Scholar]
- 44.Clemmer DE, Hudgins RR, Jarrold MF. Naked Protein Conformations: Cytochrome c in the Gas Phase. J Am Chem Soc. 1995;117:10141–10142. [Google Scholar]
- 45.Hogan CJ, Ruotolo B, Robinson C, Fernandez de la Mora J. Tandem Differential Mobility Analysis-Mass Spectrometry Reveals Partial Gas-Phase Collapse of the GroEL Complex. J Phys Chem B. 2011;115:3614–3621. doi: 10.1021/jp109172k. [DOI] [PubMed] [Google Scholar]
- 46.Thomas JJ, Bothner B, Traina J, Benner WH, Siuzdak G. Electrospray Ion Mobility Spectrometry of Intact Viruses. Spectroscopy. 2004;18:31–36. [Google Scholar]
- 47.Horowitz ED, Tahman KS, Bower BD, Dismuke DJ, Falvo MR, Griffith JD, Harvey SC, Asokan A. Biophysical and Ultrastructural Characterization of Adeno-Associated Virus Capsid Uncoating and Genome Release. J Virol. 2013;87:2994–3002. doi: 10.1128/JVI.03017-12. [DOI] [PMC free article] [PubMed] [Google Scholar]
- 48.Luque A, Zandi R, Reguera D. Optimal Architectures of Elongated Viruses. Proc Natl Acad Sci US A. 2010;107:5253–5258. doi: 10.1073/pnas.0915122107. [DOI] [PMC free article] [PubMed] [Google Scholar]
- 49.Stray SJ, Bourne CR, Punna S, Lewis WG, Finn MG, Zlotnick A. A Heteroaryldihydropyrimidine Activates and Can Misdirect Hepatitis B Virus Capsid Assembly. Proc Natl Acad Sci U S A. 2005;102:8138–43. doi: 10.1073/pnas.0409732102. [DOI] [PMC free article] [PubMed] [Google Scholar]
- 50.http://www.simion.com
Associated Data
This section collects any data citations, data availability statements, or supplementary materials included in this article.