

Abstract
Rationale
High-throughput screening (HTS) is a critical step in the drug discovery process. However, most mass spectrometry-based HTS methods require sample cleanup steps prior to analysis. In this work we present the utility of infrared matrix-assisted laser desorption electrospray ionization (IR-MALDESI) for monitoring an enzymatic reaction directly from a biological buffer system with no sample cleanup and at high throughput.
Methods
IR-MALDESI was used to directly analyze reaction mixtures from a well plate at different time points after reaction initiation. The percent conversion of precursors to products was used to screen the enzyme activity. The reaction was performed with two different concentrations of precursors and enzyme in order to assess the dynamic range of the assay. Eventually, a pseudo-HTS study was designed to investigate the utility of IR-MALDESI screening enzyme activity in a high-throughput manner.
Results
IR-MALDESI was able to readily monitor the activity of IDH1 over time at two different concentrations of precursors and enzyme. The calculated Z-factors of 0.65 and 0.41 confirmed the suitability of the developed method for screening enzyme activity in HTS manner. Finally, in a single-blind pseudo-HTS analysis IR-MALDESI was able to correctly predict the identity of all samples, where 8/10 samples were identified with high confidence and the other 2 samples with lower confidence.
Conclusions
The enzymatic activity of IDH1 was screened by directly analyzing the reaction content from the buffer in well plates with no sample cleanup steps. This proof-of-concept study demonstrates the robustness of IR-MALDESI for direct analysis of enzymatic reactions from biological buffers with no sample cleanup and its immense potential for HTS applications.
Keywords: IR-MALDESI, Q Exactive Plus, High-throughput Screening, IDH1, Enzyme activity
Introduction
High-throughput screening (HTS) is a critical step in the drug discovery process, where the biochemical activities of a large number of drug-like compounds are tested in order to identify potential candidates that exhibit a desired feature, such as binding affinity or inhibitory activity. Over the past two decades many strides have been made in miniaturization and automation of HTS, along with advancements in developing new assays and integrating rapid sampling with sensitive detection.[1,2]
Some of the most important detection methods in HTS applications are optical assays that rely on UV/Vis or fluorescence spectroscopy for detection.[3] These methods are commonly used due to their speed and sensitivity, but suffer from certain limitations. For instance, many assays are not amenable to detection by fluorescence because the substrate(s) or product(s) require tagging. In addition, while fluorescence-based methods are highly sensitive, they are not highly specific and phenomena such as autofluorescence or non-specific tagging have to be accounted for when choosing such methods.[3,4]
Mass spectrometry-based methods are an emerging technological advancement for application to HTS assays. These techniques are label-free, highly sensitive, and more specific than optical methods, and have been widely used in many phases of drug discovery such as target validation to tracking pharmacokinetics. However, historically their utility for HTS applications have been limited mostly due to the low throughput of HPLC-MS or UPLC-MS methods, which typically require several minutes of analysis time per sample.[5] In addition, most MS-based methodologies are susceptible to the presence of nonvolatile compounds such as salts, buffers, and detergents that are required in enzymatic assays, and therefore, sample cleanup and desalting are necessary prior to analysis. The RapidFire™ platform (Agilent Technologies, Lexington, MA, USA) is one of the recent advancements in MS-based HTS instrumentation aimed at circumventing the aforementioned limitations. Using RapidFire™, the analysis times have been reduced to ~10 seconds per sample and the sample is driven through a solid-phase extraction (SPE) cartridge to remove salts and other contaminants prior to injection of eluent into the MS source.[4,6] Other recent developments in sampling and ionization for high-throughput MS include desorption electrospray ionization (DESI)[7] and acoustic droplet ejection (ADE).[8] These very different methods share the important property of rapid, spatially resolved sampling combined with very high tolerance for non-volatile contamination.
Matrix-assisted laser desorption electrospray ionization (MALDESI)[9] is an ambient ionization method combining features of matrix-assisted laser desorption/ionization (MALDI)[10] and electrospray ionization (ESI).[11] In MALDESI analyses a laser is used to desorb material from the surface of a sample. The plume of ablated material partitions in the charged droplets of an orthogonally oriented electrospray plume, where ions are generated in an ESI-like manner.[9] The most current version of the source is coupled to a high resolving power/accurate mass (HRAM) mass spectrometer, the Q Exactive Plus, and utilizes a mid-Infrared (IR) laser for sample desorption/aerosolization. The mid-IR laser excites the O-H stretching modes of water present in the sample and facilitates the desorption/aerosolization of neutrals from the surface.[12] With a sampling rate limited mainly by the duty cycle of the mass analyzer, IR-MALDESI can achieve analysis times of less than one second per sample, making it inherently suitable for HTS applications. Typically two laser shots are used to aerosolize the material and the generated ions from both pulses are stored in the C-trap for a fixed accumulation time (75 ms), and subsequently injected into the Orbitrap for mass measurement. The whole process for analyzing a sample with 2 laser pulses takes less than one second; therefore, the contents of a 1536-well plate can be analyzed entirely in ~30 minutes, limited only by the duty cycle of the mass spectrometer. The IR-MALDESI source is coupled to a high resolving power (RP) mass spectrometer, and most analyses are performed at nominal RP of 140,000. Since most HTS experiments are performed in a semi-targeted manner, the total analysis time can be reduced by performing the experiments at lower resolving powers. Furthermore, the ESI post-ionization in IR-MALDESI allows for direct analysis of analytes from matrices containing high salt and protein concentrations, that are used to perform enzymatic reactions.[13,14]
The features mentioned above make IR-MALDESI an exciting platform technology for HTS analyses since not only the analysis can be performed rapidly, but also compared to other MS-based methods the sample preparation and cleanup steps are drastically reduced or completely eliminated because of the inherent nature of IR-MALDESI ionization process. Herein, we present an application of HTS analysis using IR-MALDESI by monitoring the enzymatic activity of isocitrate dehydrogenase 1 (IDH1) directly from well plates containing the quenched reactions in buffer. The conversions of isocitrate to α-ketoglutarate (α-KG) and NADP+ to NADPH were measured separately and used to estimate the reaction progress. This work serves as a proof-of-concept study for demonstrating the utility of IR-MALDESI for HTS applications.
Experimental
Materials
HPLC-grade methanol and water for ESI solvent were purchased from Burdick and Jackson (Muskegon, MI, USA). Acetic acid, magnesium chloride (MgCl2), bovine serum albumin (BSA), DL-isocitric acid trisodium salt hydrate, β-nicotinamide adenine dinucleotide phosphate hydrate (NADP+), isocitrate dehydrogenase 1 human (IDH1, catalog # I5036), and BRAND® 384-well plates (catalog # BR781620) were purchased from Sigma-Aldrich (St. Louis, MO, USA). Micro-24™ slides were obtained from Prosolia (Indianapolis, IN, USA). Formic acid, DL-dithiothreitol (DDT), 6N hydrochloric acid (HCl), and 1M Tris-HCl buffer (molecular biology grade, pH 8.0) were purchased from Fisher Scientific (Nazareth, PA, USA). The pH of the Tris-HCl buffer was adjusted to 7.5 with hydrochloric acid. All other materials were used without further modifications.
Enzymatic Reactions
The reactions were carried out in an assay buffer of 20 mM Tris-HCl pH 7.5, with 1 mM MgCl2, 1 mM DTT, and 0.01% BSA by weight. The same buffer was used to prepare all stock solutions. All solutions were prepared fresh on the day of analysis.
Reactions were started by thorough mixing of equal parts of solutions containing substrates and enzyme. The reaction scheme along with the final concentrations used in the two experiments are shown in Figure 1. Reactions were carried out at ambient temperature and pressure until quenching, which was done by addition of 1/10 reaction volume of 10% formic acid.
Figure 1.

Schematic of isocitrate dehydrogenase 1 (IDH1) reaction and the concentrations of precursors and enzyme used in two different experiments.
IR-MALDESI Reaction Screening
The IR-MALDESI analyses were performed as previously described in detail.[12] Briefly, the well plates containing the samples were placed on an X-Y positioning stage and adjusted so as to position the liquid surfaces of the wells 5 mm below the inlet of the mass spectrometer. A mid-IR laser tuned to 2940 nm (IR-Opolette 2371, Opotek, Carlsbad, CA, USA) was used to aerosolize material from the sample in each well. The plume of aerosolized material was ionized through interactions with an orthogonal electrospray.[9] A schematic of the IR-MALDESI source as used in this experiment is shown in Figure 2.
Figure 2.

Schematic of IR-MALDESI source adapted for direct analysis of samples from well plates. The zoomed-in region shows the side view of the well plate containing the solution and the laser focused on top of the meniscus.
Based on previous optimizations[15], a 50/50 mixture of MeOH/H2O (v/v) containing 1 mM acetic acid was used as the electrospray solvent for analysis in negative ion mode. The IR-MALDESI source was coupled to a Q Exactive Plus mass spectrometer (Thermo Fisher Scientific, Bremen, Germany). The laser beam was focused on top of the meniscus of the solution in the wells and two laser shots (20 Hz) per scan were used to aerosolize the sample solution. Due to the pulsed nature of the ionization the automatic gain control (AGC) function was disabled. The ions generated from the two laser pulses were accumulated in the C-trap for a fixed injection time (IT) of 75 ms before injection into the Orbitrap for mass analysis. This IT was optimized in a previous study for capturing the aerosolized material from two laser shots.[16]
As shown in Figure 1, two separate experiments at different concentrations of precursors and enzyme were performed to gauge the dynamic range of the assay. The reaction with lower concentrations is referred to as “Experiment 1” throughout the manuscript, and the term “Experiment 2” refers to the reaction at higher concentrations. Experiment 1 was performed by pipetting 5 μL of reaction mixture at different time points after reaction initiation onto the wells of a Micro-24™ slide and focusing the laser on the droplet. Experiment 2 was performed by pipetting 100 μL of reaction mixture into the wells of a 384-well plate and focusing the laser beam on the meniscus. Once the source geometry was optimized for direct analysis from a 384-well plate the rest of analyses were performed using them. The equivalency of the two methods was confirmed in a separate experiment (not shown).
A custom method consisting of 6 different scan events (Figure S1) was developed using the accompanying Xcalibur software (Thermo Scientific, San Jose, CA, USA). The first 4 scans in this method monitored α-KG (m/z 145.0 ± 1 Th), isocitrate (m/z 191.0 ± 1 Th), NADP+ (m/z 742.1 ± 1 Th), and NADPH (m/z 744.1 ± 1 Th) in a SIM fashion at a nominal RP of 70,000 (FWHM, m/z 200), and the last two scans measured wider ranges of 75–300 Th and 200–1000 Th at RP of 140,000 (FWHM, m/z 200) to monitor the conversion of isocitrate to α-KG and NADP+ to NADPH, respectively.
IR-MALDESI HTS proof-of-concept
In order to demonstrate the utility of IR-MALDESI, a pseudo-HTS experiment was designed where 10 different wells were analyzed in HTS manner. This experiment was performed in a single blind fashion, where one of the co-authors of this work prepared 10 different solutions (reactions at concentrations used in Experiment 1 along with negative controls), and pipetted them into the wells of a well plate without informing the other co-authors about the contents of each well. Each well was analyzed using a method where m/z regions of 130–200 Th and 735–755 Th were measured alternatingly at a nominal RP of 70,000 to monitor conversion of isocitrate to α-KG and NADP+ to NADPH, respectively. Two laser shots were used to measure each m/z range, and the IT was set to 75 ms for each scan. The first 14 scans (i.e. 7 scans in low m/z range and 7 in high m/z range) were used to calculate percent conversion of isocitrate to α-KG and NADP+ to NADPH in order to predict the content of each well.
Data Analysis
The .RAW files generated by the instrument were processed in the Qual Browser of Xcalibur software (Thermo Scientific, San Jose, CA, USA) and m/z tolerance of ±2.5 ppm was used to generate extracted ion chromatograms (XIC) of analytes. The data was then exported to Microsoft Excel for statistical analysis and visualization.
Results and Discussion
Screening Enzyme Activity using IR-MALDESI
Screening enzyme activity is one of the most common applications of HTS. In this study, the percent conversion of precursors to products was used to monitor the activity of enzyme over different time points after starting the reaction (addition of enzyme to substrate mixture). The percent conversion for products was calculated using Equation 1:
| Equation 1 |
where I is the ion abundance of the analyte of interest. The percent conversion is a more robust measure of enzyme activity than the absolute abundance of the product ion, since even if the ion abundance of analytes varies from one shot to another due to variability in sampling efficiency, the ratio of ion abundances remains constant.
As mentioned above in the experimental section, a method consisting of six scan events was used to analyze screen enzyme activity in Experiments 1 and 2. The SIM scans were used to confirm the identity and presence of the compounds and the two full MS scans were used to calculate conversion percentages based on the ratio of peaks collected together. Representative mass spectra from the full MS scans in Experiment 2 at 0 and 60 minute time points are shown in Figure 3, where the decrease in ion abundance of precursors and concomitant increase in ion abundance of products can be observed. Using the ion abundances at different time points, percent conversions of isocitrate to α-KG and NADP+ to NADPH at different time points for Experiments 1 and 2 were calculated (Figure 4). It can be seen that in both reactions the enzyme activity can be readily monitored. As expected, the reaction proceeded 10 times faster in Experiment 2 compared to Experiment 1 since the concentration of precursors and enzyme was increased by 10-fold. In addition, the similarity of the curves for each set of analytes for both experiments demonstrates the large estimated dynamic range of the developed method.
Figure 3.

Representative mass spectra showing the 4 analytes of interest in IR-MALDESI direct analyses in Experiment 2 at time points 0 and 60 minutes. Parts A and C show the lower m/z range where isocitrate and α-ketoglutarate are observed, and parts B and D show the higher m/z range that include peaks for NADP+ and NADPH.
Figure 4.
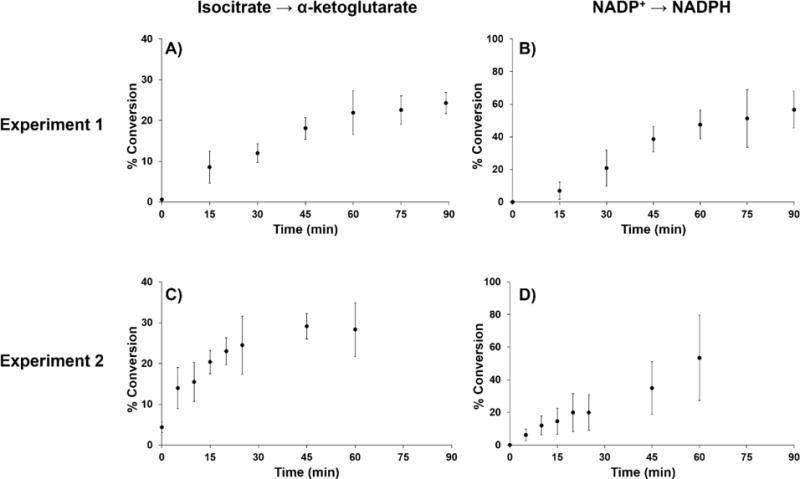
Screening the activity of IDH1 enzyme by monitoring the percent conversion of precursors to products. The top panel shows the conversion rate of isocitrate to α-KG (A) and NADP+ to NADPH (B) in Experiment 1 (low concentration). The bottom panel shows the conversion rate of isocitrate to α-KG (C) and NADP+ to NADPH (D) in Experiment 2 (high concentration). For all analyses the samples were analyzed immediately upon transfer from the reaction mixture to the sample well; however, in Experiment 2 the reaction occurred rapidly enough that the conversion for isocitrate to α-KG was observed to rise from 3% to 7% during the minute-long analysis at t=0 (data not shown).
In order to validate the IR-MALDESI results, conventional UV/Vis analysis of cofactors was performed for Experiment 1 at the beginning and at the final time point (0 and 90 minutes). The UV/Vis spectra (Figure S2) show a peak at 260 nm corresponding to NADP+ immediately after starting the reaction. After 90 minutes another peak at 340 nm, corresponding to NADPH, is observed, indicating a successful reaction.
Suitability of IR-MALDESI for HTS
A marked advantage of IR-MALDESI for HTS is its direct compatibility with a large range of sample preparations including most commonly used well plates, potentially allowing seamless integration of HRAM MS with other screening modalities such as fluorescence assays on the same line. As a measure of assay quality, the Z-factor[17] of a potential IR-MALDESI screen was calculated using Equation 2:
| Equation 2 |
where σ is the standard deviation and μ is the mean, and + or − signs indicate positive and negative controls, respectively. The Z-factor typically fall within a range of −1 ≤ Z ≤ 1, with larger values indicating higher suitability of the assay for HTS. The Z-factor for IR-MALDESI direct screening of IDH1 can be calculated by using the percent conversions of precursors at time points of zero and 90 minutes, respectively as negative and positive controls (Figure 5). The calculated Z-factor for percent conversion of isocitrate to α-KG was 0.65, while the Z-factor for percent conversion of NADP+ to NADPH was less sensitive at 0.41. Together these values demonstrate the ability of the method to separate hits from false positives with high confidence.
Figure 5.

The calculated percent conversion of isocitrate to α-KG (A) and NADP+ to NADPH (B) in Experiment 1, measured continuously over one minute. In each case the Z-factor for each pair was calculated using Equation 2.
IR-MALDESI HTS
To further investigate the utility of IR-MALDESI in a HTS analyses a pseudo-HTS study was designed. The study was performed in a single-blind fashion where one co-author prepared 10 samples and another co-author analyzed the samples directly from well plates, without having any prior knowledge about the identity of the samples. The lower concentrations of precursors and enzyme, similar to Experiment 1, were used since they are closer to those used in biological assays. The percent conversions of isocitrate to α-KG and NADP+ to NADPH were used to predict the identity of the samples. The results of this pseudo-HTS study are presented in Table 1, where the column containing the predicted identity has been color-coded to reflect the confidence of the prediction. It can be seen that IR-MALDESI was able to correctly predict the identity of each sample, and 8/10 samples were identified with high confidence.
Table 1.
Results of the pseudo-HTS analysis of 10 samples in the single-blind study. N/A indicates that the precursor was not observed and therefore % conversion could not be calculated. The “predicted sample identity” column was color-coded to indicate the degree of certainty, where green represents a correct identification with high certainty, yellow is a correct identification with low certainty, and red is a false assignment.
| Sample # | α-KG % Conversion | NADPH % Conversion | Predicted Sample Identity | Correct Sample Identity |
|---|---|---|---|---|
| 1 | N/A | N/A | Blank | Blank |
| 2 | 2.93 | 31.3 | Reaction | Reaction |
| 3 | 1.58 | 0 | Substrate Only | Substrates Only |
| 4 | N/A | N/A | Blank | Blank |
| 5 | N/A | 0 | Blank | Blank |
| 6 | 2.29 | 24.3 | Reaction | Reaction |
| 7 | 0 | 0 | Substrates Only | Substrates Only |
| 8 | 2.59 | 30.1 | Reaction | Reaction |
| 9 | 2.18 | 4.77 | Reaction | Reaction* |
| 10 | N/A | N/A | Blank | Blank |
This reaction was not quenched with 10% FA to investigate if any difference in ion abundance could be observed.
The work presented here demonstrates the potential of IR-MALDESI in HTS applications as a new technological platform that reduces sample preparation steps required prior to analysis. The current rate of 2 samples/second, limited by the need to acquire several scans per well, is competitive with currently available options for MS-based HTS. It is also worth noting that the current IR-MALDESI source has been highly optimized for mass spectrometry imaging experiments of different tissue types.[18] Therefore, the source geometry (e.g. distance between inlet and emitter tip, distance between the plate and the emitter tip, etc.) need to be optimized by performing a detailed design of experiments (DOE) study[19] in order to ensure the highest shot-to-shot reproducibility for HTS analyses. Current efforts are focused on designing a thorough DOE study to improve signal reproducibility, as well as identify the best type of well plates, to achieve the ideal single-shot assay sample rate of >5 samples/second.
Conclusions
Using a prototype instrument with minimal optimization, we have demonstrated the capacity of IR-MALDESI for characterizing the rate of conversion in an enzyme reaction. The quality of the data collected from the model reaction is shown to be sufficient for an activity assay with a throughput of 2.5 seconds per sample, with the potential of up to a tenfold increase given an improvement in ionization efficiency. The results demonstrate the utility of IR-MALDESI as a compact platform for HR/AM-MS, directly compatible with samples from industry standard assays.
Supplementary Material
Acknowledgments
The authors gratefully acknowledge financial assistance received from the National Institutes of Health grants R01GM087964 (MN, ME, SK, DCM), the W. M. Keck foundation, and North Carolina State University.
Footnotes
Conflicts of Interest
The authors declare no competing financial interests.
References
- 1.Malo N, Hanley JA, Cerquozzi S, Pelletier J, Nadon R. Statistical practice in high-throughput screening data analysis. Nat Biotechnol. 2006;24:167. doi: 10.1038/nbt1186. [DOI] [PubMed] [Google Scholar]
- 2.Macarron R, Banks MN, Bojanic D, Burns DJ, Cirovic DA, Garyantes T, Green DVS, Hertzberg RP, Janzen WP, Paslay JW, Schopfer U. Impact of high-throughput screening in biomedical research. Nat Rev Drug Discov. 2011;10:188. doi: 10.1038/nrd3368. [DOI] [PubMed] [Google Scholar]
- 3.Eggeling C, Brand L, Ullmann D, Jäger S, Jäger S. Highly sensitive fluorescence detection technology currently available for HTS. Drug Discov Today. 2003;8:632. doi: 10.1016/s1359-6446(03)02752-1. [DOI] [PubMed] [Google Scholar]
- 4.Özbal CC, Lamarr WA, Linton JR, Green DF, Katz A, Morrison TB, Brenan CJH. High Throughput Screening via Mass Spectrometry: A Case Study Using Acetylcholinesterase. Assay Drug Dev Technol. 2004;2:373. doi: 10.1089/adt.2004.2.373. [DOI] [PubMed] [Google Scholar]
- 5.Rohman M, Wingfield J. High-Throughput Screening Using Mass Spectrometry within Drug Discovery. In: Janzen WP, editor. High Throughput Screening: Methods and Protocols. Springer Science+Business Media; New York: 2016. pp. 47–63. [DOI] [PubMed] [Google Scholar]
- 6.Leveridge M, Buxton R, Argyrou A, Francis P, West A, Rees M, Hardwicke P, Bridges A. Demonstrating Enhanced Throughput of RapidFire Mass Spectrometry through Multiplexing Using the JmjD2d Demethylase as a Model System. J Biomol Screen. 2014;19:278. doi: 10.1177/1087057113496276. [DOI] [PubMed] [Google Scholar]
- 7.Chen H, Talaty NN, Takats Z, Cooks GR. Desorption Electrospray Ionization Mass Spectrometry for High-Throughput Analysis of Pharmaceutical Samples in the Ambient Environment. Anal Chem. 2005;77:6915. doi: 10.1021/ac050989d. [DOI] [PubMed] [Google Scholar]
- 8.Sinclair I, Stearns R, Pringle S, Wingfield J, Datwani S, Hall E, Ghislain L, Majlof L, Bachman M. Novel Acoustic Loading of a Mass Spectrometer: Toward Next-Generation High-Throughput MS Screening. J Lab Autom. 2016;21:19. doi: 10.1177/2211068215619124. [DOI] [PubMed] [Google Scholar]
- 9.Sampson JS, Hawkridge AM, Muddiman DC. Generation and detection of multiply-charged peptides and proteins by matrix-assisted laser desorption electrospray ionization (MALDESI) Fourier transform ion cyclotron resonance mass spectrometry. J Am Soc Mass Spectrom. 2006;17:1712. doi: 10.1016/j.jasms.2006.08.003. [DOI] [PubMed] [Google Scholar]
- 10.Karas M, Hillenkamp F. Laser Desorption Ionization of Proteins with Molecular Masses Exceeding 10,000 Daltons. Anal Chem. 1988;60:2299. doi: 10.1021/ac00171a028. [DOI] [PubMed] [Google Scholar]
- 11.Fenn JB, Mann M, Meng CK, Wong SF, Whitehouse CM. Electrospray Ionization for Mass Spectrometry of Large Biomolecules. Science. 1989;246:64. doi: 10.1126/science.2675315. [DOI] [PubMed] [Google Scholar]
- 12.Robichaud G, Barry JA, Garrard KP, Muddiman DC. Infrared matrix-assisted laser desorption electrospray ionization (IR-MALDESI) imaging source coupled to a FT-ICR mass spectrometer. J Am Soc Mass Spectrom. 2013;24:92. doi: 10.1007/s13361-012-0505-9. [DOI] [PMC free article] [PubMed] [Google Scholar]
- 13.Ekelöf M, Mcmurtrie EK, Nazari M, Johanningsmeier SD, Muddiman DC. Direct Analysis of Triterpenes from High-Salt Fermented Cucumbers Using Infrared Matrix-Assisted Laser Desorption. J Am Soc Mass Spectrom. 2017;28:370. doi: 10.1007/s13361-016-1541-7. [DOI] [PubMed] [Google Scholar]
- 14.Nazari M, Malico AA, Ekelöf M, Lund S, Williams GJ, Muddiman DC. Direct Analysis of Terpenes from Biological Buffer Systems using SESI and IR-MALDESI. Anal Bioanal Chem. 2017 doi: 10.1007/s00216-017-0570-9. In Press. [DOI] [PMC free article] [PubMed] [Google Scholar]
- 15.Nazari M, Muddiman DC. Polarity Switching Mass Spectrometry Imaging of Healthy and Cancerous Hen Ovarian Tissue Sections by Infrared Matrix-Assisted Laser Desorption Electrospray Ionization (IR-MALDESI) Analyst. 2016;141:595. doi: 10.1039/c5an01513h. [DOI] [PMC free article] [PubMed] [Google Scholar]
- 16.Ekelöf M, Muddiman DC. Time-resolved measurements of ion accumulation for method optimization in IR-MALDESI mass spectrometry. Anal Bioanal Chem. 2017 doi: 10.1007/s00216-017-0585-2. Submitted. [DOI] [PubMed] [Google Scholar]
- 17.Zhang J, Chung TDY, Oldenburg KR. A simple statistical parameter for use in evaluation and validation of HTS assays. J Biomol Screen. 1999;4:67. doi: 10.1177/108705719900400206. [DOI] [PubMed] [Google Scholar]
- 18.Robichaud G, Barry JA, Muddiman DC. IR-MALDESI Mass Spectrometry Imaging of Biological Tissue Sections Using Ice as a Matrix. J Am Soc Mass Spectrom. 2014;25:319. doi: 10.1007/s13361-013-0787-6. [DOI] [PMC free article] [PubMed] [Google Scholar]
- 19.Hecht ES, Oberg AL, Muddiman DC. Optimizing Mass Spectrometry Analyses: A Tailored Review on the Utility of Design of Experiments. J Am Soc Mass Spectrom. 2016;27:767. doi: 10.1007/s13361-016-1344-x. [DOI] [PMC free article] [PubMed] [Google Scholar]
Associated Data
This section collects any data citations, data availability statements, or supplementary materials included in this article.