Abstract
Background:
Jaw bone quality plays an essential role in treatment planning and prognosis of dental implants. Regarding several available methods for bone density measurements, they are not routinely used before implant surgery due to hard accessibility.
Objective:
An in vitro investigation of correlation between average gray scale in direct digital radiographs and Hounsfield units in CT-Scan provides a feasible method for evaluating alveolar bone quality prior to implant surgery.
Methods:
26 sheep’s mandibles in which a square shape ROI marked by gutta percha, were prepared. Three direct digital radiographs (CCD sensor) from every specimen were taken using 80, 100 and 200 milli-seconds. Then, the average gray levels for ROIs were calculated using a costume-made software. Next, the specimens were scanned using a 16-slice spiral CT and the Hounsfield Unit of each ROI was calculated. Pearson analysis measured the correlation between Hounsfield units and average gray levels.
Results:
There was a positive correlation between Hounsfield unit and average gray level in the radiographs and the correlation was better in higher exposure times.
Conclusion:
It is possible to estimate Hounsfield unit and bone density in the jaw bones using average gray scale in a digital radiograph. This approach is easy, simple and available and also results in lower patient exposure comparing other bone densitometric analysis methods.
Keywords: Hounsfield Units , Gray Level , Bone Density , Implant
Introduction
The term “bone quality” has been extensively used in the literature to describe different aspects of bone characteristics with variable definitions depending on the context. Among inseparable factors which influence bone quality is the trabecular bone [1-4]. The trabecular bone is the primary anatomical and functional unit of cancellous bone. Cortical bone helps attain primary implant stability. The role of cancellous bone, however, is also significant as cancellous bone has a higher bone turnover rate than cortical bone [5]. Besides, a dental implant is mainly in contact with cancellous part of the bone [6]. Accordingly, osseointegration process and healing at the implant bone surface is influenced by cancellous bone [5].
Knowledge of bone density in various areas of maxilla and mandible might help a clinician to understand and correlate observed clinical phenomenon. A close relationship exists between bone density and anchorage potential as well as the rate of tooth movement in orthodontic [6,7].
The studies reveal that high percentage of dentists merely use panoramic images for planning implant treatment and less than 10% take advantage of CT. However, American Academy of Oral and Maxillofacial Radiology has made it an instruction to use a 3D imaging such as CT in order to examine implant location [8].
The practical and substantial assessment of bone quality often depends on subjective procedures. These usually include the tactile impression while drilling to prepare the implant site and visual evaluation of CT and topographic images. There are some methods that are able to objectively assess bone quality for example cutting resistance analysis (CRA) which measures clinical bone torque threshold where bone implant contact is destroyed. The major limitation of CRA is that it does not give any information on bone quality until osteotomy site is prepared [9].
Recently, the use of cone-beam (CBCT) in dentistry has increased, because CBCT is associated with benefits such as increased patient comfort, lower radiation doses and lower operation costs compared to conventional CT [10]. However, Nackaerts et al. [11] demonstrated that density profiles of conventional CT showed stable HU values, whereas intensity values in CBCT images are not reliable because the values are influenced by the device used, imaging parameters and positioning. Accordingly, Naitoh et al. [12] found that the trabecular bone volume per total tissue volume obtained using CBCT images was closely correlated with HU values generated from conventional CT images.
Beam attenuation coefficient can be determined on a CT image. Measured quantities are represented by Hounsfield units (HU) which are also called CT numbers. HU also ranges from -1000 (air) to +3000 (enamel), each corresponding to different levels of beam attenuation [8].
Misch has classified bone density under 4 categories of D1, D2, D3 and D4 in edentulous maxillary and mandibular areas. D1 is compact cortical bone. D2 is attributed to nonporous compact cortical bone on the crest and body of bone including large trabecular bone. D3 consists of thinner porous cortical crest and a fine trabecular bone near implant. Most often, no cortical bone can be found in the crest for the density of D4 and fine trabecular bone forms nearly all the size of the bone next to the implant (Table 1). Bone density may be determined by touching the area through surgery based on edentulous situation or radiographic evaluation [8].
Table 1.
Bone density classification and Hounsfield number
| Bone Density at CT Image | Misch’s Classification |
|---|---|
| Hounsfield Number >1250 | D1 |
| 850-1250 | D2 |
| 350-850 | D3 |
| 150-350 | D4 |
| Hounsfield Number < 150 | D5 |
Panoramic or periapical radiography cannot be used to determine bone density, because lateral cortical plates will make the density of trabecular bone an ambiguous criterion. Moreover, minor changes from D2 to D3 cannot be evaluated by such modes of radiography. Therefore, initial treatment plans usually begin with such modes of radiography and are followed by density evaluation method on the implant location. Bone density range can be more accurately determined by tomography methods of radiography, especially CT.
Generally speaking, the higher the CT number, the more compact the tissue. There are software utilities that are able to place the implant on CT image electronically and then, Hounsfield number would evaluate implant location [8].
Merheb et al. [13] showed that a significant linear relationship existed between damping values and HU values at implant insertion and suggested that preoperative evaluation of cortical thickness and trabecular bone HU appeared to be the most reliable method for predicting implant stability.
In the present study, we tried to examine the animal samples by CT-Scan, as the most accurate and repeatable diagnostic method for bone density testing, and to study digital images of samples in order to investigate the relationship between these two measurement methods and also to translate the Hounsfield unit measured by CT-Scan into Gray Scale code. Clearly, the priority for this study was not to suggest a very accurate method of bone density testing but to offer a simple, inexpensive, fast, available and applicable method with an acceptable precision to be used at clinic.
Material and Methods
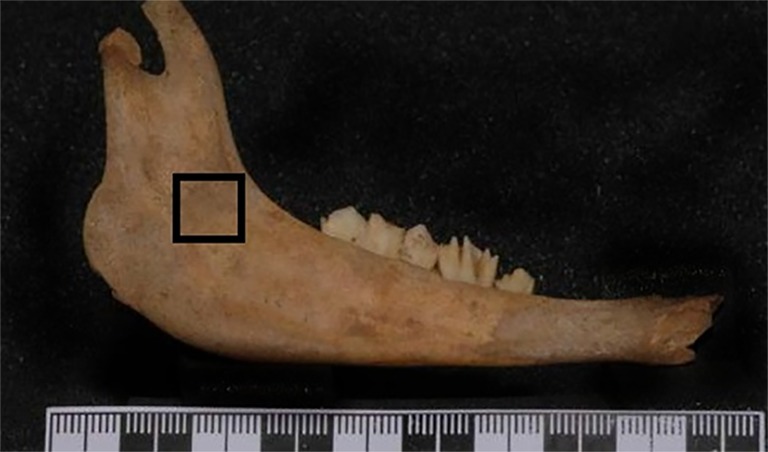
This research was carried out on 26 samples of mandibles of sheep. All soft tissues were removed from the mandible. Gutta-percha cones were used to form a square window (1×1cm) on buccal surface to enable precise selection of the areas on each sample (Figure 1). The samples were put into a container of melted wax for covering all the surface of samples with a thin layer of wax. This was done to simulate soft tissue and to avoid direct contact of air with the bone in order to postpone decay. Wax layers were used with various thicknesses within the range of 10-20 mm.
Figure1.

Gutta-percha cones were used to form a square window (1×1cm) on buccal surface of mandibles.
In the first step, the digital radiographs were performed with CCD sensor (size 2; sensor model: SUNY) at tube voltage of 70 KVP, Cone 12 cm, mA=8, Time: 80, 100, 200 milliseconds. The sensor was placed on the lingual surface and the tube was placed on the buccal side of mandible with 10 cm distance to the object. Images were recorded in BMP format.
In the next step, CT scans were performed using a spiral CT machine (Light Speed Ultra16; General Electric, Milwaukee, WI, USA). Then, one-millimeter slices were prepared. The scanner was calibrated a day before it was used for the first sample according to manufacturer’s guidelines.
For evaluation of radiographic images, the pixels inside the square were read by our developed software for this purpose in MATLAB environment and assigned a number according to the gray scale level. Finally, the average gray level was calculated for the square. The assessment calculates the attenuation by the buccal, lingual cortices, cancellous bone and wax layer, altogether. Results were recorded for three times of 80, 100 and 200 milliseconds.
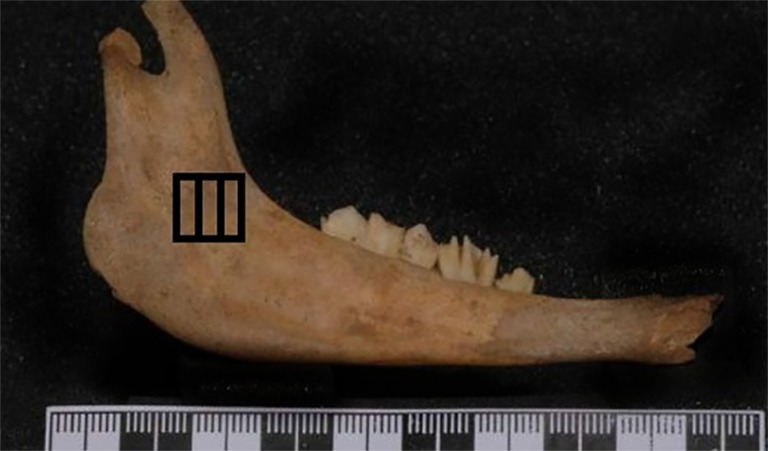
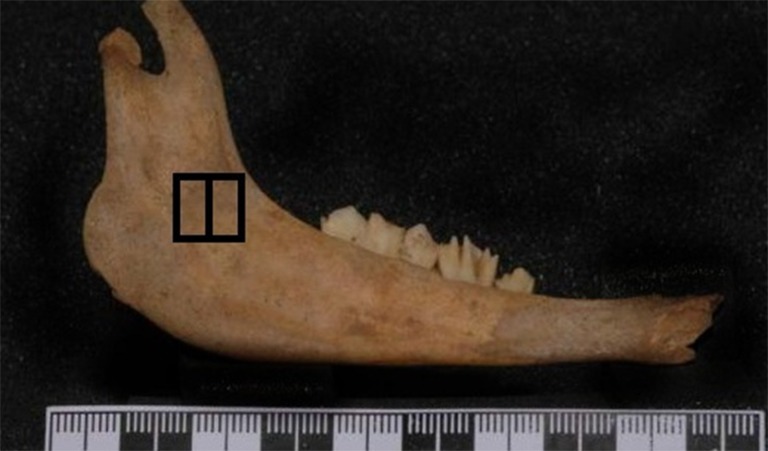
HU was measured in two different methods. (A) One method was to measure HU in three different slices at 2mm intervals (Figure 2); B) the other way was to estimate HU on one slice in the middle of the selected area and to consider it as mean HU (Figure 3).
Figure2.

Measuring HU in three different slices at 2mm intervals
Figure3.

Measuring HU in one slice in the middle of the selected area
In the first analysis (A) which included the mean average of three spots, the squares (formed by gutta-percha cones) were analyzed for every sample and the average gray scale was calculated. Therefore, the impacts of the buccal and lingual cortical plates as well as the cancellous area are considered in the calculation of HU. Then, Pearson’s correlation test was applied to analyze the data.
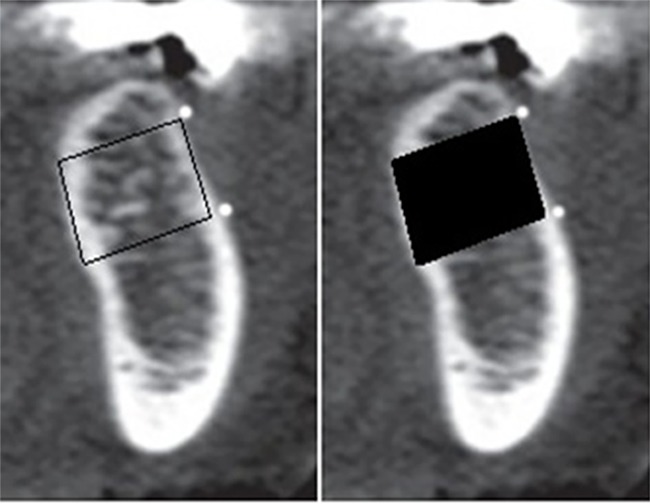
Coronal cross sections were used for the estimation of HU (Figure 4). In the next step, only one slice is selected from the middle of the square, instead of 3 cross-sectional slices, and the calculated HU was recorded. Afterwards, Pearson’s Correlation Coefficient was calculated for the new data.
Figure4.

A spot is allotted to coronal plate (which was selected earlier on the lateral view) and then CT software gives the HU for this spot.
Results
The correlation coefficients between HU and Average Gray Level obtained via various measurements is listed in Table 2.
Table 2.
Correlation coefficients between HU & Average Gray Level obtained via various measurements
| Pearson correlation between HU & Average Gray Level | |
|---|---|
| 26 selected areas (average mean of 3 slices); 80 milliseconds (A) | 0.577 * |
| 26 selected areas (average mean of 3 slices); 100 milliseconds (A) | 0.656 ** |
| 26 selected areas (average mean of 3 slices); 200 milliseconds (A) | 0.695 ** |
| 26 selected areas (1 slice); 80 milliseconds (B) | 0.660 ** |
| 26 selected areas (1 slice); 100 milliseconds (B) | 0.759 ** |
| 26 selected areas (1 slice); 200 milliseconds (B) | 0.777 ** |
| Correlation Coefficient between two methods of HU calculation | 0.949 ** |
Correlation is significant at the 0.05 level (2-tailed)
Correlation is significant at the 0.01 level (2-tailed)
Pearson’s statistical test revealed that there was a positive correlation between HU and Average Gray Scale in all cases and as it can be observed in Table 2, the correlation increases when radiation time increases.
Discussion
Since available human samples were not sufficient to carry out this study and regarding ethical concerns, we decided to use sheep mandible as a holding media for performing CT. The sheep mandible is similar to human mandible in format size and structure and unavailability of sufficient human mandible, the mandible of sheep has been used in several in-vitro experiments on osteotomies and rigid internal fixation as well as dental implantology [14,15].
We used wax on surface of the bone because a wax layer attenuates X-Ray to some extent, just like soft tissue. Dental wax [16,17] and different acrylic [18,19] are among the most frequent materials which have been used for simulating soft tissues during in- vitro studies. Recently, Schropp et al. examined the validity of wax and acrylic resin as soft-tissue simulation. They concluded that for in vitro radiographic studies, the radiographic density of average human cheek could be simulated by 13-17 mm thickness of dental wax or 14.5 mm thickness of acrylic resin [20].
We used Coronal cross section for the estimation of HU because the mandibular buccal and lingual cortical plates as well as interstitial cancellous space can affect separately in the calculation of HU. Turkyilmaz et al. [21] used this method (investigation of HU in coronal views) to calculate HU in order to study the spots between HU and the highest torque as well as frequency augmentation.
The increase of correlation coefficient has a linear correlation with the increase of radiation time since, as the radiation time increases, the effect of soft tissue on the image decreases. Hence, the graphic data are mostly indicative of hard tissue situation.
Other factors affecting the correlation between the data are KVP and the distance between x-ray tube and the sample.
Kvp and its effects have not been addressed in this study because of its complexity as well as time limitation; however, RVG machine used in this study also suffered from the limitation in selecting Kvp. Clearly, the higher the Kvp is (but within the acceptable range in dentistry), the higher its penetration power will be, and the lesser amount of its energy will be absorbed by the soft tissue. Consequently, the increase of kVp will probably result in increased relationship between gray level and HU.
The factor of distance should also be investigated as the distance between the X-ray source and the object because as the changes are trivial (about 2 cm as compared to 30-40 cm), its effect can be negligible based on the inverse-square law. However, the absence of a significant correlation between Gray Scale and HU might be attributed to the changes in this factor.
As the X-ray scatters and the image gets more opaque, the soft tissue inevitably affects the results and this, in turn, reduces the correlation among the data. The researchers are suggested to increase kVp in the future studies in order to reduce the influence of soft tissue.
To the best of authors’ knowledge, no exact similar studies have been conducted to analyze the relationship between HU in CT and Gray Scale in direct digital radiography; however, some studies resemble ours which will be briefly discussed here.
Our findings were also in agreement with the findings of Morea et al. (2010). They evaluated quantitative variations of in-vitro mineral density by varying the exposure time of direct digital radiographs using a computer-assisted densitometric image analysis (CADIA) program. They suggested that as radiation time increased, CADIA calculated more accurate results; however, the radiation time should not be increased too much (more than relative film latitude), because the data would be lost [22].
GUL et al. [23] (2008) investigated the relationship between optical density in Panoramic scanning images and HU of the same areas in CT scan. They suggested a linear relationship between these two measurement methods which is in agreement with the results yielded by the current study.
Norton and Gamble (2001) proposed an image-based bone density classification that used grey-scale values (HU) from CT. They demonstrated that an objective scale of bone density based on the Houndsfield scale, could be established and there was a strong correlation between bone density value and subjective quality score as well as between the bone density score and the region of the mouth. They reported the mean bone density from CT was 682 HU for 139 sites. They recorded the mean bone densities in the anterior mandible, the posterior mandible, the anterior maxilla, the posterior maxilla were 970, 669, 696 and 417 HU, respectively [24].
Shapurian et al. (2006) reported that the average bone density values in the anterior mandible, the anterior maxilla, the posterior maxilla, the posterior mandible were 559, 517, 333 and 321 HU for 219 implant sites, respectively [25]. Since the Hounsfield scale varies according to the scanner used, the determination of HU is not helpful for pre-operative evaluation of bone density.
Mah et al. (2008) carried out an in-vitro study to investigate the relationship between Gray Scale in CBCT and HU and the results showed that the method could be a simple method for estimating HU through Gray Scale obtained by CBCT [26]. A study conducted by Nomura et al. (2010) revealed that there was a high correlation between the voxel values of CBCT and the CT numbers of multi-slice CT [27].
Miles and Danforth concluded that CBCT grey levels were inaccurate to rely upon for decisions on implant placement. The values assigned to the voxels (volume elements) are relative HU and cannot be used precisely to estimate bone density [28].
Nackaerts et al. demonstrated that density profiles of conventional CT showed stable HU values whereas intensity values in CBCT images are not reliable because the values are influenced by the device used, imaging parameters and positioning [29]. So, it seems that HU of CT images are more reliable than CBCT.
Sakakura et al. (2006) took advantage of Direct Digital Imaging and Gray Scale analysis by software. These results also verify Gray Scale estimation and its application for estimating bone quality; however, standardization or application of a more accurate method for establishing the relationship of Gray Scale numbers has not been used [30].
Conclusion
The findings reveal that HU or bone density of the mandible can be approximately estimated through the average gray levels of digital intra-oral radiographs, and as the radiation time increases (to the extent that the data is not lost and the measurement accuracy is not reduced), the correlation and calculation accuracy will increase. Moreover, in spots where there is no completely distinguishable opaque structure other than the trabecula of the cancellous bone (such as edentulous areas), mean Gray Scale measurement can more essentially show bone density or HU of the area.
There is a remarkable reduction of X-ray radiation dose in this method compared to other common bone density measurement methods. It is more reasonable for the risk groups whose bone density is diagnosed to be insufficient by this method, to try more accurate tests for evaluating osteoporosis or other systemic diseases.
Finally, this method is assessed to be effective, convenient and useful for obtaining a relative and acceptable measurement of bone quality prior to implantation.
Acknowledgement
The authors would like to thank the Vice-chancellor of Shiraz University of Medical Science for supporting this research (Grant no. 1323). This article is based on a thesis by Dr. Mohammad Jazayeri, under supervision of Dr. Leila Khojastepour.
Conflict of Interest:None.
References
- 1.Compston J. Bone quality: what is it and how is it measured? Arquivos Brasileiros de Endocrinologia & Metabologia. 2006;50:579–85. doi: 10.1590/S0004-27302006000400003. [DOI] [PubMed] [Google Scholar]
- 2.Fyhrie DP. Summary--Measuring “bone quality”. J Musculoskelet Neuronal Interact. 2005;5:318–20. [PubMed] [Google Scholar]
- 3.Licata A. Bone density vs bone quality: what’s a clinician to do? Cleve Clin J Med. 2009;76:331–6. doi: 10.3949/ccjm.76a.08041. [DOI] [PubMed] [Google Scholar]
- 4.Sievanen H, Kannus P, Jarvinen TL. Bone quality: an empty term. PLoS Med. 2007;4:e27. doi: 10.1371/journal.pmed.0040027. [DOI] [PMC free article] [PubMed] [Google Scholar]
- 5.Minkin C, Marinho VC. Role of the osteoclast at the bone-implant interface. Adv Dent Res. 1999;13:49–56. doi: 10.1177/08959374990130011401. [DOI] [PubMed] [Google Scholar]
- 6.Sakka S, Coulthard P. Bone quality: a reality for the process of osseointegration. Implant Dent. 2009;18(6):480–5. doi: 10.1097/ID.0b013e3181bb840d. [DOI] [PubMed] [Google Scholar]
- 7.Santiago RC, de Paula FO, Fraga MR, Picorelli Assis NM, Vitral RW. Correlation between miniscrew stability and bone mineral density in orthodontic patients. Am J Orthod Dentofacial Orthop. 2009;136:243–50. doi: 10.1016/j.ajodo.2007.08.031. [DOI] [PubMed] [Google Scholar]
- 8.Misch CE. Bone density: a key determinant for treatment planning. Contemporary implant dentistry. 3rd ed. St Louis: Mosby; 2007. pp. 130–146. [Google Scholar]
- 9.Johansson P, Strid K. Assessment of bone quality from cutting resistance during implant surgery. International Journal of Oral and Maxillofacial Implants. 1994;9:279–88. [Google Scholar]
- 10.Scarfe WC, Farman AG, Sukovic P. Clinical applications of cone-beam computed tomography in dental practice. J Can Dent Assoc. 2006;72:75–80. [PubMed] [Google Scholar]
- 11.Nackaerts O, Maes F, Yan H, Couto Souza P, Pauwels R, Jacobs R. Analysis of intensity variability in multislice and cone beam computed tomography. Clin Oral Implants Res. 2011;22:873–9. doi: 10.1111/j.1600-0501.2010.02076.x. [DOI] [PubMed] [Google Scholar]
- 12.Naitoh M, Aimiya H, Hirukawa A, Ariji E. Morphometric analysis of mandibular trabecular bone using cone beam computed tomography: an in vitro study. Int J Oral Maxillofac Implants. 2010;25:1093–8. [PubMed] [Google Scholar]
- 13.Merheb J, Van Assche N, Coucke W, Jacobs R, Naert I, Quirynen M. Relationship between cortical bone thickness or computerized tomography-derived bone density values and implant stability. Clin Oral Implants Res. 2010;21:612–7. doi: 10.1111/j.1600-0501.2009.01880.x. [DOI] [PubMed] [Google Scholar]
- 14.Gomes PP, Guimaraes Filho R, Mazzonetto R. Evaluation of the bending strength of rigid internal fixation with absorbable and metallic screws in mandibular ramus sagittal split osteotomy: in vitro study. Pesqui Odontol Bras. 2003;17:267–72. doi: 10.1590/s1517-74912003000300012. [DOI] [PubMed] [Google Scholar]
- 15.Trisi P, Todisco M, Consolo U, Travaglini D. High versus low implant insertion torque: a histologic, histomorphometric, and biomechanical study in the sheep mandible. Int J Oral Maxillofac Implants. 2011;26:837–49. [PubMed] [Google Scholar]
- 16.Kayipmaz S, Sezgin OS, Saricaoglu ST, Can G. An in vitro comparison of diagnostic abilities of conventional radiography, storage phosphor, and cone beam computed tomography to determine occlusal and approximal caries. Eur J Radiol. 2011;80:478–82. doi: 10.1016/j.ejrad.2010.09.011. [DOI] [PubMed] [Google Scholar]
- 17.Ulusu T, Bodur H, Odabas ME. In vitro comparison of digital and conventional bitewing radiographs for the detection of approximal caries in primary teeth exposed and viewed by a new wireless handheld unit. Dentomaxillofac Radiol. 2010;39:91–4. doi: 10.1259/dmfr/15182314. [ PMC Free Article] [DOI] [PMC free article] [PubMed] [Google Scholar]
- 18.Kamburoglu K, Senel B, Yuksel SP, Ozen T. A comparison of the diagnostic accuracy of in vivo and in vitro photostimulable phosphor digital images in the detection of occlusal caries lesions. Dentomaxillofac Radiol. 2010;39:17–22. doi: 10.1259/dmfr/91657756. [ PMC Free Article] [DOI] [PMC free article] [PubMed] [Google Scholar]
- 19.Senel B, Kamburoglu K, Ucok O, Yuksel SP, Ozen T, Avsever H. Diagnostic accuracy of different imaging modalities in detection of proximal caries. Dentomaxillofac Radiol. 2010;39:501–11. doi: 10.1259/dmfr/28628723. [ PMC Free Article] [DOI] [PMC free article] [PubMed] [Google Scholar]
- 20.Schropp L, Alyass NS, Wenzel A, Stavropoulos A. Validity of wax and acrylic as soft-tissue simulation materials used in in vitro radiographic studies. Dentomaxillofac Radiol. 2012;41:686–90. doi: 10.1259/dmfr/33467269. [ PMC Free Article] [DOI] [PMC free article] [PubMed] [Google Scholar]
- 21.Turkyilmaz I, McGlumphy EA. Influence of bone density on implant stability parameters and implant success: a retrospective clinical study. BMC Oral Health. 2008;8:32. doi: 10.1186/1472-6831-8-32. [ PMC Free Article] [DOI] [PMC free article] [PubMed] [Google Scholar]
- 22.Morea C, Dominguez GC, Coutinho A, Chilvarquer I. Quantitative analysis of bone density in direct digital radiographs evaluated by means of computerized analysis of digital images. Dentomaxillofac Radiol. 2010;39:356–61. doi: 10.1259/dmfr/13093703. [ PMC Free Article] [DOI] [PMC free article] [PubMed] [Google Scholar]
- 23.Gu L, Yu LY, Zhou Y, Xie C. Application of the bone quality of pre-implanted mandible through optical density measurement. Shanghai Kou Qiang Yi Xue. 2008;17:479–82. [PubMed] [Google Scholar]
- 24.Norton MR, Gamble C. Bone classification: an objective scale of bone density using the computerized tomography scan. Clin Oral Implants Res. 2001;12:79–84. doi: 10.1034/j.1600-0501.2001.012001079.x. [DOI] [PubMed] [Google Scholar]
- 25.Shapurian T, Damoulis PD, Reiser GM, Griffin TJ, Rand WM. Quantitative evaluation of bone density using the Hounsfield index. Int J Oral Maxillofac Implants. 2006;21:290–7. [PubMed] [Google Scholar]
- 26.Mah P, Reeves TE, McDavid WD. Deriving Hounsfield units using grey levels in cone beam computed tomography. Dentomaxillofac Radiol. 2010;39:323–35. doi: 10.1259/dmfr/19603304. [ PMC Free Article] [DOI] [PMC free article] [PubMed] [Google Scholar]
- 27.Nomura Y, Watanabe H, Honda E, Kurabayashi T. Reliability of voxel values from cone-beam computed tomography for dental use in evaluating bone mineral density. Clin Oral Implants Res. 2010;21:558–62. doi: 10.1111/j.1600-0501.2009.01896.x. [DOI] [PubMed] [Google Scholar]
- 28.Miles DA, Danforth RA. A clinician’s guide to understanding cone beam volumetric imaging (CBVI) Peer-Reviwed Publication-Academy of Dental Therapeutics and Stomatology 2008. 2007 [Google Scholar]
- 29.Nackaerts O, Jacobs R, Horner K, Zhao F, Lindh C, Karayianni K, et al. Bone density measurements in intra-oral radiographs. Clin Oral Investig. 2007;11:225–9. doi: 10.1007/s00784-007-0107-2. [DOI] [PubMed] [Google Scholar]
- 30.Sakakura CE, Giro G, Goncalves D, Pereira RM, Orrico SR, Marcantonio E Jr. Radiographic assessment of bone density around integrated titanium implants after ovariectomy in rats. Clin Oral Implants Res. 2006;17:134–8. doi: 10.1111/j.1600-0501.2005.01224.x. [DOI] [PubMed] [Google Scholar]


