

Abstract
Background
Obesity and insulin resistance are associated with neuropathology and cognitive decline in Alzheimer’s disease (AD).
Objective
Ecto-nucleotide pyrophosphatase/phosphodiesterase 2, also called autotaxin, is produced by beige adipose tissue, regulates metabolism, and is higher in AD prefrontal cortex (PFC). Autotaxin may be a novel biomarker of dysmetabolism and AD.
Methods
We studied Alzheimer’s Disease Neuroimaging Initiative participants who were cognitively normal (CN; n=86) or had mild cognitive impairment (MCI; n=135) or AD (n=66). Statistical analyses were conducted using SPSS software. Multinomial regression analyses tested if higher autotaxin was associated with higher relative risk for MCI or AD diagnosis, compared to the CN group. Linear mixed model analyses were used to regress autotaxin against MRI, FDG-PET, and cognitive outcomes. Spearman correlations were used to associate autotaxin and CSF biomarkers due to non-normality. FreeSurfer 4.3 derived mean cortical thickness in medial temporal lobe and prefrontal regions of interest.
Results
Autotaxin levels were significantly higher in MCI and AD. Each point increase in log-based autotaxin corresponded to a 3.5 to 5 times higher likelihood of having MCI and AD, respectively. Higher autotaxin in AD predicted hypometabolism in the medial temporal lobe [R2=0.343, p<0.001] and PFC [R2=0.294, p<0.001], and worse performance on executive function and memory factors. Autotaxin was associated with less cortical thickness in PFC areas like orbitofrontal cortex [R2=0.272, p<0.001], as well as levels of total tau, p-tau181, and total tau/Aβ1–42.
Conclusions
These results are comparable to previous reports using insulin resistance. CSF autotaxin may be a useful dysmetabolism biomarker for examining AD outcomes and risk.
Keywords: diabetes mellitus, fluorodeoxyglucose F18, insulin resistance, mild cognitive impairment, MRI, positron emission tomography
INTRODUCTION
Recent studies link obesity and metabolic dysfunction to decreased gray matter volume, less glucose metabolism, and other factors that contribute to Alzheimer’s disease (AD)[1–4]. Obesity may give rise to cerebral ischemia, which in turn is associated with brain tissue degeneration [5]. Additionally, obese individuals are more likely to have higher insulin resistance (IR), defined as the progressive inability for insulin to bind to its receptor [6]. IR is correlated with temporal and frontal amyloid deposition and brain atrophy in late middle-aged participants at risk for AD [2, 7], as well as less glucose metabolism in cognitively normal (CN) elders [8] and AD participants [1]. Resulting oxidative stress may induce cell damage in the brain [9].
Numerous studies have also linked obesity with neuroinflammation and subsequent neurodegeneration, as induced by blood-brain barrier damage or microglial activation in the hippocampi of mice [9, 10]. Rats fed a high fat diet showed increased microglial activation as well as higher levels of the chaperone Hsp72, which are neuroprotective responses to brain injury [11]. Such high fat feeding also upregulates the expression of proinflammatory cytokines in the hypothalamus of rodents [12]. High levels of C-reactive protein, an inflammation marker, have been associated with increased white matter damage in individuals free of dementia [13]. Amylin oligomers and plaques were present in diabetic patients’ temporal lobe gray matter and absent in controls [14]. In a subsequent study, rats that overexpressed human amylin in the pancreas had elevated levels of brain pro-inflammatory cytokines, as well as suppressed anti-inflammatory expression [15].
While it is increasingly clear that metabolic dysregulation may play a role in AD, there are currently no established biomarkers in cerebrospinal fluid (CSF) that may reflect central metabolic dysfunction. CSF insulin may not be a reliable biomarker because individuals with type 2 diabetes show reduced insulin uptake in the brain, potentially due to reduced transport across the blood-brain barrier when an individual maintains constant high blood insulin levels [8]. Ecto-nucleotide pyrophosphatase/phosphodiesterase 2 (ENPP2), also known as autotaxin, is an enzyme derived from beige adipose that aids in glucose metabolism regulation and adipose tissue expansion [16] and has been shown to be elevated in the brains of AD subjects versus controls [17]. Autotaxin expression is an outcome of the accumulation of triglycerides in the adipocyte [18]. Autotaxin is mostly expressed in the human brain, placenta, ovary, and small intestine, and stimulates the formation of lysophosphatidic acid (LPA) [19].
In the central nervous system, leptomeningeal cells in the pia mater, as well as astrocytes and oligodendrocytes, are hypothesized to secrete autotaxin [20]. LPA is a lipid-based growth factor and signaling molecule found in all mammalian cells, which promotes the generation of tissue fibrosis in vivo and in vitro, as well as neurotransmitter release and cell contraction and aggregation via utilization of G protein-coupled receptors [21, 22]. Rat neuronal cell culture work indicates that LPA administration leads to cortical folding and premature differentiation of cells [22]. Normal weight mice who were injected with LPA showed deficits in insulin response to glucose, and pancreatic beta-cells showed impaired insulin release when exposed to LPA [23]. Intriguingly, rats administered LPA showed increased blood-brain barrier permeability, suggesting that the effects of elevated autotaxin levels may be due to central and systemic factors [24]. EDG-2, an LPA receptor gene, is overexpressed in growing preadipocytes and may be an important regulator of adipose tissue development [25]. Obese women display positive correlations between serum autotaxin and fasting glucose [26]. Curiously, body mass index (BMI) and autotaxin showed no significant correlation in this cohort, indicating that autotaxin may be more of a product of IR, as opposed to the extent of obesity in an individual.
Importantly, some evidence suggests that autotaxin may play a role in AD, whereas the role of other metabolic biomarkers may be less clear. Individuals with AD-like dementia showed significantly higher gene expression of autotaxin in the frontal cortex, as compared to control brains [17]. Additional research is warranted to elucidate the association of high autotaxin levels with established AD biomarkers, cognitive function, and prefrontal cortex (PFC) and medial temporal lobe (MTL) brain volume and glucose metabolism in AD. PFC was a target area because our previous associations with IR are most consistent in that region [7, 8, 27–29], and that obesity across the lifespan is consistently associated with prefrontal atrophy [3]. Additionally, autotaxin in AD has only been examined in frontal cortices [17]. MTL is relevant to AD onset and progression, and we have shown that it is also sensitive to metabolic dysfunction.
In this study, data from the Alzheimer’s Disease Neuroimaging Initiative (ADNI) were used to examine CSF autotaxin peptide levels among 287 individuals (75.06 ± 6.89 years of age) who were diagnosed as being CN or having late mild cognitive impairment (MCI) due to AD or early AD. Autotaxin was regressed against cortical thickness (CT) and fluorodeoxyglucose (FDG) values in PFC and MTL, to examine if autotaxin was related to frontal and temporal atrophy and hypometabolism akin to our findings with IR [7, 8, 27, 28]. Relationships with neuropsychological function and traditional CSF biomarkers were also ascertained. The purpose of this study was to determine if CSF-derived autotaxin may be a biomarker for metabolic dysfunction in the brain and could be associated with AD neurological outcomes.
MATERIALS AND METHODS
Participants
Data from 287 adults aged 56 to 89 were obtained from the Alzheimer’s Disease Neuroimaging Initiative (ADNI) database (http://adni.loni.usc.edu). The ADNI was launched in 2003 as a public-private partnership, led by Principal Investigator Michael W. Weiner, MD. The primary goal of ADNI has been to test whether serial magnetic resonance imaging (MRI), positron emission tomography (PET), other biological markers, and clinical and neuropsychological assessment can be combined to measure the progression of MCI and early AD. For up-to-date information, see http://www.adni-info.org. Written informed consent was obtained from all ADNI participants at their respective ADNI sites. The ADNI protocol was approved by site-specific institutional review boards. Baseline mass spectrometry data for autotaxin was available for 86 CN, 135 MCI, and 66 AD participants. By month 24, MCI participants were classified as either remaining stable (MCI-S, n=80) or progressing to AD (MCI-P, n=55). CN subjects had MMSE scores between 24 and 30, a CDR score of 0, and no dementia. Participants were classified as MCI if they had an MMSE score between 24 and 30, a CDR score of 0.5, complaints of memory loss, and objective memory loss measured on the Wechsler Memory Scale Logical Memory II. Probable AD was defined as MMSE scores between 20 and 26, a CDR score of 0.5 or 1.0, and meeting NINCDS/ADRDA criteria for probable AD. For additional information, see ADNI Procedures Manual (http://adni.loni.usc.edu). Details of the consensus procedure by the ADNI Conversion Committee are described elsewhere[1]. Other baseline data included demographics, structural MRI for PFC and MTL CT, neural glucose metabolism as determined by FDG uptake, APOE4 genotype, CSF and serum biomarkers, BMI, and neuropsychological performance. While amyloid imaging was also of interest, baseline scans were not analyzed due to small sample size (n=20).
Mass spectrometry and fasting glucose
Data were downloaded from the Biomarkers Consortium CSF Proteomics MRM dataset. As described previously[29], the ADNI Biomarkers Consortium Project investigated the extent to which selected peptides, measured with mass spectrometry (MS), could discriminate among disease states. Briefly, Multiple Reaction Monitoring-MS (MRM-MS) was used for targeted quantitation of 567 peptides representing 221 proteins in a single run (Caprion Proteome Inc., Montreal, QC, Canada). Analyte values of ENPP2 are in arbitrary signal units on a natural log scale. Fasting insulin was assayed using a plasma multiplex immunoassay panel (http://adni.loni.usc.edu/). Fasting glucose was derived from a standard laboratory test. Insulin and glucose were used to calculate the homeostatic model assessment, HOMA-IR [30]. Analyses for this report focused on the autotaxin peptide WWGGQPLWITATK. This peptide performed better in predicting glucose metabolism and cortical thickness than ENPP2 SYPEILTLK in preliminary stepwise regression analyses. To confirm that autotaxin reflected central dysmetabolism, established metabolic and inflammatory biomarkers in CSF were regressed against autotaxin, including insulin-like growth factor binding protein 2 (IGFBP2) peptides, pyruvate kinase isozymes M1/M2, neurosecretory protein VGF, fructose-bisphosphate aldolase A, cholecystokinin and IL-6 receptor [31, 32]. These were the only metabolic or metabolic-related indices available in the CSF for ADNI.
APOE genotype
The ADNI Biomarker Core at the University of Pennsylvania conducted APOE ε4 genotyping. We characterized participants as being “non-APOE4” (i.e., zero APOE ε4 alleles) or “APOE4” (i.e., one to two APOE ε4 alleles).
Amyloid and tau CSF biomarkers
CSF sample collection, processing, and quality control of p-tau181, total tau, and Aβ1-42 are described in the ADNI1 protocol manual (http://adni.loni.usc.edu/) and Shaw et al. [33].
Clinical and cognitive assessments
Baseline global cognition and assessment scores included the Mini-Mental State Examination (MMSE), clinical dementia rating-sum of boxes (CDR-sob), and AD assessment scale-cognitive subscale 11 (ADAS-cog11). The ADNI1 procedures manual describes diagnostic criteria (http://adni.loni.usc.edu/). The various tests that comprise executive function and memory factor are described elsewhere[34].
MRI
T1-weighted images, collected on 1.5T MR imaging units with a resolution of 1.25 × 1.25 × 1.25 mm [35], were pre-processed using FreeSurfer 4.3 [36]. As described previously [2], this software corrects for motion, deskulls, bias corrects, segments, and parcellates gray and white matter into labeled cortical areas. We chose to examine CT instead of volume, as CT is typically considered a more sensitive index of gray matter pathology in participants who are at-risk [37] or have AD [38]. To contain type 1 error, we first explored one broad region of interest (ROI) in bilateral prefrontal cortex and one ROI in bilateral medial temporal lobe, followed by finer grained associations in sub-ROI if an initial omnibus analysis in a given broad ROI was significant. In the PFC, bilateral sub-ROIs included: 1) pars orbitalis; 2) pars triangularis; 3) caudal middle frontal; 4) rostral middle frontal; 5) superior frontal; 6) frontal pole; 7) lateral orbitofrontal; and 8) medial orbitofrontal. These areas are very similar to ROI chosen in previous reports on metabolic dysfunction with regional amyloid [2] and FDG [1]. In the MTL, bilateral sub-ROI included hippocampal volume (where CT is not calculated by FreeSurfer) and CT in: 1) medial temporal gyrus; 2) parahippocampal gyrus; and 3) entorhinal cortex. Bilateral pre-central gyrus was chosen as a control ROI, an area that shows little association with dysmetabolism and brain atrophy in middle-aged participants [7] or glucose metabolism in AD[1].
FDG-PET
Acquisition is described elsewhere [27, 39]. Images were resliced to a 1.5 mm3 voxel resolution in a 160 × 160 × 96 spatial matrix, intensity normalized to pons to derive the standardized uptake volume ratio (SUVR), smoothed using an 8mm Gaussian kernel, and normalized to Montreal Neurological Institute space. Due to the poorer native resolution of the FDG-PET images and smoothing to reduce noise, only the two broad ROI in PFC and medial temporal lobe were used. Similarly broad ROI have been used to examine relationships between dysmetabolism and FDG-PET [27].
Statistical analyses
All statistical analyses were conducted using SPSS 23.0 software (IBM Corp., Armonk, NY). All analysis models except for cognition included the following covariates: age at baseline, sex, BMI, APOE ε4 genotype, and either baseline diagnosis or MCI conversion. The random effect of Subject was also covaried. For executive function, memory and global assessments, education was added as a covariate but not baseline diagnosis or MCI conversion, because cognitive assessments directly inform how participants are clinically classified. Linear mixed models, followed by least significant differences (LSD) post-hoc tests, were used to test if autotaxin levels differed by baseline diagnosis (CN, MCI, AD) or MCI conversion (MCI-S or MCI-P). Multinomial regression analyses tested if higher autotaxin was associated with higher relative risk ratios for an MCI or AD diagnosis, with CN as the reference group. Logistic regression was similarly used to assess increased risk of being MCI-P relative to MCI-S based on autotaxin.
Mixed model analyses were also performed to regress autotaxin against metabolic, MRI, FDG-PET, and cognitive outcomes. The main effect of autotaxin and its interaction with baseline diagnosis or MCI conversion were tested in a given model. Previous work has suggested that systemic IR is associated with neural outcomes like less regional FDG-PET in AD, but show different relationships in MCI-S or MCI-P depending on the brain region [27]. For the MRI analyses, to robustly contain type 1 error, an initial multivariate repeated measures omnibus was initially conducted for a broad PFC or medial temporal ROI, as described elsewhere [40], where each ROI was composed of several sub-ROI selected a priori based on our prior work [1, 2]. Briefly, this technique determines if there is an overall significant association with all sub-ROIs, allowing subsequent analyses to investigate each sub-ROI to determine where omnibus signal was derived without Bonferroni or similar corrections [41]. Even so, as a further type 1 error check described by Willette et al. [27], Holm-Bonferroni correction [42] was used to adjust the family-wise error rate to 0.05. Specifically, for a significant follow-up interaction for a given sub-ROI, autotaxin levels were regressed against CT for CN, MCI, and AD separately, or 3 null hypotheses per ROI. A p value of 0.017 was needed among one of the groups to achieve significance, followed by 0.025 and 0.050.
Lastly, as described by the ADNI Biomarker Core [29], CSF and plasma analyte values were log-transformed to achieve normality. With the exception of AD biomarkers, all variables had homoscedastic variance and a normal distribution. Due to violations in regression diagnostics for p-tau181, total tau, and Aβ1-42 (see below), the non-parametric Spearman’s statistic was used to correlate autotaxin and CSF biomarker values.
RESULTS
Demographics and data summary
Summary information is listed in Table 1. All variables were normally distributed except for Aβ1-42 (D=0.130, p<0.001), Total tau (D=0.121, p<0.001), and p-tau (D=0.104, p<0.001), as fit against normal Q-Q plots was non-linear. Data transforms did not resolve non-normality. Non-parametric correlations were therefore conducted between autotaxin and CSF amyloid and tau biomarkers.
Table 1.
Demographics and sample characteristics
| CN | MCI | AD | MCI-S | MCI-P | |
|---|---|---|---|---|---|
| Age | 75.70 ± 5.54 | 74.69 ± 7.35 | 74.98 ± 7.57 | 74.74 ± 6.96 | 74.63 ± 7.94 |
| Female | 42 | 44 | 29 | 25 | 19 |
| Male | 44 | 91 | 37 | 55 | 36 |
| Education | 15.64 ± 2.97 | 16.00 ± 2.96 | 15.11 ± 2.96 | 16.33 ± 2.91 | 15.51 ± 3.00 |
| APoE ε4- | 65 | 64 | 19 | 41 | 23 |
| APoE ε4+ | 21 | 71 | 47 | 39 | 52 |
| CDR-sob | 0.02 ± 0.11 | 1.56 ± 0.88 | 4.34 ± 1.56 | 1.41 ± 0.79 | 1.77 ± 0.97 |
| MMSE | 29.05 ± 1.02 | 26.91 ± 1.74 | 23.52 ± 1.85 | 27.35 ± 1.62 | 26.27 ± 1.72 |
| ADAS-cog11 | 6.05 ± 2.90 | 11.72 ± 4.33 | 18.88 ± 6.71 | 10.70 ± 4.05 | 13.19 ± 4.32 |
| Memory factor | 0.98 ±0.50 | −0.15±0.57 | −0.91±0.55 | 0.04 ± 0.57 | −0.43 ± 0.45 |
Numbers represent frequency or unadjusted mean ± SD. MCI-S, Stable MCI at 12 months. MCI-P, Progression to AD from MCI at 12 months.
Baseline diagnosis: differences in autotaxin levels
Linear mixed models showed a main effect of baseline clinical diagnosis on autotaxin [F(2,286)=3.100, p=0.047]. There was a significant increase in log-scaled autotaxin from CN to either MCI [Mean Difference±SE=0.078±0.036, p=0.029] or AD [Mean Difference±SE=0.094±0.043, p=0.029], but not between MCI and AD [Mean Difference±SE=0.016±0.038, p=0.665].
As a follow-up analysis, multinomial logistic regression was then used to examine if CSF autotaxin expression predicted an increased likelihood of being MCI or AD. The reference group was CN. The likelihood ratio statistic [χ2=5.990, p=0.050] indicated that higher autotaxin levels predicted a higher Odds Ratio for being MCI [β±SE=1.248±0.605, OR=3.485, 95% CI=1.065 to 11.397, Wald=4.264, p=0.039] or AD [β±SE=1.597±0.747, OR=4.940, 95% CI=1.134 to 21.351, Wald=4.574, p=0.032]. These results suggest that autotaxin levels were higher in memory impaired versus CN participants, and that per point increase in log-based autotaxin values corresponded to a roughly 3.5 to 5 times increase in the odds of having some degree of clinically relevant memory impairment. For MCI conversion by 24 months, there was no significant difference between MCI-S and MCI-P. Baseline autotaxin levels also did not predict likelihood of MCI conversion [χ2=0.177, p=0.674].
Associations of autotaxin with metabolic and inflammatory indices
Next, to validate autotaxin as an energy metabolism biomarker, CSF autotaxin levels were regressed against total body mass, peripheral and CSF metabolic and inflammatory biomarkers (Table 2), as well as used to predict likelihood of having pre-diabetes or type 2 diabetes. We found that higher autotaxin was related to higher fasting glucose, several established biomarkers of metabolism in the CSF, CSF interleukin-6, and that higher levels per point increase reflected a 300% greater likelihood of having pre-diabetes or type 2 diabetes.
Table 2.
The association of autotaxin with CSF metabolic and inflammatory biomarkers.
| β ± SE | F value | p value | |
|---|---|---|---|
| Fructose-bisphosphate aldolase A | 0.415±0.097 | 18.551 | <0.001 |
| Cholecystokinin | 0.378±0.123 | 9.369 | 0.002 |
| Pyruvate Kinase Isozymes M1/M2 | 0.576±0.108 | 28.364 | <0.001 |
| Neurosecretory protein VGF | 0.574±0.162 | 12.614 | <0.001 |
| IGFBP2 | 0.595±0.056 | 114.899 | <0.001 |
| IL-6 receptor | |||
| CN | 0.102±0.011 | 93.830 | <0.001 |
| MCI | 0.067±0.010 | 45.705 | <0.001 |
| AD | 0.097±0.015 | 41.301 | <0.001 |
Model estimate beta values and SE of autotaxin for CSF metabolites and inflammation biomarkers.
ROI analysis: PFC and MTL CT
For bilateral PFC CT, a multivariate omnibus was conducted in one broad PFC ROI incorporating several sub-ROI from FreeSurfer areas, to minimize type 1 error [41]. The main effect of autotaxin and its interaction with baseline diagnosis were investigated. The interaction tested if autotaxin differentially predicted less CT among CN, MCI, or AD participants. There was a marginal, within-subject Regions × Baseline Diagnosis × Autotaxin interaction after Huynh-Feldt correction [F(14,1200)=1.784, p=0.066], which became significant after removing one outlier with a high autotaxin value (18.31) [F(14,1197)=2.031, p=0.032]. As indicated in Table 3, even after applying Holm-Bonferroni correction, higher autotaxin was associated with thinner CT in most PFC sub-ROI for AD participants, such as medial orbitofrontal cortex (Fig. 1A) and only in Pars Orbitalis for MCI, while the CN group showed negative and positive associations. By contrast, the omnibus for the one broad medial temporal ROI was non-significant, where further analyses were not pursued to guard against type 1 error. In the pre-central gyrus control region, there was no significant main effect of autotaxin or interaction with baseline diagnosis.
Table 3.
The interaction of clinical diagnosis and autotaxin on prefrontal cortex thickness.
| CN | MCI | AD | ||||
|---|---|---|---|---|---|---|
| Cortical Thickness | T value | β ± SE | T value | β ± SE | T value | β ± SE |
| Pars Orbitalis | −1.519 | −0.073 ± 0.048 | −2.188 | −0.073 ± 0.034* | −4.253 | −0.230 ± 0.054*** |
| Pars Triangularis | −4.300 | −0.062 ± 0.014*** | −1.914 | −0.041 ± 0.021 | −4.178 | −0.102 ± 0.024*** |
| Rostral Middle Frontal | −0.073 | −0.001 ± 0.013 | −1.592 | −0.028 ± 0.018 | −4.180 | −0.090 ± 0.022*** |
| Lateral Orbitofrontal | 3.214 | 0.046 ± 0.014** | −0.260 | −0.005 ± 0.020 | −5.306 | −0.122 ± 0.023*** |
| Medial Orbitofrontal | 1.178 | 0.020 ± 0.017 | −0.664 | −0.014 ± 0.021 | −4.922 | −0.127 ± 0.026*** |
| Caudal Middle Frontal | −1.208 | −0.015 ± 0.013 | 1.146 | 0.021 ± 0.019 | 0.667 | 0.014 ± 0.021 |
| Superior Frontal | −3.596 | −0.062 ± 0.017** | 0.178 | 0.004 ± 0.025 | −1.705 | −0.050 ± 0.029 |
| Frontal Pole | 1.153 | 0.023 ± 0.020 | 1.378 | 0.034 ± 0.025 | −10.925 | −0.344 ± 0.031*** |
p<0.05,
p<0.01,
p<0.001
Model estimate beta values and SE of autotaxin for prefrontal CT ROI. T values are for each clinical group. For each ROI, Holm-Bonferroni correction required successive p values of 0.017, 0.025, and 0.050 for a given diagnostic group fit-line to be considered significant.
Figure 1.
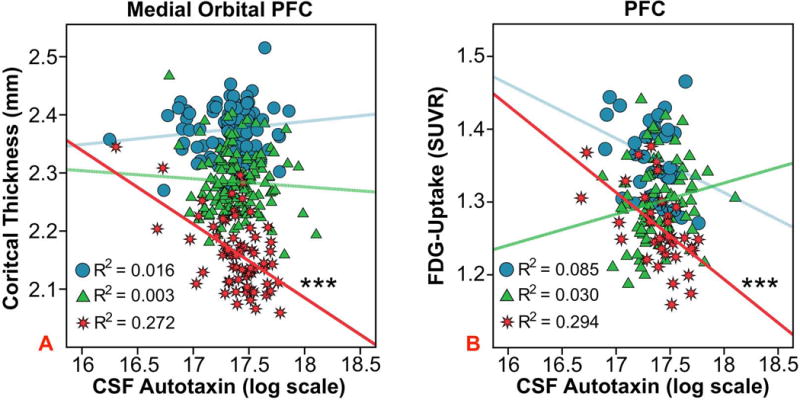
Autotaxin and PFC region of interest analyses. The association between CSF autotaxin and baseline bilateral medial orbital PFC cortical thickness (A) or bilateral PFC FDG-PET glucose uptake (B), an index of glucose metabolism, among baseline diagnosis groups. The “blue circle”, “green triangle”, and “red star” symbols correspond to CN, MCI, and AD participants respectively. The R2 value refers to the proportion of variance in CT or FDG-PET uptake explained by autotaxin for a given group. ***p < 0.001.
ROI analysis: PFC and MTL glucose metabolism
For FDG-PET, an Autotaxin * Baseline Diagnosis interaction [F(2,146)=3.106, p=0.048] showed that higher autotaxin predicted less glucose uptake in the broad PFC ROI for AD subjects [β±SE=−0.127±0.027, t(1,35)= −4.708, p<0.001], marginally for CN [β±SE=-0.074±0.041, t(1,35)= −1.822, p=0.077] and not for MCI [β±SE=0.043±0.029, t(1,70)=1.497, p=0.139]. Removal of the same autotaxin outlier from the PFC CT analysis did not affect the association in the AD group [β±SE=−0.116±0.032, T(1,34)= −3.610, p=0.001] (Fig. 1B). In addition, the Autotaxin * MCI Conversion interactions were non-significant for PFC.
Similar relationships were seen in the broad temporal ROI. A Baseline Diagnosis * Autotaxin interaction [F(2,146)=14.175 p<0.001] revealed that higher autotaxin was associated with less MTL glucose metabolism in AD [β±SE=−0.586±0.026, t(1,37)= −4.334 p<0.001] and CN participants [β±SE=−0.429±0.049, t(1,35)= −2.773 p=0.009], but not in MCI [β±SE=0.189±0.027, t(1,72)=1.619 p=0.110].
FDG uptake in the pre-central gyrus control region did not show a main effect of autotaxin or interaction with baseline diagnosis or MCI conversion.
Cognition: global and executive function factor scores
As shown in Table 4, separate linear mixed models indicated that per point increase in autotaxin, scores were lower for the executive function and memory factors, but not for global cognition and function scores.
Table 4.
The association of autotaxin with cognitive indices.
| Cognitive Parameter | F value | p value | β ± SE |
|---|---|---|---|
| ADAS-cog11 | 1.251 | 0.264 | 1.802 ± 1.611 |
| CDR-sob | 0.831 | 0.363 | 0.405 ± 0.444 |
| Executive Factor | 4.215 | 0.037 | −0.464 ± 0.222 |
| Memory Factor | 4.222 | 0.041 | −0.333 ± 0.056 |
| MMSE | 0.054 | 0.816 | 0.230 ± 0.606 |
Model estimate beta values and SE of autotaxin for global indices and the executive function and memory factors. Bolded text indicates results with a significant p value.
CSF biomarkers: Aβ1–42, total tau, and p-tau
Across all participants, the Spearman’s statistic showed that higher autotaxin was associated with higher levels of total tau, p-tau181, and total tau/Aβ1–42 (Table 5).
Table 5.
The association of autotaxin and AD CSF markers.
| CSF Biomarker | p value | Spearman’s R value |
|---|---|---|
| Aβ1–42 | 0.738 | −0.020 |
| p-tau181 | 0.028 | 0.130 |
| p-tau181/Aβ1–42 | 0.070 | 0.108 |
| Total Tau | 0.002 | 0.185 |
| Total Tau/Aβ1–42 | 0.018 | 0.141 |
Due to regression diagnostics, parametric models were not conducted between autotaxin and CSF biomarkers. Bolded text indicates results with a significant p value.
DISCUSSION
In this study, we hypothesized that CSF-derived autotaxin may be a biomarker for brain metabolic dysfunction relevant to AD. Strikingly, higher autotaxin predicted less bilateral PFC and MTL glucose uptake in individuals with AD, with similar effects seen in bilateral PFC CT. Results also showed that participants who had MCI or AD had significant increased log-scaled autotaxin. IR shows a similar relationship with PFC and MTL FDG-PET in late middle-aged participants [28], and among aged CN adults with type 2 diabetes [8] or AD [27], where the ADNI AD group for the previous report and this cohort show similar results.
Higher autotaxin correlated with established metabolic biomarkers and higher risk for pre-diabetes and type 2 diabetes. CSF ENPP2 was moderately associated with peripheral fasting glucose, but not BMI, where others have noted similar findings [26]. Furthermore, per point increase in autotaxin, executive function and memory factor scores were lower. Similarly, a decreased insulin sensitivity index in rhesus monkeys [43] was associated with less PFC gray matter and mediated worse motor-planning executive function performance. Higher HOMA-IR in aged humans with AD was also related to less MTL and PFC glucose metabolism [27], respectively mediating worse memory and executive function factor scores (unpublished data). Several studies have found similar associations between metabolic dysfunction, PFC outcomes, and executive function. Diabetes was significantly associated with worse cognitive performance and attention deficit in young adults without dementia [44]. In a cohort of bariatric surgery patients, as HOMA-IR levels decreased following the surgery, cognition scores improved [45]. Taken together, autotaxin shows a pattern of relationships with established metabolism biomarkers, MTL and PFC-specific outcomes, and related cognitive dysfunction that may reflect central dysmetabolism and is similar to our previous findings with IR.
Autotaxin was also positively correlated with levels of total tau, p-tau181, total tau/Aβ1–42, as well as p-tau181/Aβ1–42 to a marginal degree. This pattern suggests that CSF autotaxin predicts AD neuropathology in a manner similar to dysmetabolism. Chronic application of insulin in vitro in human cortical stem cells appeared to induce insulin resistance and inhibit tau dephosphorylation [46]. Higher IR among cognitively normal, APOE4 late middle-aged participants also predicted higher total tau and phosphorylated tau [47], but not CSF amyloid. Amyloidosis is scant in this late middle-aged cohort, but does show modest regional associations with higher IR [2]. ADNI did not have enough baseline amyloid scans (n=20) to warrant analysis with autotaxin.
This brings to question the underlying mechanism behind the correlation of autotaxin and AD-related outcomes. Individuals with high autotaxin may be more likely to be obese, causing an increase in IR, ischemia, and oxidative stress. Results of our study showed a weak association between systemic glucose and CSF autotaxin. As an alternative or interrelated mechanism, autotaxin stimulates the release of LPA, which may be detrimental [21, 22]. LPA has been shown to prompt neurite withdrawal and tau phosphorylation in neuroblastoma cells [48]. Addition of LPA to neuroblastoma cells led to increased immunoreactivity with antibodies that react with tau phosphorylation [17].
There are several study limitations to address. Regression diagnostic issues were encountered for total tau, p-tau181, and Aβ1–42, requiring non-parametric analyses. Autotaxin levels did not differ in MCI conversion or contribute to MCI conversion risk, nor were there significant interactions with MCI conversion, which may be due to small sample size. Instead, baseline values were widely dispersed in the MCI converter group. This mirrors IR MCI interactions [1]. No associations were found with Aβ levels, but there were significant associations with tau and p-tau181, as well as tau to amyloid ratios. Given that the mass spectrometry panel was only available at baseline, we were unable to longitudinally assess autotaxin levels and various outcomes. While longitudinal predictions would be useful, it was beyond the scope of this report, which was to systematically assess if autotaxin may be a relevant AD biomarker. While autotaxin was associated with fasting glucose, it was surprising that it was not associated with systemic insulin or HOMA-IR. This may be because insulin was derived from a plasma multiplex, and the values are lower than ELISA. Nonetheless, autotaxin was associated with fasting glucose, risk for pre-diabetes and type 2 diabetes, and was associated with many established metabolic factors in CSF. It also shows a pattern of results comparable to HOMA-IR and either brain atrophy or FDG-PET[7, 27, 28]. The non-significance of MTL ROI CT was unexpected; however, it also provides direction for future research. Glucagon-like peptide-1 (GLP-1) may be a potential element in this phenomenon. GLP-1 stimulates the release of insulin as well as downregulates the release of glucagon and breakdown of amyloid-β protein precursor [49]. GLP-1 receptor production in the aged mouse medial PFC was decreased compared to young mice, but no similar relationship was seen in the hippocampal regions [49].
In summary, this study demonstrates that CSF-derived autotaxin in elders correlated with greater odds for having MCI or AD, hyperglycemia, AD neuropathology related to total tau, p-tau181, and the total tau/Aβ1–42 ratio, less gray matter CT in PFC, hypometabolism in PFC and MTL, and worse executive function and memory scores. These results support the theory that autotaxin may be an indicator of central dysmetabolism for a variety of AD outcomes. Further replication is necessary to determine if autotaxin predicts AD and tracks certain aspects of the disease. Future clinical and animal model work should consider examining this biomarker and its applications as a potential target for pharmacologic therapies in the setting of glucose dysregulation and AD. Such work should also examine how autotaxin predicts changes in these outcomes over time.
Acknowledgments
This study was funded by Iowa State University and NIH AG047282. Neither funding source had any involvement in the report.
Data collection and sharing for this project were funded by the ADNI (National Institutes of Health Grant U01-AG-024904) and Department of Defense ADNI (award number W81XWH-12-2-0012). ADNI is funded by the National Institute on Aging, the National Institute of Biomedical Imaging and Bioengineering, and through generous contributions from the Alzheimer’s Association and the Alzheimer’s Drug Discovery Foundation. The Canadian Institutes of Health Research is providing funds to support ADNI clinical sites in Canada. Private-sector contributions are facilitated by the Foundation for the National Institutes of Health (http://www.fnih.org). The grantee organization is the Northern California Institute for Research and Education, and the study is coordinated by the Alzheimer’s Disease Cooperative Study at the University of California, San Diego. ADNI data are disseminated by the Laboratory for Neuro Imaging at the University of Southern California. The data used in the preparation of this article were obtained from the ADNI database (http://adni.loni.usc.edu). As such, the investigators within the ADNI contributed to the design and implementation of ADNI and/or provided data but did not participate in analysis or writing of this report.
Footnotes
Statistical analysis conducted by Kelsey McLimans and Dr. Auriel Willette, Iowa State University
Authors’ disclosures available online (http://j-alz.com/manuscript-disclosures/16-0891r1).
References
- 1.Willette AA, Modanlo N, Kapogiannis D, Alzheimer’s Disease Neuroimaging Initiative Insulin resistance predicts medial temporal hypermetabolism in mild cognitive impairment conversion to Alzheimer disease. Diabetes. 2015;64:1933–1940. doi: 10.2337/db14-1507. [DOI] [PMC free article] [PubMed] [Google Scholar]
- 2.Willette AA, Johnson SC, Birdsill AC, Sager MA, Christian B, Baker LD, Craft S, Oh J, Statz E, Hermann BP, Jonaitis EM, Koscik RL, La Rue A, Asthana S, Bendlin BB. Insulin resistance predicts brain amyloid deposition in late middle-aged adults. Alzheimers Dement. 2015;11:504–510 e501. doi: 10.1016/j.jalz.2014.03.011. [DOI] [PMC free article] [PubMed] [Google Scholar]
- 3.Willette AA, Kapogiannis D. Does the brain shrink as the waist expands? Ageing Res Rev. 2015;20:86–97. doi: 10.1016/j.arr.2014.03.007. [DOI] [PMC free article] [PubMed] [Google Scholar]
- 4.Pannacciulli N, Del Parigi A, Chen K, Le DSNT, Reiman EM, Tataranni PA. Brain abnormalities in human obesity: A voxel-based morphometric study. NeuroImage. 2006;31:1419–1425. doi: 10.1016/j.neuroimage.2006.01.047. [DOI] [PubMed] [Google Scholar]
- 5.de la Torre JC, Čada A, Nelson N, Davis G, Sutherland RJ, Gonzalez-Lima F. Reduced cytochrome oxidase and memory dysfunction after chronic brain ischemia in aged rats. Neuroscience Letters. 1997;223:165–168. doi: 10.1016/s0304-3940(97)13421-8. [DOI] [PubMed] [Google Scholar]
- 6.Goldstein BJ. Insulin resistance as the core defect in type 2 diabetes mellitus. The American Journal of Cardiology. 2002;90:3–10. doi: 10.1016/s0002-9149(02)02553-5. [DOI] [PubMed] [Google Scholar]
- 7.Willette AA, Xu G, Johnson SC, Birdsill AC, Jonaitis EM, Sager MA, Hermann BP, La Rue A, Asthana S, Bendlin BB. Insulin Resistance, Brain Atrophy, and Cognitive Performance in Late Middle–Aged Adults. Diabetes Care. 2013;36:443–449. doi: 10.2337/dc12-0922. [DOI] [PMC free article] [PubMed] [Google Scholar]
- 8.Baker LD, Cross D, Minoshima S, Belongia D, Watson GS, Craft S. Insulin resistance is associated with Alzheimer-like reductions in regional cerebral glucose metabolism for cognitively normal adults with pre-diabetes or early type 2 diabetes. Arch Neurol. 2011;68:51–57. doi: 10.1001/archneurol.2010.225. [DOI] [PMC free article] [PubMed] [Google Scholar]
- 9.Tucsek Z, Toth P, Sosnowska D, Gautam T, Mitschelen M, Koller A, Szalai G, Sonntag WE, Ungvari Z, Csiszar A. Obesity in Aging Exacerbates Blood–Brain Barrier Disruption, Neuroinflammation, and Oxidative Stress in the Mouse Hippocampus: Effects on Expression of Genes Involved in Beta-Amyloid Generation and Alzheimer’s Disease. The Journals of Gerontology Series A: Biological Sciences and Medical Sciences. 2014;69:1212–1226. doi: 10.1093/gerona/glt177. [DOI] [PMC free article] [PubMed] [Google Scholar]
- 10.Castanon N, Luheshi G, Layé S. Role of neuroinflammation in the emotional and cognitive alterations displayed by animal models of obesity. Frontiers in Neuroscience. 2015;9:229. doi: 10.3389/fnins.2015.00229. [DOI] [PMC free article] [PubMed] [Google Scholar]
- 11.Thaler JP, Yi CX, Schur EA, Guyenet SJ, Hwang BH, Dietrich MO, Zhao X, Sarruf DA, Izgur V, Maravilla KR, Nguyen HT, Fischer JD, Matsen ME, Wisse BE, Morton GJ, Horvath TL, Baskin DG, Tschop MH, Schwartz MW. Obesity is associated with hypothalamic injury in rodents and humans. J Clin Invest. 2012;122:153–162. doi: 10.1172/JCI59660. [DOI] [PMC free article] [PubMed] [Google Scholar]
- 12.De Souza CT, Araujo EP, Bordin S, Ashimine R, Zollner RL, Boschero AC, Saad MJA, Velloso LA. Consumption of a fat-rich diet activates a proinflammatory response and induces insulin resistance in the hypothalamus. Endocrinology. 2005;146:4192–4199. doi: 10.1210/en.2004-1520. [DOI] [PubMed] [Google Scholar]
- 13.van Dijk EJ, Prins ND, Vermeer SE, Vrooman HA, Hofman A, Koudstaal PJ, Breteler MMB. C-reactive protein and cerebral small-vessel disease – The Rotterdam Scan Study. Circulation. 2005;112:900–905. doi: 10.1161/CIRCULATIONAHA.104.506337. [DOI] [PubMed] [Google Scholar]
- 14.Jackson K, Barisone GA, Diaz E, Jin LW, DeCarli C, Despa F. Amylin deposition in the brain: A second amyloid in Alzheimer disease? Annals of Neurology. 2013;74:517–526. doi: 10.1002/ana.23956. [DOI] [PMC free article] [PubMed] [Google Scholar]
- 15.Srodulski S, Sharma S, Bachstetter AB, Brelsfoard JM, Pascual C, Xie XS, Saatman KE, Van Eldik LJ, Despa F. Neuroinflammation and neurologic deficits in diabetes linked to brain accumulation of amylin. Molecular Neurodegeneration. 2014;9 doi: 10.1186/1750-1326-9-30. [DOI] [PMC free article] [PubMed] [Google Scholar]
- 16.Nishimura S, Nagasaki M, Okudaira S, Aoki J, Ohmori T, Ohkawa R, Nakamura K, Igarashi K, Yamashita H, Eto K, Uno K, Hayashi N, Kadowaki T, Komuro I, Yatomi Y, Nagai R. ENPP2 contributes to adipose tissue expansion and insulin resistance in diet-induced obesity. Diabetes. 2014;63:4154–4164. doi: 10.2337/db13-1694. [DOI] [PubMed] [Google Scholar]
- 17.Umemura K, Yamashita N, Yu X, Arima K, Asada T, Makifuchi T, Murayama S, Saito Y, Kanamaru K, Goto Y, Kohsaka S, Kanazawa I, Kimura H. Autotaxin expression is enhanced in frontal cortex of Alzheimer-type dementia patients. Neurosci Lett. 2006;400:97–100. doi: 10.1016/j.neulet.2006.02.008. [DOI] [PubMed] [Google Scholar]
- 18.Ferry G, Tellier E, Try A, Gres S, Naime I, Simon MF, Rodriguez M, Boucher J, Tack I, Gesta S, Chomarat P, Dieu M, Raes M, Galizzi JP, Valet P, Boutin JA, Saulnier-Blache JS. Autotaxin is released from adipocytes, catalyzes lysophosphatidic acid synthesis, and activates preadipocyte proliferation. J Biol Chem. 2003;278:18162–18169. doi: 10.1074/jbc.M301158200. [DOI] [PMC free article] [PubMed] [Google Scholar]
- 19.Goding JW, Grobben B, Slegers H. Physiological and pathophysiological functions of the ecto-nucleotide pyrophosphatase/phosphodiesterase family. Biochim Biophys Acta. 2003;1638:1–19. doi: 10.1016/s0925-4439(03)00058-9. [DOI] [PubMed] [Google Scholar]
- 20.Sato K, Malchinkhuu E, Muraki T, Ishikawa K, Hayashi K, Tosaka M, Mochiduki A, Inoue K, Tomura H, Mogi C, Nochi H, Tamoto K, Okajima F. Identification of autotaxin as a neurite retraction-inducing factor of PC12 cells in cerebrospinal fluid and its possible sources. Journal of Neurochemistry. 2005;92:904–914. doi: 10.1111/j.1471-4159.2004.02933.x. [DOI] [PubMed] [Google Scholar]
- 21.Rancoule C, Viaud M, Gres S, Viguerie N, Decaunes P, Bouloumie A, Langin D, Bascands JL, Valet P, Saulnier-Blache JS. Pro-fibrotic activity of lysophosphatidic acid in adipose tissue: in vivo and in vitro evidence. Biochim Biophys Acta. 2014;1841:88–96. doi: 10.1016/j.bbalip.2013.10.003. [DOI] [PubMed] [Google Scholar]
- 22.Lin ME, Herr DR, Chun J. Lysophosphatidic acid (LPA) receptors: signaling properties and disease relevance. Prostaglandins Other Lipid Mediat. 2010;91:130–138. doi: 10.1016/j.prostaglandins.2009.02.002. [DOI] [PMC free article] [PubMed] [Google Scholar]
- 23.Rancoule C, Dusaulcy R, Treguer K, Gres S, Attane C, Saulnier-Blache JS. Involvement of autotaxin/lysophosphatidic acid signaling in obesity and impaired glucose homeostasis. Biochimie. 2014;96:140–143. doi: 10.1016/j.biochi.2013.04.010. [DOI] [PubMed] [Google Scholar]
- 24.On NH, Savant S, Toews M, Miller DW. Rapid and reversible enhancement of blood-brain barrier permeability using lysophosphatidic acid. Journal of Cerebral Blood Flow and Metabolism. 2013;33:1944–1954. doi: 10.1038/jcbfm.2013.154. [DOI] [PMC free article] [PubMed] [Google Scholar]
- 25.Pages C, Daviaud D, An SZ, Krief S, Lafontan M, Valet P, Saulnier-Blache JS. Endothelial differentiation gene-2 receptor is involved in lysophosphatidic acid-dependent control of 3T3F442A preadipocyte proliferation and spreading. Journal of Biological Chemistry. 2001;276:11599–11605. doi: 10.1074/jbc.M010111200. [DOI] [PubMed] [Google Scholar]
- 26.Rachakonda VP, Reeves VL, Aljammal J, Wills RC, Trybula JS, DeLany JP, Kienesberger PC, Kershaw EE. Serum autotaxin is independently associated with hepatic steatosis in women with severe obesity. Obesity (Silver Spring) 2015;23:965–972. doi: 10.1002/oby.20960. [DOI] [PMC free article] [PubMed] [Google Scholar]
- 27.Willette AA, Modanlo N, Kapogiannis D. Insulin Resistance Predicts Medial Temporal Hypermetabolism in Mild Cognitive Impairment Conversion to Alzheimer Disease. Diabetes. 2015;64:1933–1940. doi: 10.2337/db14-1507. [DOI] [PMC free article] [PubMed] [Google Scholar]
- 28.Willette AA, Bendlin BB, Starks EJ, Birdsill AC, Johnson SC, Christian BT, Okonkwo OC, La Rue A, Hermann BP, Koscik RL, Jonaitis EM, Sager MA, Asthana S. Association of Insulin Resistance With Cerebral Glucose Uptake in Late Middle-Aged Adults at Risk for Alzheimer Disease. JAMA Neurol. 2015;72:1013–1020. doi: 10.1001/jamaneurol.2015.0613. [DOI] [PMC free article] [PubMed] [Google Scholar]
- 29.Spellman DS, Wildsmith KR, Honigberg LA, Tuefferd M, Baker D, Raghavan N, Nairn AC, Croteau P, Schirm M, Allard R, Lamontagne J, Chelsky D, Hoffmann S, Potter WZ, Alzheimer’s Disease Neuroimaging Iniative, Foundation for NIH Biomarkers Core CSF Proteomics Project Team Development and evaluation of a multiplexed mass spectrometry based assay for measuring candidate peptide biomarkers in Alzheimer’s Disease Neuroimaging Initiative (ADNI) CSF. Proteomics Clin Appl. 2015;9:715–731. doi: 10.1002/prca.201400178. [DOI] [PMC free article] [PubMed] [Google Scholar]
- 30.Matthews DR, Hosker JP, Rudenski AS, Naylor BA, Treacher DF, Turner RC. Homeostasis model assessment: insulin resistance and beta-cell function from fasting plasma glucose and insulin concentrations in man. Diabetologia. 1985;28:412–419. doi: 10.1007/BF00280883. [DOI] [PubMed] [Google Scholar]
- 31.Zurbig P, Jahn H. Use of proteomic methods in the analysis of human body fluids in Alzheimer research. Electrophoresis. 2012;33:3617–3630. doi: 10.1002/elps.201200360. [DOI] [PubMed] [Google Scholar]
- 32.Reeves VL, Trybula JS, Wills RC, Goodpaster BH, Dube JJ, Kienesberger PC, Kershaw EE. Serum autotaxin/ENPP2 correlates with insulin resistance in older humans with obesity. Obesity. 2015;23:2371–2376. doi: 10.1002/oby.21232. [DOI] [PMC free article] [PubMed] [Google Scholar]
- 33.Shaw LM, Vanderstichele H, Knapik-Czajka M, Figurski M, Coart E, Blennow K, Soares H, Simon AJ, Lewczuk P, Dean RA, Siemers E, Potter W, Lee VMY, Trojanowski JQ, Alzheimer’s Disease Neuroimaging I Qualification of the analytical and clinical performance of CSF biomarker analyses in ADNI. Acta neuropathologica. 2011;121:597–609. doi: 10.1007/s00401-011-0808-0. [DOI] [PMC free article] [PubMed] [Google Scholar]
- 34.Mukherjee S, Trittschuh E, Gibbons LE, Mackin RS, Saykin A, Crane PK. Dysexecutive and amnesic AD subtypes defined by single indicator and modern psychometric approaches: relationships with SNPs in ADNI. Brain imaging and behavior. 2012;6:649–660. doi: 10.1007/s11682-012-9207-y. [DOI] [PMC free article] [PubMed] [Google Scholar]
- 35.Jack CR, Jr, Bernstein MA, Fox NC, Thompson P, Alexander G, Harvey D, Borowski B, Britson PJ, J LW, Ward C, Dale AM, Felmlee JP, Gunter JL, Hill DL, Killiany R, Schuff N, Fox-Bosetti S, Lin C, Studholme C, DeCarli CS, Krueger G, Ward HA, Metzger GJ, Scott KT, Mallozzi R, Blezek D, Levy J, Debbins JP, Fleisher AS, Albert M, Green R, Bartzokis G, Glover G, Mugler J, Weiner MW. The Alzheimer’s Disease Neuroimaging Initiative (ADNI): MRI methods. J Magn Reson Imaging. 2008;27:685–691. doi: 10.1002/jmri.21049. [DOI] [PMC free article] [PubMed] [Google Scholar]
- 36.Fischl B, van der Kouwe A, Destrieux C, Halgren E, Segonne F, Salat DH, Busa E, Seidman LJ, Goldstein J, Kennedy D, Caviness V, Makris N, Rosen B, Dale AM. Automatically parcellating the human cerebral cortex. Cereb Cortex. 2004;14:11–22. doi: 10.1093/cercor/bhg087. [DOI] [PubMed] [Google Scholar]
- 37.Burggren AC, Zeineh MM, Ekstrom AD, Braskie MN, Thompson PM, Small GW, Bookheimer SY. Reduced cortical thickness in hippocampal subregions among cognitively normal apolipoprotein E e4 carriers. Neuroimage. 2008;41:1177–1183. doi: 10.1016/j.neuroimage.2008.03.039. [DOI] [PMC free article] [PubMed] [Google Scholar]
- 38.Querbes O, Aubry F, Pariente J, Lotterie JA, Demonet JF, Duret V, Puel M, Berry I, Fort JC, Celsis P, Alzheimer’s Disease Neuroimaging I Early diagnosis of Alzheimer’s disease using cortical thickness: impact of cognitive reserve. Brain. 2009;132:2036–2047. doi: 10.1093/brain/awp105. [DOI] [PMC free article] [PubMed] [Google Scholar]
- 39.Jagust WJ, Bandy D, Chen K, Foster NL, Landau SM, Mathis CA, Price JC, Reiman EM, Skovronsky D, Koeppe RA, Alzheimer’s Disease Neuroimaging I The Alzheimer’s Disease Neuroimaging Initiative positron emission tomography core. Alzheimers Dement. 2010;6:221–229. doi: 10.1016/j.jalz.2010.03.003. [DOI] [PMC free article] [PubMed] [Google Scholar]
- 40.Willette AA, Lubach GR, Knickmeyer RC, Short SJ, Styner M, Gilmore JH, Coe CL. Brain enlargement and increased behavioral and cytokine reactivity in infant monkeys following acute prenatal endotoxemia. Behav Brain Res. 2011;219:108–115. doi: 10.1016/j.bbr.2010.12.023. [DOI] [PMC free article] [PubMed] [Google Scholar]
- 41.Hummel TJ, Sligo JR. Empirical Comparison of Univariate and Multivariate Analysis of Variance Procedures. Psychological Bulletin. 1971;76:49–57. [Google Scholar]
- 42.Holm S. A Simple Sequentially Rejective Multiple Test Procedure. Scandinavian Journal of Statistics. 1979;6:65–70. [Google Scholar]
- 43.Willette AA, Bendlin BB, Colman RJ, Kastman EK, Field AS, Alexander AL, Sridharan A, Allison DB, Anderson R, Voytko M-L, Kemnitz JW, Weindruch RH, Johnson SC. Calorie Restriction Reduces the Influence of Glucoregulatory Dysfunction on Regional Brain Volume in Aged Rhesus Monkeys. Diabetes. 2012;61:1036–1042. doi: 10.2337/db11-1187. [DOI] [PMC free article] [PubMed] [Google Scholar]
- 44.Weinstein G, Maillard P, Himali JJ, Beiser AS, Au R, Wolf PA, Seshadri S, DeCarli C. Glucose indices are associated with cognitive and structural brain measures in young adults. Neurology. 2015;84:2329–2337. doi: 10.1212/WNL.0000000000001655. [DOI] [PMC free article] [PubMed] [Google Scholar]
- 45.Galioto R, Alosco ML, Spitznagel MB, Strain G, Devlin M, Cohen R, Crosby RD, Mitchell JE, Gunstad J. Glucose regulation and cognitive function after bariatric surgery. J Clin Exp Neuropsychol. 2015;37:402–413. doi: 10.1080/13803395.2015.1023264. [DOI] [PMC free article] [PubMed] [Google Scholar]
- 46.Kim B, Figueroa-Romero C, Pacut C, Backus C, Feldman EL. Insulin Resistance Prevents AMPK-induced Tau Dephosphorylation through Akt-mediated Increase in AMPKSer-485 Phosphorylation. J Biol Chem. 2015;290:19146–19157. doi: 10.1074/jbc.M115.636852. [DOI] [PMC free article] [PubMed] [Google Scholar]
- 47.Starks EJ, Patrick O’Grady J, Hoscheidt SM, Racine AM, Carlsson CM, Zetterberg H, Blennow K, Okonkwo OC, Puglielli L, Asthana S, Dowling NM, Gleason CE, Anderson RM, Davenport-Sis NJ, DeRungs LM, Sager MA, Johnson SC, Bendlin BB. Insulin Resistance is Associated with Higher Cerebrospinal Fluid Tau Levels in Asymptomatic APOEvarepsilon4 Carriers. J Alzheimers Dis. 2015;46:525–533. doi: 10.3233/JAD-150072. [DOI] [PMC free article] [PubMed] [Google Scholar]
- 48.Sun Y, Kim NH, Yang H, Kim SH, Huh SO. Lysophosphatidic acid induces neurite retraction in differentiated neuroblastoma cells via GSK-3beta activation. Mol Cells. 2011;31:483–489. doi: 10.1007/s10059-011-1036-0. [DOI] [PMC free article] [PubMed] [Google Scholar]
- 49.Ohshima R, Hotsumi K, Holscher C, Seki K. Age-related decrease in glucagon-like peptide-1 in mouse prefrontal cortex but not in hippocampus despite the preservation of its receptor. AJBIO. 2015;3:11–27. [Google Scholar]