Abstract
The cytoskeleton is fundamental to many cellular functions including cell proliferation, differentiation, adhesion, and migration. It is composed of actin, microtubules, intermediate filaments, and integrin cell surface receptors, which form focal adhesions with the extracellular matrix. These elements are highly integrated in the cell providing a rigid network of interconnected cables and protein scaffolds, which generate force and mechanical support to maintain cell shape and movement. However, the cytoskeleton is not just a simple compilation of static filaments that dictate cell adhesion and morphology—it is highly plastic with the inherent ability to assemble and disassemble in response to diverse and complex cellular cues. Thus, biochemical and proteomic methods are needed to better understand the cytoskeleton network and its dynamic signal transduction functions in health and disease. This chapter describes methods for the biochemical enrichment and mass spectrometry-based proteomic analyses of the cytoskeletome. We also detail how these methods can be used to investigate the cytoskeletome of migrating cells and their purified pseudopodia membrane projections.
Keywords: Cytoskeletome, Proteomics, Pseudopodium dynamics, Cell migration
1 Introduction
The process of focal adhesion formation and maturation during cell migration illustrates the dynamic nature of the cytoskeleton to relay both force and signaling information to the cell in a temporal and spatial manner. The cytoskeleton is distinctly polarized in migrating cells to form a leading front and trailing rear compartment [1]. At the cell front, actin polymerization and assembly drive pseudopodia membrane protrusion and attachment to the underlying extracellular matrix (ECM) forming new focal complexes at the leading membrane edge. At the sides and rear of the cell, the cytoskeleton provides rigidity and contraction events that disengage focal adhesions to pull up the trailing tail from the underlying substratum [2]. The repeated cycle of pseudopodium extension at the front coupled with focal adhesion turnover and tail retraction at the back facilitates cell translocation. The direction of movement can be random or tightly regulated by gradients of ECM proteins and growth factors present in the extracellular environment. Cell migration is important for embryonic development, wound healing, and immune function, and can contribute to various pathologies including cancer cell metastasis and inflammatory diseases [3, 4].
While the signaling pathways that control cytoskeleton dynamics in migratory cells are being elucidated, little is known about how they are networked spatially within the cell to regulate cytoskeleton remodeling and front–rear cell polarity. This is largely because isolating the cytoskeleton for comprehensive proteomic profiling presents a significant technical challenge. The cell cytoskeleton is often insoluble under conventional cell lysis and detergent conditions making it incompatible with mass spectrometry-based protein detection methods [5, 6]. Confounding this issue, many signaling proteins that regulate the cytoskeleton bind with high affinity to the actin/tubulin scaffolds and focal adhesion complexes making them highly insoluble [7 – 10]. Also, current mass spectrometry techniques are limited by the inability to detect low-abundant cytoskeleton signaling proteins from complex whole cell protein extracts. While cytoskeleton enrichment methods have been described, they often do not maintain protein constituents in their native state and, thus, can disrupt important interactions with binding partners or alter critical posttranslational modifications. This makes it difficult to fully characterize the composition and activity state of the cytoskeletome, which is necessary for network analyses [11 – 14]. The need to characterize the cytoskeletome and its posttranslational modifications in migratory cells led us to develop a cytoskeleton purification method that enables the enrichment of cytoskeleton- and focal adhesion-associated proteins in their native state that is compatible with contemporary mass spectrometry methods. Using this technique, we examine the cytoskeleton proteomes from isolated pseudopodia. These technologies will facilitate a comprehensive understanding of how the cytoskeleton domain functions under a wide range of physiological and disease conditions.
2 Materials
2.1 Cell Culture
Cell lines: NIH3T3 or MEF (ATCC; see Note1).
150 mm tissue culture dishes.
Growth medium: Dulbecco’s modified Eagle’s medium (DMEM) supplemented with 10 % fetal bovine serum (FBS), 2 mM L -glutamine, 50 μg/mL gentamicin, and 1 mM sodium pyruvate.
Migration medium: Same as growth medium.
0.25 % Trypsin–EDTA solution.
Phosphate-buffered saline (PBS) solution: One package of PBS powder (Gibco, 9.6 g per package) in 1 L of nano-pure water. Autoclave and store at 4 °C. Warm to 37 °C in a water bath before use.
2.2 Wound-Healing Migration and Cytoskeleton Enrichment
A Cell Comb™ (EMD Millipore, Catalogue No. 17-10191).
Cell scrapers.
Protease inhibitor cocktail (Roche).
Phosphatase inhibitor cocktail (1×): 5 mM NaF, 2 mM sodium vanadate, and 10 mM β-glycerophosphate.
Cell lysis buffer: 50 mM PIPES, 50 mM NaCl, 5 % glycerol, 0.1 % NP-40, 0.1 % Triton X-100, 0.1 % Tween 20, 1× protease inhibitor, and 1× phosphatase inhibitor.
TBS buffer: 50 mM Tris–HCl, pH 7.5.
TBS buffer with inhibitors: TBS buffer with 1× protease inhibitor and 1× phosphatase inhibitor.
Nuclease buffer: 10 U/mL benzoase nuclease (Sigma- Aldrich), 10 mM MgCl 2, and 2 mM CaCl 2 in TBS buffer, with 1× protease inhibitor and 1× phosphatase inhibitor.
Micro BCA protein assay kit (Pierce Biotechnology).
SDS solution, 1 % (w/v).
2.3 Pseudopodia Isolation and Cytoskeleton Enrichment
Transwell containing polycarbonate membrane with 3.0 μm pores in 6-well plate format (24 mm, Corning, # 3414).
Regular 6-well plate.
L -α-Lysophosphatidic acid (LPA), oleoyl, sodium (Sigma-Aldrich).
NuPAGE 4–12 % Bis-Tris gel.
Starvation medium: 500 mL DMEM, 1 mM sodium pyruvate, 2 mM L -glutamine, 50 μg/mL gentamicin.
Migration and adhesion medium: 500 mL DMEM, 1 mM sodium pyruvate, 2 mM L -glutamine, 50 μg/mL gentamicin, 1.25 g (0.25 %) BSA.
Migration and adhesion medium with chemoattractant: 500 mL DMEM, 1 mM sodium pyruvate, 2 mM L -glutamine, 50 μg/mL gentamicin, 1.25 g (0.25 %) BSA, and 0.1 μg/mL LPA.
Fibronectin solution (5 μg/mL): Dilute 0.1 % fibronectin stock solution (Sigma-Aldrich) with 200× water.
Cotton swab: Cotton-tipped swab, flatten the tip before use.
2.4 Protein Gel Separation and In-Gel Digestion
50 % (vol/vol) Methanol in nano-pure water.
100 mM Triethyl ammonium bicarbonate (TEAB) dissolved in nano-pure water.
10 mM Dithiothreitol (DTT) dissolved in 100 mM TEAB.
50 mM Iodoacetamide dissolved in 100 mM TEAB.
Trypsin solution: Trypsin (sequence grade) dissolved in 100 mM TEAB, protein ratio of 1:100 (w:w).
50 % Acetonitrile (ACN), HPLC grade/1 % formic acid in nano-pure water.
NuPage 4–12 % Bis-Tris gel.
MOPS buffer (Invitrogen).
Power supply-Power-PAK300 (BIO-RAD).
Coomassie Brilliant Blue.
Destaining buffer: 40 % methanol/10 % acetic acid in nano-pure water.
2.5 Dimethyl Protein Labeling for Quantitative Proteomics
100 mM TEAB dissolved in nano-pure water.
4 % (vol/vol) Formaldehyde (CH2O, Sigma-Aldrich) in nano-pure water.
4 % (vol/vol) Formaldehyde (13CD2O, Isotec) in nano-pure water.
0.6 mM sodium cyanoborohydride (NaBH3CN, Fluka) dissolved in 100 mM TEAB.
0.6 mM sodium cyanoborodeuteride (NaBD3CN, Isotec) dissolved in 100 mM TEAB.
1 % (vol/vol) ammonia solution (Merck) in nano-pure water.
2.6 Multidimensional Protein Identification Technology (MudPit)
Fused-silica capillary (I.D. 100 μm, O.D. 360 μm).
P-2000 laser puller (Sutter Instrument Co).
C18 (5 μm particle size).
SCX (strong cation exchange, 5 μm particle size).
Buffer A: 5 % ACN/0.02 % heptafluorobutyric acid (HFBA) in nano-pure water.
Buffer B: 80 % ACN/0.02 % HFBA in nano-pure water.
Buffer C: 250 mM Ammonium acetate/5 % ACN/0.02 % HFBA.
Buffer D: 500 mM Ammonium acetate/5 % ACN/0.02 % HFBA.
3 Methods
This section details two protocols for the biochemical enrichment of the cytoskeleton from wounded migrating cells and isolated pseudopodia. Procedures for inducing wound-healing cell migration [15, 16] and pseudopodia isolation have been previously described [17 – 20]. A flow diagram of our method for cytoskeleton extraction is shown in Fig. 1.
Fig. 1.
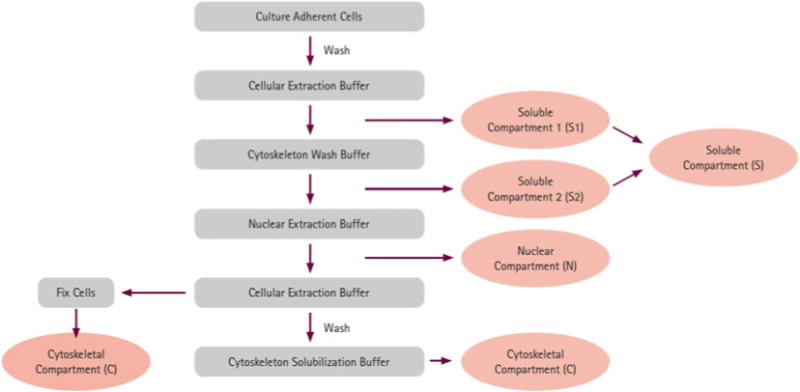
Cytoskeleton enrichment procedure. The schematic demonstrates the flow diagram for our method of cytoskeleton enrichment
Western blot analysis (Fig. 2) illustrates the purification and enrichment of known cytoskeleton and adhesion proteins (actin, α-actinin, vinculin, Erk2, and Src) using this technique. Microscopy analysis of these domains within cells following this enrichment procedure also shows that the actin- and focal adhesion-associated proteins, α-actinin and paxillin, remain bound to the native, unperturbed, F-actin cytoskeleton and properly localize to their respective domains (Fig. 3).
Fig. 2.
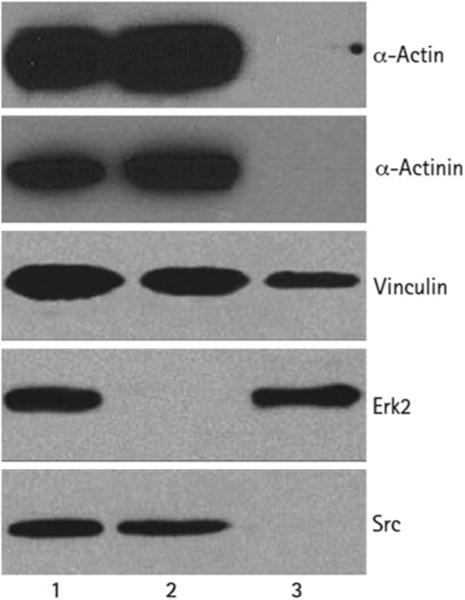
Robust enrichment of known cytoskeletal proteins shown by Western blot. The soluble cytoplasmic proteins and insoluble fractions from embryonic fibroblast cells were separated and analyzed for the indicated proteins. For comparison, total cell protein was isolated using 1 % SDS. Lane 1. Total lysate. Lane 2. Cytoskeleton. Lane 3. Soluble proteins
Fig. 3.
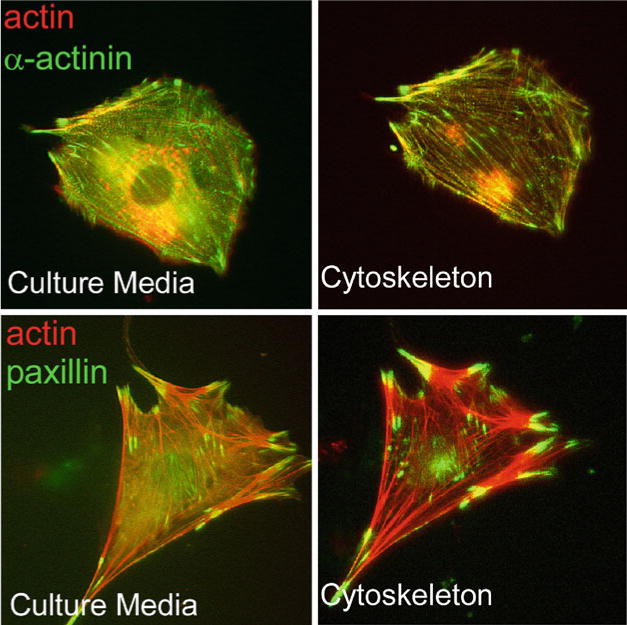
α-Actinin (top) and paxillin (bottom) remain associated with the actin cytoskeleton after the cytoskeleton enrichment procedure and are more clearly visualized after removal of soluble background proteins. Fluorescent micrographs of MEFs co-expressing mCherry-tagged actin and GFP-tagged α-actinin (top) or paxillin (bottom). Images were captured from a live cell before and after extraction
3.1 Cytoskeleton Enrichment from Migrating Cells
We have coupled previously characterized methods for synchronously inducing directional cell migration [15, 16], with a commercially available tool for simultaneously wounding a large number of cells in confluent monolayers and our novel protocol for biochemical enrichment of the cytoskeletome. This has enabled proteomic analysis of this domain during directed cell migration while providing sufficient amount of material for mass spectrometry (MS) analysis. As described below, confluent monolayers of fibroblast cells were scratched using the Cell Comb to induce wound-healing migration. This allowed us to visualize the closure of the wounds over time using phase-contrast microscopy (Fig. 4) in order to identify specific time points or an appropriate endpoint for subsequent enrichment and proteomic analysis of the insoluble protein fraction.
Fig. 4.
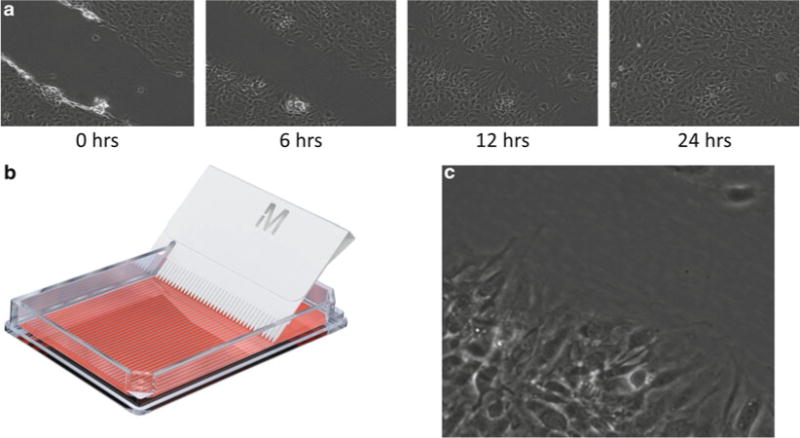
A confluent monolayer of NIH3T3 mouse fibroblasts was wounded (a) using the Millipore Cell Comb (b). Wound closure was analyzed by time-lapse phase-contrast microscopy. (c) Enlarged region from wound showing cytoskeleton and adhesion structures
3.1.1 Cell Culture for Wound-Healing Migration Studies
Culture low-passage wild-type NIH3T3 or MEF cells in growth medium using 150 mm culture dishes and a humidified atmosphere with 5 % CO 2 at 37 °C. Change medium every 2 or 3 days.
When the cells are approximately 90 % confluent, split into four 150 mm dishes containing fresh growth medium. The cells will reach 90 % confluence within 4 days.
3.1.2 Cell Wounding and Migration
Remove cell culture medium.
Scratch surface of the four plates with a Cell Comb following the manufacturer’s instructions (see Note2).
Gently rinse the cells with PBS solution three times to remove detached cells and then add 15 mL of growth medium.
Incubate the cells at 37 °C for 0, 6, 12, or 24 h (see Note3).
Remove culture medium and rinse cells with 5 mL of cold PBS solution twice. Then, add 5 mL of cold cell lysis buffer on ice for 1.5 min (see Note4).
Aspirate the soluble fraction gently and collect for further use.
3.1.3 DNA and RNA Extraction
Nuclease treatment provides the added advantage of removing background results due to nucleotide and nucleoprotein contamination.
Rinse the cell substrate with 5 mL of TBS buffer gently and then treat with 5 mL of nuclease buffer for 10 min at room temperature.
Remove the nuclease buffer and add the collected soluble fraction from Subheading 3.1.2 to solubilize the DNA- and RNA- binding proteins for another 30 s.
Rinse cytoskeleton proteins (insoluble fraction) remaining bound to the plates with 5 mL of TBS buffer three times.
3.1.4 Extraction of Cytoskeleton and Adhesion Proteins for Proteomic Analysis
Collect the cytoskeleton fraction in 1 % SDS to completely solubilize and denature cytoskeleton proteins (see Note5).
Transfer the insoluble fraction to a 1.5 mL microfuge tube and boil at 100 °C for 5 min. Freeze samples at −80 °C for further use.
3.2 Cytoskeleton Enrichment from Pseudopodia
Analysis of cell pseudopodia during directed migration has provided insight into the protein and phosphoprotein networks that control cell polarization and chemotaxis, leading to a system-wide understanding of how chemotactic cells organize signaling polarity to achieve directional movement. Our laboratory previously developed a method for the separation of pseudopodia and cell body for comparative proteomic and phosphoproteomic analyses [17 – 20]. To gain a deeper understanding of the cytoskeleton and adhesion complex regulation during pseudopodia formation, these previously published methods have been combined with our novel enrichment protocol (Fig. 1).
3.2.1 Cell Culture for Pseudopodial Assay
Split three 100 mm dishes of low-passage NIH3T3 (60–70 % confluent) into twelve 10 mm dishes containing 7 mL of growth media. Culture cells for 2–3 days at 5 % CO 2, 37 °C, until the cells are 70–80 % confluent.
The day before the pseudopodia assay, carefully remove the cell culture medium from the dishes, and add 7 mL of starvation medium to starve cells overnight at 5 % CO 2, 37 °C (see Note6).
3.2.2 Stimulation of Pseudopodia Formation
Coat both the top and bottom sides of the polycarbonate membrane in a 6-well transwell plate with 5 μg/mL fibronectin solution. Incubate the 6-well plate at 37 °C for 2 h to allow the filters to be coated completely (see Note7).
Add 2.5 mL of cell migration medium to each of the lower chambers in the transwell plate and put the microporous filters back into the plate.
Trypsinize and transfer the starved cells into the upper chamber on the microporous filter. Resuspend the cells with 4 mL migration medium to a final concentration of 1.5 × 10⁶ cells per well.
Carefully place the plates in the cell culture incubator; allow the cells to attach and spread for 2–2.5 h at 37 °C, 5 % CO2.
Add 2.5 mL migration and adhesion medium containing che-moattractant to the lower chamber of each well of a new 6-well dish (see Note8). Carefully transfer the microporous filter to which the cells are attached to a well containing migration and adhesion medium containing chemoattractant (see Note9). Gently place the 6-well plate into the cell culture incubator and allow pseudopodia to grow for ~60 min [21].
3.2.3 Extraction of Cytoskeleton for Proteomic Analysis
Thirty minutes before harvesting pseudopodia or cell bodies, add 5 mL of cell lysis buffer to each well of a clean used or new 6-well plate. Incubate the plate on ice.
Flatten out a piece of parafilm on the top of a glass plate and place a 200 μL drop of 1 % SDS on the parafilm to collect the protein.
Remove the filter to be processed for growth-phase pseudopodia or cell body isolation from the 6-well plate and quickly (but gently) dip into PBS solution to rinse the cells at room temperature.
Place the filter directly into ice-cold cell lysis buffer for 1.5 min.
Gently rinse the filter with TBS buffer and incubate the retained cytoskeleton proteins in nuclease buffer for 10 min at room temperature. Then rinse the filter with TBS buffer again.
With a cotton-tipped swab (with the tip flattened), remove the cell bodies from the rest of the filter paper and discard. Be gentle and careful as the filter paper is very fragile. Rinse with TBS buffer three times to remove cell debris. For cell body cytoskeleton enrichment, gently remove the cell pseudopodia from the bottom of the filter paper in a new well. Rinse three times before protein collection (see Note10).
Carefully cut the filter along the outer edge of the chamber, using a sharp razor blade to generate a round piece of filter paper. Place the filters into the puddle of 1 % SDS on the parafilm with the pseudopodia facing down and allow the proteins to solubilize for 30 s. Then with a cell scraper, scrape down the pseudopodia cytoskeleton from the filter into 1 % SDS.
Repeat steps 3 through 7 for each of the pseudopodia filters of a 6-well dish. Transfer the lysate to a 1.5 mL microfuge tube. Boil at 100 °C for 5 min and freeze the sample at −80 °C for further use.
3.3 Gel Separation, In-Gel Digestion, Stable Isotope Dimethyl Labeling, and MudPIT
In-solution digestion and stable isotope labeling are also compatible with the above cytoskeleton enrichment protocols as well as the MudPIT procedures listed below. However, in our experience in-gel digestion of proteins isolated by gel electrophoresis gives better digestion efficiency and a wider dynamic range of protein identification.
Determine the protein concentration using the BCA protein assay, a microplate spectrophotometer, and a series of pre-diluted BSA protein standards.
Load protein samples onto a NuPage 4–12 % Bis-Tris gel.
Separate the proteins with 180 V constant voltage for 50 min.
Stain the gel with Coomassie Blue for 3 h.
Destain the gel with destaining buffer until bands are very clean.
Cut each lane of the gel into 14 bands and cut each band into small pieces separately.
Destain the gel cubes with 50 % MeOH.
Dehydrate the gel cubes with 100 % ACN and dry the cubes.
Add 10 mM DTT (enough to cover gel pieces) and incubate at 56 °C for 20 min.
Remove the DTT solution, dehydrate the gel cubes with 100 % ACN, and dry.
Add 50 mM iodoacetamide (enough to cover gel pieces) at room temperature and incubate in the dark for 20 min.
Remove the iodoacetamide solution, dehydrate the gel cubes with 100 % ACN, and dry.
Add enough trypsin solution to cover gel pieces and incubate at 37 °C overnight.
Extract peptides from the gel cubes with 50 % ACN/1 % formic acid.
Dry the samples in a centrifugal vacuum concentrator.
Dissolve the samples with 100 μL 100 mM of TEAB (see Note11).
Add 4 μL of 4 % (vol/vol) CH2O and 13CD2O to the sample to be labeled with light and heavy dimethyl, respectively (see Note12).
Mix briefly and spin the solution down.
Add 4 μL of 0.6 M NaBH 3 CN to the samples to be light and add 4 μL of 0.6 M NaBD 3 CN to the samples to be heavy labeled.
Incubate in a fume hood for 1 h at room temperature.
Add 16 μL of 1 % (vol/vol) ammonia solution to quench.
Mix briefly and spin the solution down.
Add 8 μL of formic acid to further quench the reaction.
Mix briefly and spin the solution down.
Dry the samples in a centrifugal vacuum concentrator.
The peptide digests are now ready for mass spectrometry using MudPIT identification methods [22].
A fused-silica capillary column (100 μm i.d. × 365 μm o.d.) is pulled with laser puller.
The column is first packed with 10 cm of 5 μm C18 resin followed by 4 cm of 5 μm strong cation exchange resin and 4 cm of 5 μm C18 resin.
The column is placed in-line with the LC-MS system.
Four buffer solutions are used for the chromatography (buffers A–D).
A fully automated salt step chromatography run is carried out on each sample.
Protein identification and quantification are carried out using a search program such as MASCOT and SEQUEST.
3.4 Informatics
Data sets may be entered into freeware (e.g., FatiGO/Babelomics, http://babelomics.bioinfo.cipf.es/index.html) [23 – 26] or payware (e.g., IPA, http://www.ingenuity.com) bioinformatics packages. These platforms enable rapid comparison of large data sets against signaling pathway databases such as BioCarta (www.biocarta.com/genes/index.asp), KEGG (www.genome.jp/kegg), or EMBL-EBI (www.ebi.ac.uk/interpro/index.html) to find biological relationships among data sets in regard to known and/or predicted cellular and molecular functions. Importantly, the insoluble fraction quantified from the pseudopodia shows a significant enrichment for proteins that mediate cell assembly, morphology, and motility (Fig. 5a and Table 1).
In regard to the IPA analysis software, Ingenuity is a bioinfor-matics resource that facilitates the mapping of signaling networks and interactomes involving a range of biomolecules as they relate to normal physiological and pathophysiological functions [27, 28]. Using this comprehensive informatics program it is possible to model, analyze, and understand the complex integration of biological systems. IPA utilizes the Ingenuity Knowledge Base, a large repository of biological interactions and functional annotations created from millions of individually modeled relationships between proteins, genes, complexes, cells, tissues, drugs, and diseases. These modeled relationships include links to original articles and are manually reviewed biweekly for accuracy. It includes information from a wide range of published biomedical literature, textbooks, reviews, internally curated knowledge pathways, and a variety of established informatics sources and databases (e.g., EntrezGene, RefSeq, OMIM disease associations, KEGG, GWAS, LIGAND, and BIND).
Fig. 5.
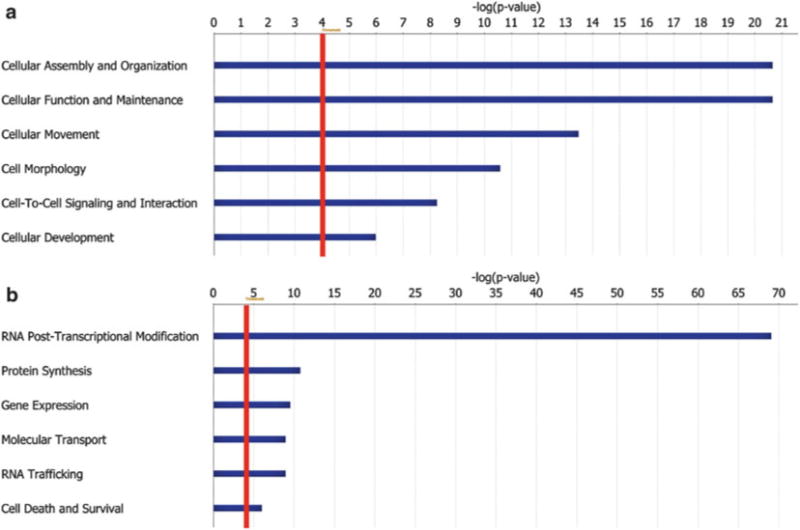
Top 6 molecular and cellular functions annotated (using IPA software) for the pseudopodia cytoskeleton (a) and cell body cytoskeleton (b) fractions (red line represents a p -value threshold <0.0001)
Table 1.
Top 20 proteins enriched in the pseudopodia cytoskeleton fraction
| ID | Symbol | Entrez gene name |
|---|---|---|
| IPI00380436 | ACTN1 | Actinin, alpha 1 |
| IPI00420172 | AGFG1 | ArfGAP with FG repeats 1 |
| IPI00308852 | DAB2 | Disabled homolog 2, mitogen-responsive phosphoprotein (Drosophila) |
| IPI00378015 | DBNL | Drebrin-like |
| IPI00115492 | EPS8L2 | EPS8-like 2 |
| IPI00330862 | EZR | Ezrin |
| IPI00353563 | FSCN1 (includes EG:14086) | Fascin homolog 1, actin-bundling protein (Strongylocentrotus purpuratus) |
| IPI00311726 | HIP1R | Huntingtin interacting protein 1 related |
| IPI00110588 | MSN | Moesin |
| IPI00453692 | NES | Nestin |
| IPI00309768 | PDLIM1 | PDZ and LIM domain 1 |
| IPI00653381 | PDLIM5 | PDZ and LIM domain 5 |
| IPI00264501 | PICALM | Phosphatidylinositol-binding clathrin assembly protein |
| IPI00554989 | PPIA | Peptidylprolyl isomerase A (cyclophilin A) |
| IPI00653921 | RDX | Radixin |
| IPI00474602 | RNF31 | Ring finger protein 31 |
| IPI00468418 | STAM2 | Signal transducing adaptor molecule (SH3 domain and ITAM motif) 2 |
| IPI00125778 | TAGLN2 | Transgelin 2 |
| IPI00314748 | WDR1 | WD repeat domain 1 |
| IPI00387422 | ZYX | Zyxin |
Acknowledgments
This work was supported by the NIH- IRACDA (NIH— Institutional Research and Academic Career Development Award) Postdoctoral Fellowship GM06852 (J.A. Kelber) and NIH grants CA097022 and CA129231 (R.L. Klemke).
Footnotes
In order to initially validate these methods, we began our studies in fibroblast cell lines. Importantly, these cell models have a well-defined cytoskeleton/adhesion complex network. Furthermore, these cells can be induced to migrate and extend numerous pseudopodia in response to chemical stimuli. In regard to mouse embryonic fibroblasts (MEF), there exists a large pool of knockout line resources with which to immediately validate the roles of novel proteins in regulating cytoskeleton and adhesion domains. Nonetheless, these methods are also compatible with disease-relevant cell types such as fibroblasts harboring oncogenic mutations or primary cancer cells derived from patient tissues.
The Cell Comb gets wet easily from the medium. Do not reuse the Cell Comb when scratching other plates, as the wet comb is not able to sustain sharp edges when used repeatedly and it is difficult to wash away cell debris from previous scratching.
Based upon our cell imaging data (Fig. 4), we predict that a significant amount of cytoskeleton and adhesion complex remodeling will occur during this time frame. By analyzing the kinetic landscape, these experiments can provide important information about the dynamic nature of cell migration after wounding.
By keeping the cell lysis buffer cold, minimal protein and/or phosphoprotein degradation occurs. Based upon biochemical and microscopy analysis, this time point was determined to be the most efficient at extracting the soluble fraction while leaving behind the majority of proteins residing in the insoluble fraction (Figs. 2 and 3).
In order to avoid the need for SDS-PAGE separation of proteins and in-gel digestion methods, a urea-based buffer may be used. However, in our experience, the use of SDS significantly enhances protein extraction and solubility. Alternatively, the SDS can be removed prior to MS analysis by the FASP strategy as described previously by Wisniewski et al. [23].
Other cell lines that extend pseudopodia in response to ECM and growth factor gradients would be expected to work in this assay. We have utilized COS-7, NIH3T3, MEF, PANC-1, and MDA-MB-435 cell lines in this assay.
Before using the membrane filter, make sure that the filter’s edge is completely sealed to avoid media leaking between upper and lower chambers. This prevents the exchange of chemoattractant between chambers and ensures efficient pseudopod extension through membrane pores.
LPA is known as a chemoattractant for NIH3T3 cells to induce directed cell migration [17]. Other chemoattractants may also be used at the appropriate concentrations, depending on the experiment and cell type.
To ensure the formation of the proper chemoattractant gradient, do not shake or bang the dish and remove any bubbles that may have been trapped underneath the filter by gently tilting the chamber to one side.
Before collecting the pseudopodia (or cell body) cytoskeleton, make sure that all the cell body (or pseudopodia) proteins have been removed completely. More than one cotton swab may be required.
Formaldehyde can react with amine, such as ammonium bicarbonate or Tris. The sample should be performed in amine-free solution, such as TEAB.
Formaldehyde solutions and formaldehyde vapors are toxic, so prepare solutions and perform in a fume hood.
References
- 1.Petrie RJ, Doyle AD, Yamada KM. Random versus directionally persistent cell migration. Nat Rev Mol Cell Biol. 2009;10(8):538–549. doi: 10.1038/nrm2729. [DOI] [PMC free article] [PubMed] [Google Scholar]
- 2.Ridley AJ, Schwartz MA, Burridge K, Firtel RA, Ginsberg MH, Borisy G, Parsons JT, Horwitz AR. Cell migration: integrating signals from front to back. Science. 2003;302(5651):1704–1709. doi: 10.1126/science.1092053. [DOI] [PubMed] [Google Scholar]
- 3.Richards TA, Cavalier-Smith T. Myosin domain evolution and the primary divergence of eukaryotes. Nature. 2005;436(7054):1113–1118. doi: 10.1038/nature03949. [DOI] [PubMed] [Google Scholar]
- 4.Avraamides CJ, Garmy-Susini B, Varner JA. Integrins in angiogenesis and lymphangiogenesis. Nat Rev Cancer. 2008;8(8):604–617. doi: 10.1038/nrc2353. [DOI] [PMC free article] [PubMed] [Google Scholar]
- 5.Borner A, Warnken U, Schnolzer M, Hagen J, Giese N, Bauer A, Hoheisel J. Subcellular protein extraction from human pancreatic cancer tissues. Biotechniques. 2009;46(4):297–304. doi: 10.2144/000113090. [DOI] [PubMed] [Google Scholar]
- 6.Ramsby ML, Makowski GS. Differential detergent fractionation of eukaryotic cells. Analysis by two-dimensional gel electrophoresis. Methods Mol Biol. 1999;112:53–66. doi: 10.1385/1-59259-584-7:53. [DOI] [PubMed] [Google Scholar]
- 7.Luna EJ, Hitt AL. Cytoskeleton plasma-membrane interactions. Science. 1992;258(5084):955–963. doi: 10.1126/science.1439807. [DOI] [PubMed] [Google Scholar]
- 8.Cowin P, Burke B. Cytoskeleton-membrane interactions. Curr Opin Cell Biol. 1996;8(1):56–65. doi: 10.1016/s0955-0674(96)80049-4. [DOI] [PubMed] [Google Scholar]
- 9.Chichili GR, Rodgers W. Cytoskeleton-membrane interactions in membrane raft structure. Cell Mol Life Sci. 2009;66(14):2319–2328. doi: 10.1007/s00018-009-0022-6. [DOI] [PMC free article] [PubMed] [Google Scholar]
- 10.Kuo JC, Han XM, Hsiao CT, Yates JR, Waterman CM. Analysis of the myosin-II- responsive focal adhesion proteome reveals a role for beta-Pix in negative regulation of focal adhesion maturation. Nat Cell Biol. 2011;13(4):383–393. doi: 10.1038/ncb2216. [DOI] [PMC free article] [PubMed] [Google Scholar]
- 11.Nebl T, Pestonjamasp KN, Leszyk JD, Crowley JL, Oh SW, Luna EJ. Proteomic analysis of a detergent-resistant membrane skeleton from neutrophil plasma membranes. J Biol Chem. 2002;277(45):43399–43409. doi: 10.1074/jbc.M205386200. [DOI] [PubMed] [Google Scholar]
- 12.Wang Q, He J, Meng L, Liu Y, Pu H, Ji J. A proteomics analysis of rat liver membrane skeletons: the investigation of actin- and cytokeratin-based protein components. J Proteome Res. 2009;9(1):22–29. doi: 10.1021/pr900102n. [DOI] [PubMed] [Google Scholar]
- 13.Tomazella GG, daSilva I, Thome CH, Greene LJ, Koehler CJ, Thiede B, Wiker HG, de Souza GA. Analysis of detergent- insoluble and whole cell lysate fractions of resting neutrophils using high-resolution mass spectrometry. J Proteome Res. 2010;9(4):2030–2036. doi: 10.1021/pr1000253. [DOI] [PubMed] [Google Scholar]
- 14.Xu P, Crawford M, Way M, Godovac- Zimmermann J, Segal AW, Radulovic M. Subproteome analysis of the neutrophil cytoskeleton. Proteomics. 2009;9(7):2037–2049. doi: 10.1002/pmic.200800674. [DOI] [PMC free article] [PubMed] [Google Scholar]
- 15.Schneider L, Cammer M, Lehman J, Nielsen SK, Guerra CF, Veland IR, Stock C, Hoffmann EK, Yoder BK, Schwab A, Satir P, Christensen ST. Directional cell migration and che-motaxis in wound healing response to PDGF-AA are coordinated by the primary cilium in fibroblasts. Cell Physiol Biochem. 2010;25(2–3):279–292. doi: 10.1159/000276562. [DOI] [PMC free article] [PubMed] [Google Scholar]
- 16.Nobes CD, Hall A. Rho GTPases control polarity, protrusion, and adhesion during cell movement. J Cell Biol. 1999;144(6):1235–1244. doi: 10.1083/jcb.144.6.1235. [DOI] [PMC free article] [PubMed] [Google Scholar]
- 17.Cho SY, Klemke RL. Purification of pseudopodia from polarized cells reveals redistribution and activation of Rac through assembly of a CAS/Crk scaffold. J Cell Biol. 2002;156(4):725–736. doi: 10.1083/jcb.200111032. [DOI] [PMC free article] [PubMed] [Google Scholar]
- 18.Wang Y, Ding SJ, Wang W, Jacobs JM, Qian WJ, Moore RJ, Yang F, Camp DG, II, Smith RD, Klemke RL. Profiling signaling polarity in chemotactic cells. Proc Natl Acad Sci USA. 2007;104(20):8328–8333. doi: 10.1073/pnas.0701103104. [DOI] [PMC free article] [PubMed] [Google Scholar]
- 19.Wang Y, Ding SJ, Wang W, Yang F, Jacobs JM, Camp D, II, Smith RD, Klemke RL. Methods for pseudopodia purification and pro-teomic analysis. Sci STKE. 2007;2007(400):l4. doi: 10.1126/stke.4002007pl4. [DOI] [PubMed] [Google Scholar]
- 20.Wang Y, Kelber JA, Tran Cao HS, Cantin GT, Lin R, Wang W, Kaushal S, Bristow JM, Edgington TS, Hoffman RM, Bouvet M, Yates JR, III, Klemke RL. Pseudopodium- enriched atypical kinase 1 regulates the cytoskeleton and cancer progression [corrected] Proc Natl Acad Sci USA. 2010;107(24):10920–10925. doi: 10.1073/pnas.0914776107. [DOI] [PMC free article] [PubMed] [Google Scholar]
- 21.Wang Y, Klemke RL. Biochemical purification of pseudopodia from migratory cells. Methods Mol Biol. 2007;370:55–66. doi: 10.1007/978-1-59745-353-0_5. [DOI] [PubMed] [Google Scholar]
- 22.Washburn MP, Wolters D, Yates JR. Large-scale analysis of the yeast proteome by multidimensional protein identification technology. Nat Biotechnol. 2001;19(3):242–247. doi: 10.1038/85686. [DOI] [PubMed] [Google Scholar]
- 23.Wisniewski JR, Zougman A, Nagaraj N, Mann M. Universal sample preparation method for proteome analysis. Nat Methods. 2009;6(5):359–362. doi: 10.1038/nmeth.1322. [DOI] [PubMed] [Google Scholar]
- 24.Medina I, Carbonell J, Pulido L, Madeira SC, Goetz S, Conesa A, Tarraga J, Pascual-Montano A, Nogales-Cadenas R, Santoyo J, Garcia F, Marba M, Montaner D, Dopazo J. Babelomics: an integrative platform for the analysis of transcriptomics, proteomics and genomic data with advanced functional profiling. Nucleic Acids Res. 2010;38:W210–213. doi: 10.1093/nar/gkq388. Web Server issue. [DOI] [PMC free article] [PubMed] [Google Scholar]
- 25.O’Donoghue SI, Gavin AC, Gehlenborg N, Goodsell DS, Heriche JK, Nielsen CB, North C, Olson AJ, Procter JB, Shattuck DW, Walter T, Wong B. Visualizing biological data-now and in the future. Nat Methods. 2010;7(3 Suppl):S2–4. doi: 10.1038/nmeth.f.301. [DOI] [PubMed] [Google Scholar]
- 26.Gehlenborg N, O’Donoghue SI, Baliga NS, Goesmann A, Hibbs MA, Kitano H, Kohlbacher O, Neuweger H, Schneider R, Tenenbaum D, Gavin AC. Visualization of omics data for systems biology. Nat Methods. 2010;7(3 Suppl):S56–68. doi: 10.1038/nmeth.1436. [DOI] [PubMed] [Google Scholar]


