

Abstract
Background
Patients with glioblastoma multiforme (GBM) exhibit marked intratumoral and systemic immunosuppression. GBM is heavily infiltrated with monocytic cells. Monocytes contacting GBM cells develop features of immunosuppressive myeloid-derived suppressor cells (MDSCs), which are elevated in GBM patients. Therefore, we hypothesized that circulating MDSC levels could be raised in vivo by increasing glioma-associated macrophages.
Methods
GL261-luciferase glioma was implanted intracranially in C57BL/6 mice with or without additional normal syngeneic CD11b+ monocytes. Tumor growth and intratumoral and systemic MDSC (CD11b+/Gr-1+) levels were determined. Green fluorescent protein (GFP)–transgenic monocytes were coinjected intracranially with GL261-luciferase cells. GFP+ cell frequency among splenic and bone marrow MDSCs was determined. Impact of increased MDSC's on spontaneous immune responses to tumor cells expressing a model antigen (ovalbumin [OVA]) was determined.
Results
Tumors grew faster and MDSC's were increased in tumor, spleen, and bone marrow in mice receiving GL261-Luc plus monocytes. Many (30%–50%) systemic MDSC's were GFP+ in mice receiving intracranial tumor plus GFP-transgenic monocytes, suggesting that they originated from glioma-associated monocytes. Tumor-infiltrating OVA-specific CD8+ T cells were markedly reduced in mice receiving GL261-OVA and monocytes compared with mice receiving GL261-OVA alone.
Conclusions
Increasing glioma-associated macrophages in intracranial GL261 glioma decreases survival and markedly increases intratumoral and systemic MDSC's, many of which originate directly from glioma-associated macrophages. This is associated with decreased spontaneous immune responses to a model antigen. To our knowledge, this is the first evidence in cancer that systemic MDSC's can arise directly from normal monocytes that have undergone intratumoral immunosuppressive education.
Keywords: glioma, GL261, immunosuppression, myeloid-derived suppressor cell, tumor-associated macrophage
Malignant gliomas such as glioblastoma multiforme (GBM) are the most common primary brain tumors and are highly lethal.1 Given their relatively poor response to standard treatment with surgery, radiation, and chemotherapy, they are an attractive target for novel therapies such as tumor vaccines.2,3 However, GBM' is characterized by marked immunosuppression, which can limit vaccines' efficacy. GBM cells express multiple immunosuppressive factors, including secreted agents (transforming growth factor [TGF]–β2, prostaglandin-E2) and surface molecules (B7–homolog [H]1).4,5 Furthermore, GBM tumors are heavily infiltrated by monocytes/macrophages, which can represent 5%–20% of viable cells within contrast-enhancing tumor.6 Far from representing an effective immune response, these cells appear to have been subverted by the tumor and become actively immunosuppressive through a number of mechanisms, including expression of interleukin (IL)-10, TGF-β2, Fas-ligand, and B7-H1.7,8
Not only do GBM tumors represent a hostile microenvironment for antitumor immune responses, but GBM patients experience significant systemic immunosuppression. Total T-cell counts are reduced and some data suggest that CD4 counts in GBM patients are comparable to CD4 counts in patients with AIDS.9 T-cell function is markedly abnormal as well, with decreased response to nonspecific mitogens such as phytohemagglutinin and anti-CD3/anti-CD28 antibodies.9,10 Multiple factors may underlie these changes, but increases in circulating immunosuppressive cell populations such as regulatory T cells (TRegs) and myeloid-derived suppressor cells (MDSC's) may be key.8,11
The relationship between intratumoral and systemic immunosuppression in GBM patients is unclear. Known immunosuppressive cytokines and prostaglandins secreted by GBM cells are either absent in GBM patients' serum or not elevated compared with normal donors.8,9 This suggests the possibility of an immunosuppressive cell network in GBM patients where inflammatory cells are recruited to GBM tumors, undergo immunosuppressive education, and then reenter the circulation to mediate systemic immunosuppression.12 In support of this, we have previously demonstrated that normal human monocytes acquire immunosuppressive features of MDSCs upon exposure to GBM cells in vitro.8 Direct cell-to-cell contact is required for the full expression of this phenotype in monocytes.
GBM is heavily infiltrated with monocytes but few lymphocytes.6 In contrast, both MDSCs and TRegs are increased in GBM patients' blood.8,11 We hypothesized that glioma-associated monocytes are converted to immunosuppressive MDSC's that reenter the circulation. Some evidence suggests that MDSC's can stimulate TReg proliferation,13,14 and we speculated that this might be the case in glioblastomas. We tested these hypotheses in vivo using a murine glioma model (GL261) syngeneic in C57BL/6 mice.
Materials and Methods
Cell Lines
GL261 wild-type cells were a generous gift obtained from Dr Robert Prins (Department of Neurosurgery, University of California Los Angeles). This line was grown at 37°C, 5% CO2 in Dulbecco's modified Eagle's medium–F12 supplemented with 10% fetal calf serum. Subclones stably transfected with the luciferase reporter gene and the puromycin-resistant gene (GL261-Luc) or luciferase, chicken ovalbumin, and puromycin-resistant ovalbumin (GL261-OVA) were generous gifts of the late Dr John Ohlfest (Departments of Neurosurgery and Pediatrics, University of Minnesota). These were cultured in an identical fashion to the wild-type cells except that media were additionally supplemented with puromycin (1 µg/mL; Sigma) to maintain positive selection for luciferase-expressing and/or OVA-expressing cells.
Cytokine Expression Profile Array
Secreted cytokine profiles from wild-type GL261 and GL261-Luc cell lines were screened using a semiquantitative, sandwich-based, membrane antibody array (Mouse Cytokine Array C1, Ray Biotech). Briefly, wild-type GL261 and GL261-Luc cells were plated in 12-well culture plates and fed serum-free media for 24 h, after which the media were collected and placed on the array membrane for 1 h. The membranes were then prepared following manufacturer's recommended protocol.
Colony-Stimulating Factor 1 Expression Assay
Culture supernatant from GL261 wild-type and GL261-Luc cells growing at 80% confluence was harvested after 24 h, microcentrifuged to remove cells and debris, and stored at −20°C until testing. It was then thawed at room temperature and used immediately for a colony-stimulating factor 1 (CSF-1) enzyme linked immunosorbent assay (ELISA; R+D Systems) performed per the manufacturer's specifications and normalized to total protein content using the Bio-Rad Bradford protein assay kit.
Flow Cytometry and Immunofluorescent Staining
Single cell suspensions were generated from tumor cells, splenocytes, or bone marrow cells. Staining was performed for B7-H1, CD11b, Gr-1, Ly6C, Ly6G, CD4, CD8, CD25, and/or FoxP3 using commercially available antibodies (eBioscience) per the manufacturers' recommendations. H2Kb-OVA tetramers were generated as previously described.15 Flow cytometry data were acquired using a Becton Dickinson FACSCalibur flow cytometer. Analysis was performed with FloJo software.
Immunofluorescent staining
Immunofluorescent staining was performed on paraffin-embedded intracranial tumor and/or brain specimens. Briefly, 10-micron sections were deparaffinized by heating to 55°C for 5 min and placed in xylene and a series of graded ethanol dilutions to rehydrate tissue. Antigen retrieval was performed immersing slides in 10 mM sodium citrate (pH 6.0) and heating them in a vegetable steamer for 30 min. Tissue samples were blocked with 10% normal goat serum for 30 min and then incubated for 1 h with a cocktail of rabbit anti-luciferase antibody (AbCam) and rat anti-F480 antibody (AbD Serotech). All antibodies were diluted 1:250 in phosphate buffered saline (PBS) prior to use. A secondary antibody cocktail of goat anti-rabbit Cy-5 (Jackson Immuno Research) and goat anti-rat Cy-3 (Jackson Immuno Research) was added and incubated for 45 min. Coverslips were mounted using Prolong Gold mounting media containing 4′,6′-diamidino-2-phenylindole (DAPI; Invitrogen) and the slides were visualized using a Zeiss LSM 510 laser scanning confocal microscope.
Monocyte Purification
Spleens were harvested from 6-week-old C57BL/6 mice (Jackson Laboratories), minced, and converted to a single cell suspension by mechanical dissociation. Red blood cell lysis was accomplished with brief osmotic shock. The resulting splenocytes were incubated with CD11b-coated magnetic beads (Miltenyi), and CD11b+ and CD11b− fractions were separated on a magnetic column per the manufacturer's specifications.
Intracranial Tumor Model
Six-week-old C57BL/6 mice were anesthetized with an intraperitoneal injection of ketamine and xylene. The scalp hair was clipped and a small scalp incision was made. A microdrill was used to create a right frontal burr hole ∼ 2 mm lateral to the midline and ∼1 mm anterior to the bregma. A Hamilton syringe was used to inject 50 μL PBS containing 1 × 10⁵ CD11b+ monocytes and/or 1 × 10⁴ GL261-Luc cells into the right frontal lobe. The scalp was then closed with a single suture. Mice were then monitored daily and sacrificed when they became ill (from neurological symptoms, weight loss, etc). In addition, tumor growth was monitored weekly postinjection by bioluminescent imaging with a Xenogen IVIS 200 imaging system following intraperitoneal injection of 200 μL of a 15 mg/mL stock solution of D-Luciferin K salt (Gold Biotechnology).
Results
Like human glioblastomas, GL261 cells express the immunosuppressive T-cell costimulatory molecule homolog B7-H1. This was maintained in both wild-type and GL261-Luc cells (Fig. 1A). Although a general pattern of monocyte and/or neutrophil chemoattractant cytokine expression including CXCL5, lymphotactin, and monocyte chemoattractant protein 1 (MCP-1) was also detected in both wild-type and GL261-Luc cells (Fig. 1B), while other cytokines with monocyte chemoattractive properties expressed by human glioblastomas like IL-64,16 showed only minimal expression. Interestingly, CSF-1, a cytokine with similar properties that is highly expressed by human gliomas,4,16 was expressed by wild-type GL261 but appeared to have reduced expression in the GL261-Luc line (Fig. 1C). We subsequently confirmed these screening assay results with a CSF-1 ELISA (Supplementary Fig. S1). Thus, GL261 appears to be an immunocompetent model system but with reduced monocyte/neutrophil chemoattractant properties compared with human gliomas. However, systemic immunosuppression and, specifically, systemic MDSCs have not been prominent in earlier reports with this model.17–19 Unmodified, this model might have relatively impaired ability to attract monocytes compared with human glioblastomas. It is also rapidly fatal (∼3 wk) when standard amounts of tumor cells (1 × 10⁵) are injected intracranially. This may limit time available for systemic immunosuppression to develop compared with patients with glioblastoma. We hypothesized that it might be possible to increase systemic MDSC's by increasing glioma-associated macrophages and decreasing the number of tumor cells injected to 1 × 10⁴ (Fig. 1D).
Fig. 1.

Variation in immune phenotype between GL261 and GL261-Luc. (A) Representative flow cytomtery histograms demonstrating modest constitutive B7-H1 expression by both GL261 and GL261-Luc. Clear histograms = isotype control. Shaded histograms = anti–B7-H1 antibody. Numbers represent standardized fluorescence intensity. (B) Cytokine expression arrays for GL261 and GL261-Luc. Both express similar amounts of IL-4, CXCL5, lymphotactin, and MCP-1 but minimal IL-6. CSF-1 expression (oval) was reduced in GL261-Luc. (C) Densitometry results from cytokine expression array (relative light intensity compared with total protein positive control) confirming significant reduction in CSF-1 expression by GL261-Luc compared with GL261 (mean ± SD; *P < .05). (D) Schematic of proposed in vivo model system, including representative flow cytometry histograms documenting ∼90% purity of CD11b+ splenocytes after magnetic sorting.
Mice receiving intracranial GL261-Luc alone or GL261-Luc plus monocytes demonstrated tumor growth by bioluminescence within a week of implantation and all died within 60 days. However, mice receiving both GL261-Luc and monocytes showed a trend to increased bioluminescence compared with GL261 alone by day 7 that was never reversed (Fig. 2A). Furthermore, median survival for GL261-Luc/monocyte mice was reduced compared with mice receiving GL261-Luc alone (31 d vs 39 d, P = .02) (Fig. 2B). Immunofluorescent staining confirmed increased glioma-associated macrophages present within tumors from GL261-Luc/monocyte mice compared with GL261-alone mice when they succumbed to their tumors (Fig. 2 C). Flow cytometry also indicated an increase in CD11b+/Gr-1+ MDSC's within GL261-Luc/monocyte tumors compared with GL261-alone tumors (Fig. 2D). These cells were predominantly CD11b+/Gr-1lo cells, indicating a monocytic-MDSC (M-MDSC) phenotype20 (see also Fig. 5 below), and the ratio of CD11b+/Gr-1lo (M-MDSC) to CD11b+/Gr-1hi (granulocytic, or G-MDSC) did not change when total MDSC numbers were increased by coinjecting monocytes with tumor cells.
Fig. 2.
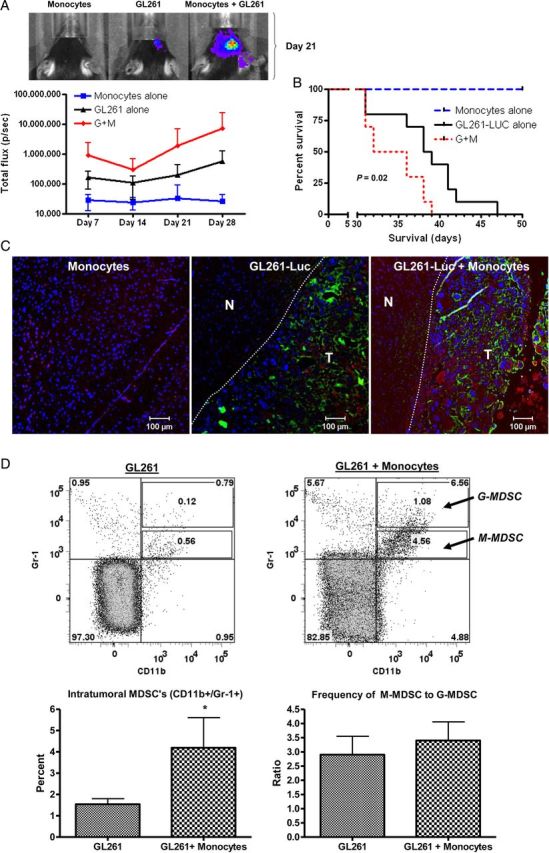
Increasing glioma-associated monocytes increases intracranial GL261-Luc growth. (A) Increased bioluminescence in mice receiving GL261-Luc and monocytes compared with controls with tumor or monocytes alone is apparent by day 7 and never resolves. Representative photographs from mice with bioluminescence closest to mean values at day 21 are shown. G + M = GL261-Luc + monocytes. N = 10 per group. Data = mean ± SEM. (B) Kaplan–Meier curve showing decreased survival for mice receiving GL261-Luc and monocytes. G + M = GL261-Luc + monocytes. N = 10 per group. (C) Representative fluorescence micrographs demonstrating increased monocytes in mice receiving GL261-Luc plus monocytes. Blue = DAPI (nuclei), green = luciferase (tumor), red = F4/80 (monocytes). N = normal brain. T = tumor. Dashed line indicates edge of most defined tumor bulk. (D) Representative flow cytometry dot plots and bar graphs of pooled data from 4 mice per group demonstrating increased frequency of CD11b+/Gr-1+ MDSCs within GL261-Luc + monocyte tumors. Note that these are primarily CD11b+/Gr-1lo M-MDSCs and not CD11+/Gr-1hi G-MDSCs, and the ratio of M-MDSCs to G-MDSCs does not change when MDSC frequency is increased by coinjecting monocytes with tumor cells. *P = .05.
Fig. 5.
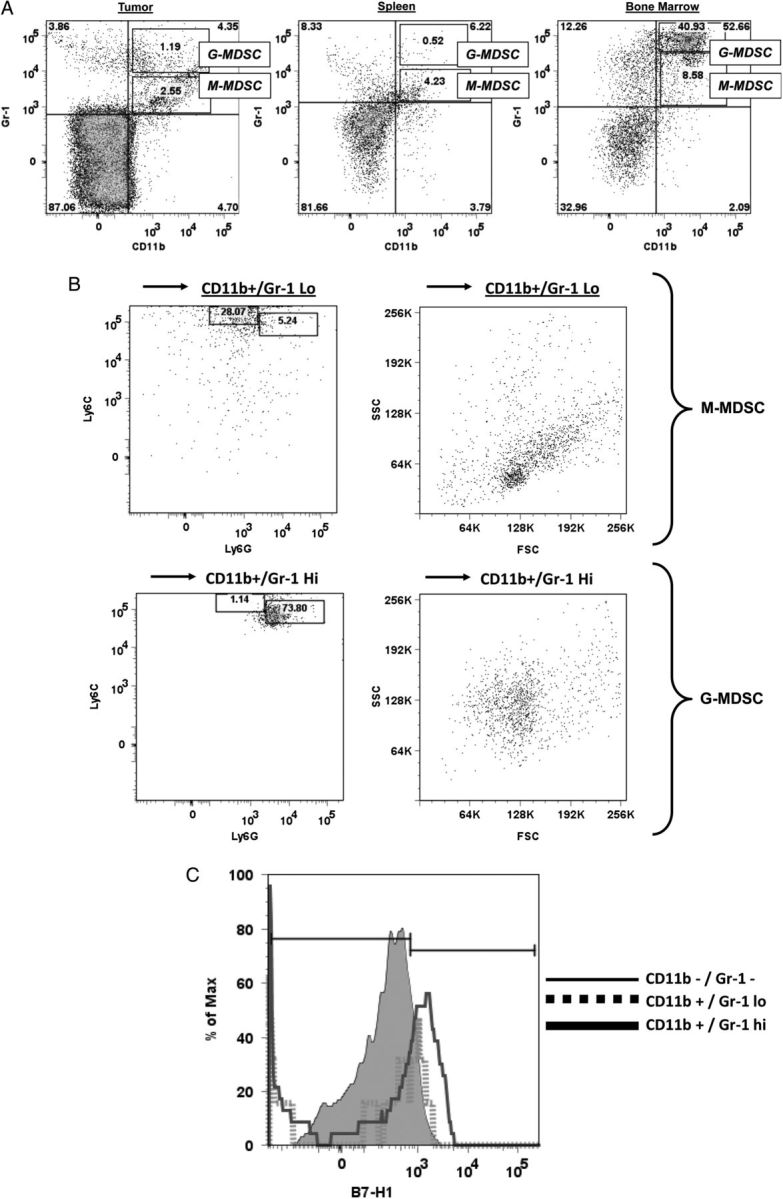
MDSC phenotype varies with location. (A) Representative dot plots showing CD11b+/Gr-1+ MDSCs in tumor, spleen, and bone marrow from mice that received intracranial GL261 + monocytes. Note that 2 MDSC populations can be identified, CD11b+/Gr-1hi (corresponding to G-MDSC) and CD11b+/Gr-1lo (corresponding to M-MDSC). M-MDSCs are more common than G-MDSCs in tumor and spleen, but G-MDSCs are more common in bone marrow. (B) Representative Ly6C/Ly6G expression and forward-scatter (FSC)/side-scatter (SSC) profiles of CD11b+/Gr-1lo or CD11b+/Gr-1hi bone marrow cells. CD11b+/Gr-1lo cells are largely Ly6Chi/Ly6Glo and are relatively smaller and less granular, compatible with M-MDSCs. CD11b+/Gr-1hi cells are largely Ly6Clo/Ly6Ghi and are relatively larger and more granular, compatible with G-MDSCs. (C) Histogram demonstrating increased B7-H1 expression in CD11b+/Gr-1hi cells (G-MDSCs) compared with CD11b+/Gr-1lo cells (M-MDSCs) or non-MDSC cells (CD11b−/Gr-1−).
Figure 3A shows representative dot plots demonstrating the gating strategy used to determine MDSC levels in splenocytes in normal mice, in mice receiving intracranial monocytes, in mice receiving intracranial GL261-Luc, and in mice receiving GL261-Luc plus monocytes. A forward scatter and side-scatter gate was placed around monocytes and granulocytes, as MDSC's have features of both of these populations. CD11b and Gr-1 staining in this population was then determined. MDSC's (CD11b+/Gr-1+) cells were not increased above background in spleen or bone marrow of mice receiving intracranial monocytes alone or intracranial GL261-Luc alone. However, mice that received both intracranial GL261-Luc and monocytes had significantly more MDSC's than controls (8.0% ± 1.2% vs 4.3% ± 0.8%; P = .0407; N = 10 per group) (Fig. 3A and B). Similar results were seen in bone marrow (16.3% ± 1.8% vs 5.0% ± 1.8%; P = .0056; N = 10 per group) (Fig. 3C–F). Interestingly, forward scatter/side-scatter analysis revealed 3 distinct monocytic/granulocytic subsets in bone marrow, which we labeled R1–R3 (Fig. 3C). All 3 subgroups demonstrated large numbers of CD11b+/Gr-1+ cells corresponding to MDSC's, but these were increased as a percentage of total bone marrow cells in mice receiving GL261-Luc plus monocytes compared with control mice only in subgroups R1 and R2 (Fig. 3D–F). This suggests that bone marrow MDSC's increased in mice receiving tumor, and monocytes may be slightly smaller (reduced forward scatter) compared with baseline MDSC's. The significance (if any) of this size difference is unknown.
Fig. 3.


Increasing glioma-associated monocytes leads to increased systemic MDSCs. (A) Representative dot plots showing gating strategy for monocytes/granulocytes in splenocytes and identifying CD11b+/Gr-1+ MDSCs from among these. SSC, side scatter. (B) Bar graph showing that CD11b+/Gr-1+ MDSCs are increased in splenocytes of mice receiving intracranial GL261-Luc plus monocytes (G + M). N = 10/group. ns = not significant. (C) Representative dot plots demonstrating gating strategy to identify monocytes/granulocytes in bone marrow and identifying CD11b+/Gr-1+ MDSCs from among these. Note that 3 populations corresponding to monocytes/granulocytes (R1–R3) were identified with similar side scatter (SSC) but increasing forward scatter (FSC) (size). Increases in MDSCs were primarily seen in the R1 and R2 (smaller size) gates in mice receiving both intracranial tumor and monocytes. These MDSCs also had a relative reduction in the intensity of CD11b expression. (D) Bar graph showing increased MDSCs in the R1 bone marrow gate (small size monocytes/granulocytes) in mice receiving both intracranial tumor and monocytes. N = 10/group. (E) Bar graph showing increased MDSCs in the R2 bone marrow gate (intermediate size monocytes/granulocytes) in mice receiving both intracranial tumor and monocytes. N = 10/group. (F) Bar graph showing no change in MDSCs in the R3 bone marrow gate (large monocytes/granulocytes) in mice receiving both intracranial tumor and monocytes. N = 10/group. All bar graphs = mean ± SEM. *P < .05, **P < .01.
Because a role for MDSC's in increasing TREG frequency has been reported in other cancers, we sought to determine TREG frequency in our modified GL261 model. Our gating strategy to determine TREG frequency in splenocytes of the same mice analyzed in Fig. 3 (N = 10 per group) is demonstrated in Supplementary Fig. S2A. A lymphocyte gate was first established by forward scatter/side-scatter analysis (not shown). Subsequently, CD4+ T-cell frequency amongst all lymphocytes was determined and TREG frequency among these CD4+ cells was determined by determining CD25+/FoxP3+ frequency. In marked contrast to our findings for systemic MDSC's, CD4+/CD25+/FoxP3+ TREG levels were not significantly altered in spleen in any mice compared with controls, regardless of whether they received intracranial GL261-Luc alone or GL261-Luc plus monocytes. This was the case whether TREG's were analyzed as a percentage of total lymphocytes (Supplementary Fig. S2B) or as a percentage of total CD4+ cells (Supplementary Fig. S2C). Similar findings were seen in bone marrow (data not shown).
To determine if increased MDSC's in mice receiving tumor plus monocytes originated systemically or from glioma-associated monocytes, we performed experiments where green fluorescent protein (GFP)–transgenic monocytes were coinjected with tumor cells. Representative zebra plots of our gating strategy are shown in Fig. 4A. The frequency of GFP+ cells in all granulocytic/monocytic cells (determined by forward scatter and side-scatter gating) was determined in both spleen and bone marrow in mice receiving GL216-Luc plus GFP+ monocytes and compared with the frequency of GFP+ cells in CD11b+/Gr-1+ MDSC's in the same animals. Mice receiving intracranial GL261-Luc plus GFP+ monocytes showed a marked enrichment of GFP+ cells among CD11b+/Gr-1+ MDSC's compared with all monocytes/granulocytes identified by forward and side scatter (Fig. 4A). Bar graphs showing the frequency of GFP+ MDSC's in spleen and bone marrow for GFP-transgenic mice, wild-type mice, and wild-type mice receiving intracranial GL261-Luc plus GFP+ monocytes (2 wk and 5 wk post-implantation) are shown in Fig. 4B and C (N = 3 per group). As expected, splenocytes (Fig. 4B) and bone marrow cells (Fig. 4C) from GFP-transgenic mice without tumor (positive controls) were essentially 100% GFP+. Compared with background fluorescence levels detected in CD11b+/Gr-1+ MDSC's in wild-type mice (negative controls), GFP+ MDSC's were increased in both splenocytes (54.2% ± 7.8% vs 2.4% ± 1/8%; P = .0001) and bone marrow (31.4% ± 1.9% vs 0.9% ± 0.4%; P = .0003) 2 weeks post-implantation (Fig. 4B andC). This increase in systemic GFP+ MDSC appeared transient in splenocytes, where it was undetectable by 5 weeks post-implantation (Fig. 4B). However, it persisted at 5 weeks in bone marrow (Fig. 4C). Intracranial induction of MDSC's by coinjection of glioma cells and monocytes therefore led to a long-term persistence of increased MDSC's peripheral to the central nervous system that had originated from glioma-associated monocytes.
Fig. 4.

Many systemic MDSCs originate from glioma-associated monocytes. (A) Representative flow cytometry zebra plots of splenocytes and bone marrow from a mouse that received intracranial GL261-Luc plus syngeneic GFP-transgenic monocytes 2 weeks earlier. Note that there are very few GFP+ cells among monocytes/granulocytes as a whole but that gating on CD11b+/Gr-1+ MDSCs from among these cells demonstrates that large numbers are GFP+, suggesting that they originated from glioma-associated monocytes. (B) Bar graphs demonstrating increased GFP+ splenic MDSCs in mice receiving intracranial tumor plus GFP+ monocytes compared with normal (wild-type) controls 2 weeks post-intracranial injection. This is absent by 5 weeks after injection. Note: splenic MDSCs from GFP-transgenic mice are included as positive controls. N = 3 per group. (C) Bar graphs demonstrating increased GFP+ bone marrow MDSCs in mice receiving intracranial tumor plus GFP+ monocytes compared with normal (wild-type) controls 2 weeks post-intracranial injection. This is persistent 5 weeks after injection. Note: bone marrow MDSCs from GFP-transgenic mice are included as positive controls. N = 3 per group. All bar graphs = mean ± SEM. *P = .05, ***P < .001.
MDSC's can be divided into 2 populations: M-MDSCs, defined as CD11b+/Gr-1lo and CD11b+/Ly6Chi/Ly6Glo, and G-MDSCs, defined as CD11b+/Gr-1hi or CD11b+/Ly6Clo/Ly6Ghi.20 Subpopulations of CD11b+/Gr-1lo (M-MDSC) and CD11b+/Gr-1hi (G-MDSC) are present in both intratumoral and systemic MDSCs in our modified GL261 model (Fig. 5A). In addition, CD11b+/Gr-1lo cells are Ly6Chi/Ly6Glo and have a forward scatter/side-scatter profile suggestive of monocytes, while CD11b+/Gr-1hi cells are Ly6Clo/Ly6Ghi and have a forward scatter/side-scatter profile suggestive of granulocytes (Fig. 5B), further confirming the presence of both M-MDSCs and G-MDSCs. Interestingly, MDSC subtype varied with location. MDSCs in tumor and spleen both appeared primarily monocytic, while MDSCs in bone marrow were primarily granulocytic (Fig. 5A). Interestingly, only G-MDSCs appeared to have increased expression of the immunosuppressive T-cell costimulatory molecule B7-H1 (PD-L1) compared with other splenocytes (Fig. 5C). These findings are in keeping with our earlier findings that G-MDSCs that are generated from normal human monocytes by coculture with glioma cells express B7-H1,8 along with findings from others that B7-H1 expression is increased on circulating monocytic cells in glioblastoma patients.21
To determine if presence of increased MDSCs was associated with functional immunosuppression, we employed GL261 cells expressing the immunogenic model antigen chicken ovalbumin (GL261-OVA). Representative data from 1 of 3 experiments are shown in Fig. 6. GL261-OVA cells induce a spontaneous anti-OVA immune response in vivo that can be measured in C57BL/6 mice by flow cytometry using H-2Kb-OVA tetramers. OVA-specific CD8+ T cells localized to intracranial GL261-OVA tumors, but their frequency was reduced in mice that received coinjection of GL261-OVA and monocytes (Fig. 6A and B). In keeping with a strong anti-OVA immune response in mice receiving intracranial GL261-OVA alone, tumor-infiltrating CD45+ leukocytes were very frequent (>30% of viable tumor cells; Fig. 6C) and >50% were CD8+ T cells (Fig. 6D). However, there was a marked trend to decreased tumor-infiltrating leukocytes (Fig. 6C) and a significant reduction in the percentage of CD8+ T cells among tumor-infiltrating leukocytes (Fig. 6D) in mice receiving intracranial GL261-OVA plus monocytes. This provides strong evidence for antigen-specific immunosuppression in these mice with increased MDSCs.
Fig. 6.

Decreased antigen-specific immune response in mice with increased MDSCs. (A) Representative zebra plots showing gating strategy to determine CD8+/H2Kb-OVA–specific frequency among CD45+ leukocytes from tumors of mice receiving GL261-OVA alone or GL261-OVA plus monocytes (increased MDSCs). (B) Bar graph showing significant decrease in tumor-infiltrating OVA-specific CD8+ T cells as a percentage of tumor cells in mice receiving GL261-OVA plus monocytes compared with GL261-OVA alone. (C) Bar graph showing trend to decreased tumor-infiltrating leukocytes (CD45+) as a percentage of tumor cells in mice receiving GL261-OVA plus monocytes compared with GL261-OVA alone. (D) Bar graph showing significant decrease in CD8+ T-cell frequency among tumor-infiltrating CD45+ leukocytes in mice receiving GL261-OVA plus monocytes compared with GL261-OVA alone. N = 3 per group. *P < .05. **P < .01.
Discussion
Unlike many other syngeneic rodent glioma models that are immunogenic22 or that must be introduced into immunocompromised mice (eg, human glioma xenografts or brain tumor stem cells),23,24 the GL261 model system using immunocompetent C57BL/6 mice is increasingly being employed to study glioma immunology and immunotherapy.25–27 Our findings further support a rationale for this. Human glioblastoma cells express class I major histocompatibility complex molecules, immuosuppressive cytokines, and immunosuppressive B7-H1.4,5 Similarly, we have previously demonstrated that GL261 cells express H-2Kb (analogous to class I major histocompatibility complex) (Renner et al, submitted), and we show in this study that they also express immunosuppressive B7-H1 and multiple immunomodulatory cytokines. In keeping with this, intratumoral MDSCs have been reported in the wild-type GL261 model previously.19,25,28 However, systemic MDSCs have not been a prominent feature of this model. This is distinct from patients with glioblastoma.8 We have demonstrated here that IL-6 and CSF-1 (cytokines associated with monocyte chemotaxis and expressed by human glioblastomas) are absent or minimally expressed by GL261. We speculated that this, combined with the relatively rapid tumor growth and mortality in this model system, might not allow enough time to establish a systemic immunosuppressive cell network. We therefore proposed implanting a relatively small amount of tumor cells (104) to allow longer survival and mixing tumor cells with syngeneic monocytes prior to injection to provide glioma-associated macrophages from implantation rather than wait for them to be recruited to an established tumor. Based on our proposed model of an immunosuppressive cell network in which glioma-associated macrophages are associated with systemic immunosuppressive cells,12 we hypothesized that this would yield increased intratumoral and systemic MDSCs that would be associated with immunosuppression and increased tumor growth.
Our findings bear this out. Mice receiving tumor cells with monocytes showed increased tumor growth. As a result, bioluminescence was increased and median survival was reduced compared with mice receiving tumor cells alone (32 d vs 39 d, P = .02). This confirms that monocytes mixed with tumor cells do not simply phagocytose tumor cells. In keeping with this, mice receiving tumor cells plus monocytes had increased intratumoral MDSCs at sacrifice compared with mice receiving tumor cells alone. Furthermore, mice receiving tumor cells mixed with monocytes had more than double the number of splenic and bone marrow MDSCs than mice receiving tumor cells alone or monocytes alone or control mice without intracranial injection. We conclude that increasing glioma-associated monocytes results in increased intratumoral and systemic MDSCs in this model system. Though no data have been published to date directly comparing intratumoral glioma-associated macrophage frequency with systemic MDSC frequency, our previously published findings that normal human monocytes acquire MDSC-like phenotype upon contact with glioma cells8 suggest that increased glioma-associated monocytes/macrophages may be associated with increased systemic MDSCs in patients as well.
In addition to increased circulating MDSCs, GBM patients have increased frequency of immunosuppressive Tregs among CD4+ T cells in their blood.9,11 The source of these Treg's is not clear. Known GBM-derived immunosuppressive cytokines and prostaglandins are not increased in patients' blood.8,9 Some have suggested that tumor-infiltrating CD4+ T cells undergo immunosuppressive education within the tumor to become Tregs prior to reentering the circulation.11,29 However, most GBM specimens contain relatively few tumor-infiltrating lymphocytes,6,16 and MDSCs have been reported to stimulate Tregs in other cancers.13,14 Therefore, we speculated that increasing MDSCs by increasing glioma-associated macrophages would also increase circulating Treg's. This did not prove to be the case. It seems likely that systemic MDSCs do not play a role in the increased Treg levels seen in GBM patients. Rather, Treg's likely accumulate in response to direct GBM microenvironmental factors such as TGF-β and indoleamine 2,3-dioxygenase.30–32 Treg development in GBM' may be distinct from other tumors given that recent evidence suggests that they are predominantly thymus-derived natural Treg's,31 in contrast to other tumor types, where inducible Treg's are more common.32
Our data support an association between increased intracranial glioma-associated macrophages and increased systemic MDSCs. We postulated 2 general mechanisms by which this could occur. First, it is possible that glioma-associated macrophages themselves are the source of systemic MDSCs. This would be in keeping with our previous studies demonstrating that normal human monocytes acquired an MDSC-like phenotype upon contact with glioma cells.8 Alternatively, increased glioma-associated macrophages could lead to increased secretion of immunomodulatory factors that drive MDSC proliferation systemically. Many such factors secreted by GBM' are not increased in patients' blood, with the exception of serum vascular endothelial growth factor.8,9 Of note, vascular endothelial growth factor has been associated with MDSC proliferation.33
When we coinjected GFP-transgenic monocytes intracranially with GL261 cells into wild-type C57BL/6 mice, the majority of splenic and bone marrow CD11b+/Gr-1+ MDSCs 2 weeks later were GFP+. This suggests that a large portion of systemic MDSCs originate from glioma-associated macrophages. To our knowledge, this is the first direct evidence that tumor-associated macrophages in any form of cancer can reenter the circulation as MDSCs. However, not all of the systemic MDSCs were GFP+, and the frequency of GFP+ MDSCs dropped significantly in splenocytes by 5 weeks after tumor/GFP-monocyte coinjection. Thus, it is possible that not all tumor-associated systemic MDSCs originate from glioma-associated macrophages. Alternatively, new systemic monocytes (in this case, GFP−) may be recruited to the tumor over time, undergo immunosuppressive education, and reenter the circulation as immunosuppressive MDSCs.
This latter possibility is most consistent with our data. Like human glioblastomas,4,16 GL261 cells express multiple immunomodulatory factors, such as CXCL5 and MCP-1, that have monocyte chemotactic and stimulatory properties. However, the actual tumor cell line we used in our murine experiments (GL261-Luc) has reduced expression of CSF-1, and neither wild-type GL261 or GL261-Luc expressed IL-6, another monocyte chemotactic cytokine expressed by human GBM tumors.4,16 Lack of IL-6 and CSF-1 expression may partly explain why mixing tumor cells with monocytes prior to injection is necessary in this model to generate increased systemic MDSCs. Glioma-induced immunosuppressive changes in monocytes can begin immediately with coinjection and do not have to wait for monocytes to be recruited to an established tumor. This is in keeping with the increased bioluminescence seen as soon as 1 week post-implantation in mice that received tumors and monocytes compared with mice that received tumor cells alone. However, the fact that GL261 cells secrete multiple monocyte chemotactic molecules suggests that more monocytes will likely be recruited over time. Coinjecting tumors and monocytes simply gives glioma-associated monocytes a “head start.” By injecting a relatively small number of tumor cells, we also increased the median survival in this system to more than 5 weeks compared with 3 weeks in many studies using larger cell numbers (>105 cells).31,34,35 Combined with the monocyte “head start,” prolonged survival may have been critical to allowing this systemic immunosuppressive network to develop.
Our data suggest that MDSC phenotype varies with location. MDSCs within the tumor and in the spleen are predominantly monocytic MDSCs and do not express B7-H1, while those within bone marrow are predominantly G-MDSCs and do express B7-H1 (Figs. 2 and 5). The impact of location on MDSC phenotype has not been reported in GBM' previously, but similar findings have been reported in other cancers.36 Notably, recent reports have suggested that G-MDSCs are the most common MDSC phenotype to accumulate systemically in cancer and are derived from M-MDSCs.20 Our data provide circumstantial evidence supporting a similar pathway in GBM', where monocytes first become converted to intratumoral M-MDSCs under the direct influence of GBM cells and subsequently become G-MDSCs that accumulate systemically in bone marrow.
Finally, it was critical to determine if the increased MDSCs in our model system were associated with increased immunosuppression. In keeping with this, mice receiving GL261-OVA cells plus monocytes had reduced spontaneous anti-OVA CD8+ T-cell responses compared with mice that received GL261-OVA alone. This suggests that mice with increased MDSCs have decreased ability to mount an antigen-specific immune response even against a potently immunogenic antigen like OVA.
This work points to at least 3 distinct pathophysiological events that are important in the glioma-associated macrophage/systemic MDSC axis. First, GBM tumors must recruit monocytes/macrophages. Second, GBM cells must induce immunosuppressive changes in these monocytes/macrophages to convert them to MDSCs. Finally, the MDSCs must leave the tumor and reenter the systemic circulation. Disruption of any one of these events would reduce systemic MDSC accumulation and systemic immunosuppression. The molecular mechanisms underlying these events are not well defined. Further investigation into these mechanisms will be an important avenue to identify therapeutic targets for immunomodulation.
In summary, our data suggest that increasing glioma-associated monocytes in intracranial murine GL261 leads to an increase in intratumoral and systemic MDSCs that are associated with decreased antigen-specific immune responses. Moreover, the majority of the MDSCs appear to originate directly from the intracranial glioma-associated macrophages. These findings are consistent with earlier in vitro findings with human glioblastomas and suggest that there is a cell network present that links intratumoral immunosuppression to systemic immunosuppression through glioma-associated macrophages and MDSCs. This “head start” modification to the GL261 model system may prove useful in studies aimed at understanding and reversing tumor-mediated immunosuppression.
Funding
This work was supported in part by funding from a Helen Houle Career Development Award in Neurosurgery, by the Mayo Clinic Department of Immunology, and by the Mayo Clinic Brain SPORE (National Cancer Institute, 1P50CA108961-06).
Conflict of interest statement. No authors have relevant conflicts of interest to disclose.
Supplementary Material
References
- 1. Stupp R, Mason WP, van den Bent MJ, et al. Radiotherapy plus concomitant and adjuvant temozolomide for glioblastoma. N Engl J Med. 2005;352(10):987–996. [DOI] [PubMed] [Google Scholar]
- 2. Liau LM, Prins RM, Kiertscher SM, et al. Dendritic cell vaccination in glioblastoma patients induces systemic and intracranial T-cell responses modulated by the local central nervous system tumor microenvironment. Clin Cancer Res. 2005;11(15):5515–5525. [DOI] [PubMed] [Google Scholar]
- 3. Sampson JH, Heimberger AB, Archer GE, et al. Immunologic escape after prolonged progression-free survival with epidermal growth factor receptor variant III peptide vaccination in patients with newly diagnosed glioblastoma. J Clin Oncol. 2010;28(31):4722–4729. [DOI] [PMC free article] [PubMed] [Google Scholar]
- 4. Parney IF, Farr-Jones MA, Chang LJ, et al. Human glioma immunobiology in vitro: implications for immunogene therapy. Neurosurgery. 2000;46(5):1169–1177; discussion 1177–1178. [DOI] [PubMed] [Google Scholar]
- 5. Parsa AT, Waldron JS, Panner A, et al. Loss of tumor suppressor PTEN function increases B7-H1 expression and immunoresistance in glioma. Nat Med. 2007;13(1):84–88. [DOI] [PubMed] [Google Scholar]
- 6. Parney IF, Waldron JS, Parsa AT. Flow cytometry and in vitro analysis of human glioma-associated macrophages. Laboratory investigation. J Neurosurg. 2009;110(3):572–582. [DOI] [PMC free article] [PubMed] [Google Scholar]
- 7. Watters JJ, Schartner JM, Badie B. Microglia function in brain tumors. J Neurosci Res. 2005;81(3):447–455. [DOI] [PubMed] [Google Scholar]
- 8. Rodrigues JC, Gonzalez GC, Zhang L, et al. Normal human monocytes exposed to glioma cells acquire myeloid-derived suppressor cell–like properties. Neuro Oncol. 2010;12(4):351–365. [DOI] [PMC free article] [PubMed] [Google Scholar]
- 9. Gustafson MP, Lin Y, New KC, et al. Systemic immune suppression in glioblastoma: the interplay between CD14+HLA-DRlo/neg monocytes, tumor factors, and dexamethasone. Neuro Oncol. 2010;12(7):631–644. [DOI] [PMC free article] [PubMed] [Google Scholar]
- 10. Dix AR, Brooks WH, Roszman TL, et al. Immune defects observed in patients with primary malignant brain tumors. J Neuroimmunol. 1999;100(1–2):216–232. [DOI] [PubMed] [Google Scholar]
- 11. Fecci PE, Mitchell DA, Whitesides JF, et al. Increased regulatory T-cell fraction amidst a diminished CD4 compartment explains cellular immune defects in patients with malignant glioma. Cancer Res. 2006;66(6):3294–3302. [DOI] [PubMed] [Google Scholar]
- 12. Parney IF. Basic concepts in glioma immunology. Adv Exp Med Biol. 2012;746:42–52. [DOI] [PubMed] [Google Scholar]
- 13. Huang B, Pan PY, Li Q, et al. Gr-1+CD115+ immature myeloid suppressor cells mediate the development of tumor-induced T regulatory cells and T-cell anergy in tumor-bearing host. Cancer Res. 2006;66(2):1123–1131. [DOI] [PubMed] [Google Scholar]
- 14. MacDonald KP, Rowe V, Clouston AD, et al. Cytokine expanded myeloid precursors function as regulatory antigen-presenting cells and promote tolerance through IL-10-producing regulatory T cells. J Immunol. 2005;174(4):1841–1850. [DOI] [PubMed] [Google Scholar]
- 15. Bell MP, Renner DN, Johnson AJ, et al. A CD8 T-cell epitope variant enhances immune targeting to a recombinant picornavirus vaccine antigen. Viral Immunol. 2014;27(7):361–366. [DOI] [PMC free article] [PubMed] [Google Scholar]
- 16. Hao C, Parney IF, Roa WH, et al. Cytokine and cytokine receptor mRNA expression in human glioblastomas: evidence of Th1, Th2 and Th3 cytokine dysregulation. Acta Neuropathol. 2002;103(2):171–178. [DOI] [PubMed] [Google Scholar]
- 17. Prins RM, Odesa SK, Liau LM. Immunotherapeutic targeting of shared melanoma-associated antigens in a murine glioma model. Cancer Res. 2003;63(23):8487–8491. [PubMed] [Google Scholar]
- 18. Umemura N, Saio M, Suwa T, et al. Tumor-infiltrating myeloid-derived suppressor cells are pleiotropic-inflamed monocytes/macrophages that bear M1- and M2-type characteristics. J Leukocyte Biol. 2008;83(5):1136–1144. [DOI] [PubMed] [Google Scholar]
- 19. Zhu X, Fujita M, Snyder LA, et al. Systemic delivery of neutralizing antibody targeting CCL2 for glioma therapy. J Neurooncol. 2011;104(1):83–92. [DOI] [PMC free article] [PubMed] [Google Scholar]
- 20. Youn JI, Kumar V, Collazo M, et al. Epigenetic silencing of retinoblastoma gene regulates pathologic differentiation of myeloid cells in cancer. Nat Immunol. 2013;14(3):211–220. [DOI] [PMC free article] [PubMed] [Google Scholar]
- 21. Bloch O, Crane CA, Kaur R, et al. Gliomas promote immunosuppression through induction of B7-H1 expression in tumor-associated macrophages. Clin Cancer Res. 2013;19(12):3165–3175. [DOI] [PMC free article] [PubMed] [Google Scholar]
- 22. Parsa AT, Chakrabarti I, Hurley PT, et al. Limitations of the C6/Wistar rat intracerebral glioma model: implications for evaluating immunotherapy. Neurosurgery. 2000;47(4):993–999; discussion 999–1000. [DOI] [PubMed] [Google Scholar]
- 23. Sarkaria JN, Carlson BL, Schroeder MA, et al. Use of an orthotopic xenograft model for assessing the effect of epidermal growth factor receptor amplification on glioblastoma radiation response. Clin Cancer Res. 2006;12(7 Pt 1):2264–2271. [DOI] [PubMed] [Google Scholar]
- 24. Kelly JJ, Stechishin O, Chojnacki A, et al. Proliferation of human glioblastoma stem cells occurs independently of exogenous mitogens. Stem Cells. 2009;27(8):1722–1733. [DOI] [PubMed] [Google Scholar]
- 25. Fujita M, Zhu X, Ueda R, et al. Effective immunotherapy against murine gliomas using type 1 polarizing dendritic cells—significant roles of CXCL10. Cancer Res. 2009;69(4):1587–1595. [DOI] [PMC free article] [PubMed] [Google Scholar]
- 26. Kuwashima N, Nishimura F, Eguchi J, et al. Delivery of dendritic cells engineered to secrete IFN-alpha into central nervous system tumors enhances the efficacy of peripheral tumor cell vaccines: dependence on apoptotic pathways. J Immunol. 2005;175(4):2730–2740. [DOI] [PubMed] [Google Scholar]
- 27. Olin MR, Andersen BM, Zellmer DM, et al. Superior efficacy of tumor cell vaccines grown in physiologic oxygen. Clin Cancer Res. 2010;16(19):4800–4808. [DOI] [PMC free article] [PubMed] [Google Scholar]
- 28. Fujita M, Kohanbash G, Fellows-Mayle W, et al. COX-2 blockade suppresses gliomagenesis by inhibiting myeloid-derived suppressor cells. Cancer Res. 2011;71(7):2664–2674. [DOI] [PMC free article] [PubMed] [Google Scholar]
- 29. Humphries W, Wei J, Sampson JH, et al. The role of tregs in glioma-mediated immunosuppression: potential target for intervention. Neurosurg Clin North Am. 2010;21(1):125–137. [DOI] [PMC free article] [PubMed] [Google Scholar]
- 30. Savage PA, Malchow S, Leventhal DS. Basic principles of tumor-associated regulatory T cell biology. Trends Immunol. 2013;34(1):33–40. [DOI] [PMC free article] [PubMed] [Google Scholar]
- 31. Wainwright DA, Sengupta S, Han Y, et al. Thymus-derived rather than tumor-induced regulatory T cells predominate in brain tumors. Neuro Oncol. 2011;13(12):1308–1323. [DOI] [PMC free article] [PubMed] [Google Scholar]
- 32. Whiteside TL, Schuler P, Schilling B. Induced and natural regulatory T cells in human cancer. Expert Opin Biol Ther. 2012;12(10):1383–1397. [DOI] [PMC free article] [PubMed] [Google Scholar]
- 33. Fricke I, Mirza N, Dupont J, et al. Vascular endothelial growth factor-trap overcomes defects in dendritic cell differentiation but does not improve antigen-specific immune responses. Clin Cancer Res. 2007;13(16):4840–4848. [DOI] [PubMed] [Google Scholar]
- 34. Cantini G, Pisati F, Mastropietro A, et al. A critical role for regulatory T cells in driving cytokine profiles of Th17 cells and their modulation of glioma microenvironment. Cancer Immunol Immunother. 2011;60(12):1739–1750. [DOI] [PMC free article] [PubMed] [Google Scholar]
- 35. Maes W, Rosas GG, Verbinnen B, et al. DC vaccination with anti-CD25 treatment leads to long-term immunity against experimental glioma. Neuro Oncol. 2009;11(5):529–542. [DOI] [PMC free article] [PubMed] [Google Scholar]
- 36. Montero AJ, Diaz-Montero CM, Kyriakopoulos CE, et al. Myeloid-derived suppressor cells in cancer patients: a clinical perspective. J Immunother. 2012;35(2):107–115. [DOI] [PubMed] [Google Scholar]
Associated Data
This section collects any data citations, data availability statements, or supplementary materials included in this article.