

Abstract
The compact genome of fugu (Takifugu rubripes) has been used widely as a reference genome for understanding the evolution of vertebrate genomes. However, the fragmented nature of the fugu genome assembly has restricted its use for comparisons of genome architecture in vertebrates. To extend the contiguity of the assembly to the chromosomal level, we have generated a comprehensive genetic map of fugu and anchored the scaffolds of the assembly to the 22 chromosomes of fugu. The map consists of 1,220 microsatellite markers that provide anchor points to 697 scaffolds covering 86% of the genome assembly (http://www.fugu-sg.org/). The integrated genome map revealed a higher recombination rate in fugu compared with other vertebrates and a wide variation in the recombination rate between sexes and across chromosomes of fugu. We used the extended assembly to explore recent rearrangement events in the lineages of fugu, Tetraodon, and medaka and compared them with rearrangements in three mammalian (human, mouse, and opossum) lineages. Between the two pufferfishes, fugu has experienced fewer chromosomal rearrangements than Tetraodon. The gene order is more highly conserved in the three teleosts than in mammals largely due to a lower rate of interchromosomal rearrangements in the teleosts. These results provide new insights into the distinct patterns of genome evolution between teleosts and mammals. The consolidated genome map and the genetic map of fugu are valuable resources for comparative genomics of vertebrates and for elucidating the genetic basis of the phenotypic diversity of ∼25 species of Takifugu that evolved within the last 5 My.
Keywords: pufferfish, genetic map, genome evolution, recombination, rearrangement, conserved synteny
Introduction
In 1993, Brenner et al. (1993) showed that the genome of the pufferfish Takifugu rubripes (fugu) is only one-eighth the size of the human genome, yet it contains a gene repertoire similar to that in the human genome and proposed it as a model vertebrate genome for discovering genes and gene regulatory elements in the human genome. The 400-Mb fugu genome was sequenced to ∼6× depth purely by the whole-genome shotgun strategy without the aid of any physical or genetic map, yielding an assembly comprising 12,381 scaffolds longer than 2 kb and covering 332 Mb of the genome (Aparicio et al. 2002). Although fugu was initially not intended to be a genetic model, a genetic map with 200 microsatellite markers that anchored 10% of the assembly to the 22 fugu chromosomes was generated (Kai et al. 2005). The current fugu assembly (FUGU version 4), which is based on 8.7× coverage sequences, spans 393 Mb and consists of 7,213 scaffolds including 511 scaffolds that represent 83% of the assembly. Over the years, fugu genome has served as a valuable reference genome not only for discovering genes and gene regulatory elements in the human genome (Aparicio et al. 2002; Woolfe et al. 2005; Pennacchio et al. 2006) but also for gaining novel insights into the organization and evolution of vertebrate genomes (e.g., Vandepoele et al. 2004; Yeo et al. 2004; Goode et al. 2005; Woolfe and Elgar 2007; Stephen et al. 2008). However, because of the granular nature of the genome assembly and the low resolution of the genetic map, the utilization of fugu genome has been limited for global comparisons that address questions related to chromosome architecture and genome evolution.
With about 27,000 living species, teleost fishes represent nearly 50% of extant vertebrates (Nelson 2006). Teleost fishes are also the most divergent and successful group of vertebrates. A whole-genome duplication that occurred at the base of the teleost lineage has been proposed to be responsible for the rapid speciation and diversity of teleost fishes (Hurley et al. 2005; Meyer and Van de Peer 2005; Volff 2005). Several teleost fishes such as zebrafish (Danio rerio), medaka (Oryzias latipes), and stickleback (Gasterosteus aculeatus) have proved to be valuable genetic models for gaining insights into the genetic basis of development and phenotypic diversity of vertebrates. In addition to fugu, genomes of four other teleosts have been sequenced. These include the green spotted pufferfish (Tetraodon nigroviridis), medaka, zebrafish, and stickleback. Fugu and Tetraodon belong to the same order, Tetraodontiformes. They shared a common ancestor ∼44 million years ago (Ma) (Benton and Donoghue 2007) and thus represent two very closely related lineages of fishes. The compact 340-Mb genome of Tetraodon was also sequenced using the whole-genome shotgun strategy, and 64% of the assembly was anchored to 21 Tetraodon chromosomes with the help of a bacterial artificial chromosome-based physical map and fluorescence in situ hybridization (FISH) (Jaillon et al. 2004). The pufferfishes, medaka, and stickleback are grouped under the superorder Acanthopterygii that includes ∼55% of living teleosts (Nelson 2006). The medaka shared a common ancestor with pufferfishes about 124 Ma (Benton and Donoghue 2007). Its genome was sequenced more recently and by utilizing a high-density genetic map, 90% of the medaka genome assembly has been mapped to the 24 chromosomes of medaka (Kasahara et al. 2007). The genome sequences of zebrafish and stickleback have been completed to draft levels and made available in the public domain. However, genome-wide comparative analyses of these genomes are yet to be published.
Comparisons of genomes at different phylogenetic distances help to infer ancient and recent rearrangement events in genome evolution and provide a more complete understanding of the mechanisms of genome evolution. Teleost fishes, which have experienced a “fish-specific” whole-genome duplication event before their radiation (Jaillon et al. 2004; Hurley et al. 2007) in addition to the two rounds of genome duplication at the base of vertebrates, are particularly attractive and useful for investigating vertebrate genome evolution. Previous studies have analyzed karyotype evolution of vertebrates by comparing genomes of Tetraodon and human (Jaillon et al. 2004) or genomes of medaka, zebrafish, Tetraodon, and human (Kasahara et al 2007; Nakatani et al. 2007). These studies have helped not only to infer interchromosomal rearrangements that occurred in teleosts after the fish-specific whole-genome duplication but also to reconstruct karyotypes of the ancestral teleost and the ancestral bony vertebrate. However, the extent of intrachromosomal rearrangements in teleost fishes following the fish-specific genome duplication has not been well characterized. For example, although Kasahara et al. (2007) predicted occurrences of intrachromosomal rearrangements between medaka and Tetraodon genomes, the extent and the frequency of intrachromosomal rearrangements were not assessed. A detailed analysis of intrachromosomal rearrangement rates among fugu, Tetraodon, zebrafish, and mammals was made by Sémon and Wolfe (2007a), but due to the fragmented nature of fugu assembly, a realistic estimate of the loss of gene collinearity could not be obtained. Furthermore, although genome assemblies of fugu and Tetraodon have provided a unique opportunity to investigate recent chromosomal rearrangements in two closely related species of teleosts, such genome-wide comparative studies have been hindered by the lack of a chromosome-level assembly of the fugu genome.
Besides assisting in the investigation of genome evolution, genome map is a powerful tool to study the genetic basis of phenotypic evolution when combined with forward genetics or population genetics approaches (Streelman et al. 2007; Oleksyk et al. 2010). Pufferfishes belonging to the genus Takifugu are mainly marine fishes with a limited distribution in the seas of East Asia. Interestingly, similar to the cichlids of East African lakes, Takifugu species have undergone explosive speciation in the last 2–5 My (Yamanoue et al. 2009), resulting in about 25 species that exhibit an impressive diversity in morphology, life history, physiology, and behavior (Uno 1955; Ogawa 1991; Kato et al. 2005). Because of the recent divergence of Takifugu species, interspecies crosses produced by artificial and natural fertilization are viable (Fujita 1967; Masuda et al. 1991; Kikuchi et al. 2007). Thus, Takifugu species are an attractive model system for the evolutionary studies of speciation and diversity in marine environment. A comprehensive genome map of a Takifugu species would greatly facilitate these types of evolutionary studies.
In this study, we have generated a comprehensive genetic map of fugu based on 1,220 microsatellite markers and integrated it with the current genome assembly to extend the contiguity of the assembly to the scale of chromosomes. In the integrated genome map, 72% of the genome has been ordered and oriented on the 22 fugu chromosomes while an additional 10% sequence has been anchored on the chromosomes. We have compared the consolidated fugu genome map with the chromosomes of Tetraodon to investigate the extent to which synteny and gene order have been rearranged because the two species diverged from their common ancestor. We have also compared the fugu chromosomes with those in medaka. Comparison of genomic structures among these teleost fishes shows an extensive conservation of synteny and gene order. Comparison of chromosomal rearrangement rates between these teleost fishes and mammals revealed a distinct pattern of inter- and intrachromosomal rearrangement rate between these two groups of vertebrates. The comprehensive genetic map and the extended genome assembly of fugu are useful resources for investigating comparative genomics of vertebrates and for the genetic studies of speciation and phenotypic evolution of the genus Takifugu.
Materials and Methods
Mapping Population
We used three genotyping panels. The main panel consisted of 62 individuals from a full-sib family of fugu. The other two panels consisted of 190 and 314 full-sib individuals, respectively, and were used only for analyzing genome regions with low recombination frequency. This project was conducted in accordance with the Regulation for Animal Experiments of the University of Tokyo. An ethics statement is not required for this project.
Genotyping and Linkage Analysis
Primer design, genotyping, and linkage analysis were performed as previously described with slight modifications (Lander et al. 1987; Kai et al. 2005). Of the 516 scaffolds in the fugu assembly v4 that are longer than 100 kb, we designed primers for at least two microsatellite loci for 513 scaffolds. We were not able to find more than one locus for the remaining three scaffolds. We then designed primers for at least one locus on each of the 147 scaffolds that are between 50 and 100 kb. To label the polymerase chain reaction (PCR) amplicon of the marker loci, we added an additional M13 sequence (5'-CACGACGTTGTAAAACGAC-3') to the 5' end of forward primer (Schuelke 2000). Polymorphism was analyzed by using the 4300 DNA Analysis System (LI-COR) or ABI3730xl DNA Analyzer (Applied Biosystems). The sequences of the primers (1,262 pairs) are shown in supplementary table S1, Supplementary Material online, and on our Web site at http://www.se.a.u-tokyo.ac.jp/Fugu-Map/map.html.
Comparison of Gene Maps of Fugu and Other Fishes
To identify orthologs between fugu and Tetraodon, and fugu and medaka, the whole catalog of predicted proteins from these species (Ensembl release 48) were compared using Ensembl MartView. The one-to-one matches were considered as orthologs. Because the whole-genome sequence of zebrafish has not yet been published, we used a data set of unambiguously mapped genes reported by Woods et al. (2005). To obtain orthologs between fugu and zebrafish, we compared the fugu–Tetraodon data set with that of zebrafish–Tetraodon and integrated the two data sets. Details of data sets from these analyses are shown in supplementary table S2, Supplementary Material online.
Reconstruction of Ancestral Karyotypes
To reconstruct the ancestral karyotype of pufferfishes, we used a data set of triplet orthologs of fugu, Tetraodon, and medaka (supplementary table S3, Supplementary Material online). The ancestral chromosomes were reconstructed by applying the two of three rule (Nakatani et al. 2007). This approach is summarized as follows. First, we grouped orthologs that retain syntenic relationships in fugu, Tetraodon, and medaka into one conserved linkage block (CL block of fugu–Tetraodon–medaka). We tentatively treated a singleton in each two-way comparison as one CL block. If the singleton is not syntenic to any other CL blocks in any two-way comparisons, we presumed that the ortholog independently experienced interchromosomal rearrangement in the respective lineage. In this case, we were not able to deduce its ancestral state and, thus, excluded it from the data set. Second, if the two CL blocks retain a syntenic relationship in at least two of the three genomes, we inferred that the relationship was conserved on a chromosome in the last common ancestor of fugu and Tetraodon. Third, if the two CL blocks are not syntenic in at least two of the three species, these blocks were considered located on different chromosome in the pufferfish ancestor. We also reconstructed the ancestral karyotype of the last common ancestor of pufferfishes and medaka by a four-way analysis using the genomes of fugu, Tetraodon, medaka, and zebrafish. Because a relatively small number of zebrafish genes (∼3,500) is currently available for genome-wide comparative studies of chromosome architecture (Woods et al. 2005), the number of orthologs used in the four-way analysis was limited. Details of CL blocks are shown in supplementary table S3, Supplementary Material online.
Comparison of Gene Order Between Species
To examine the conservation of gene order between fugu and Tetraodon, and fugu and medaka, we obtained data sets of orthologs with putative transcriptional start position by using Ensembl MartView (Ensembl release 50, supplementary table S4, Supplementary Material online). We categorized genes that have not been mapped on chromosomes in any of the species into unmapped genes (Un) and excluded them from the data set because these genes disrupt the conservation of gene order irrespective of chromosomal rearrangements. For the same reason, we excluded genes that show one-to-many relationships between species. We also excluded gene pairs that were likely to be assigned as orthologs due to reciprocal gene loss after the fish-specific genome duplication (Sémon and Wolfe 2007b). We identified such genes as follows. Duplicated genes that arose from the whole-genome duplication at the base of the teleost lineage have been extensively analyzed in Tetraodon and medaka (Jaillon et al. 2004; Kasahara et al. 2007). By referring to their results, we first identified orthologous chromosomes of fugu based on the distribution of fugu genes orthologous to Tetraodon or medaka genes. The Oxford grid indicated that a vast majority of orthologous genes were located on orthologous chromosomes between two species. However, a few genes from a chromosome in one species were found to be located on the paralog of its orthologous chromosome in the other species. This pattern suggests reciprocal loss of duplicated genes in the two species. We then searched for traces of genome duplication in the genome sequence containing these genes (supplementary fig. S1, Supplementary Material online). We manually examined existence of paralogous genes for ten consecutive coding loci on both sides of these genes in each species. If paralogous genes were found between these regions and the region on the corresponding paralogous chromosomes, we assumed that these genomic regions were duplicated during the fish-specific genome duplication, and, therefore, the initial orthology assignment of the gene was missed due to the reciprocal gene loss. We then plotted these data sets on the Oxford grid including positional information of the genes to identify the number and orientation of conserved segments. A conserved segment is defined as a set of orthologs that are consecutive in fugu and Tetraodon. In the conserved segments, the relative position of the orthologs are the same in the two species. To define the orientation of the conserved segments, the order of at least four consecutive orthologs are used. By using the same method, we obtained data sets of orthologs among fugu, Tetraodon, medaka, human, mouse, and opossum and determined their positions in the genome and used these data for comparison between these teleosts and mammals (Ensembl release 50, supplementary table S5, Supplementary Material online).
GRIMM is a program for analyzing gene order rearrangements in pairs of genomes (Tesler 2002; http://grimm.ucsd.edu/GRIMM/). We estimated the minimum possible number of inversions between fugu and Tetraodon, and fugu and medaka using GRIMM. We used the settings “a conserved segment” and its orientation instead of “a gene” and its orientation. The gene order is considered conserved if the orientation of conserved segments is the same in two species.
Proximity Conservation
Proximity of two genes is a good measure of conservation of synteny. We therefore used the disruption of proximity between two genes as an approximation of rearrangement rate (McLysaght et al. 2000; Sémon and Wolfe 2007a). We measured the disruption of proximity between 2 consecutive genes in our data set of 3,639 common orthologs of six genomes (supplementary table S5, Supplementary Material online). We calculated the proportion of pairs of genes that are neighboring at a species (start point) and that are still neighboring at another species (end point). If the genes are neighboring in the start-point species and are located on different chromosomes in the end-point species, we defined this case as a proximity loss caused by interchromosomal rearrangement (PL-inter). If neighboring genes in a species (start-point) are located on the same chromosome but are separated by other genes in the end-point species, we defined this as a proximity loss caused by intrachromosomal rearrangement (PL-intra).
Fluorescence In Situ Hybridization
A centromeric sequence of fugu was cloned in pCR4-TOPO vector (Invitrogen). By sequencing this clone, we obtained repeat sequences containing the following 118-mer: ACGAGAAAACGTCAAAAACGTCATAATGTGAGCGCAGCATGAGTTTTCAGGTGATCATGTTGAATTTACCTCTGTTTTGAGAAACTTGTATATCCTGACCAAAAGTGATGGTTTCCCC. Telomeric repeats (TTAGGG)n were amplified with PCR using (TTAGGG)5 and (TAACCC)5 primers and were cloned in pCR4-TOPO vector. Chromosome preparation was obtained from peripheral blood leucocytes (Fujiwara et al. 2001). FISH was performed as described previously (Fujiwara et al. 2007).
Results
A Comprehensive Genetic Map of Fugu
We designed 1,508 pairs of primers for microsatellite loci on 848 scaffolds (641 of them are >50 kb) in the fugu genome assembly version 4. Among them 1,021 markers were informative for segregation analysis in the first mapping populations, whereas 692 markers were heterozygous in both parents. The remaining markers were informative for recombination in only one of the parents. To construct genetic maps, we combined the segregation data obtained by assaying the new 1,021 markers on a genotyping panel consisting of the 62 full-sib progeny together with the data of 212 markers that were mapped previously (Kai et al. 2005).
The male map consisted of 22 linkage groups with 1,057 microsatellite markers (fig. 1 and table 1, supplementary fig. S2 and Supplementary Data, Supplementary Data, Supplementary Material online). The total length of the linkage groups is 1,202.8 cM, and the average distance between two markers is 1.1 cM. The sizes of individual linkage groups range from 40.4 to 99.7 cM (mean 54.7 cM). The number of markers per linkage group varied from 30 to 72, with an average of 48 markers per linkage group. The female map included 1,000 markers in 22 linkage groups. This map spans 2,189.8 cM, and the average spacing between two markers is 2.2 cM. The sizes of the female linkage groups range from 66.8 to 179.9 cM (mean 99.5 cM). The number of markers per linkage group varied from 31 to 74, with an average of 45 markers per group. By using markers that are heterozygous in both parents, we identified homologous pairs of linkage groups of male and female parents and arranged these maps into 22 linkage groups consisting of 1,220 markers. Among the informative markers used in this analysis, 99% showed detectable linkage to at least one other marker.
FIG. 1.—
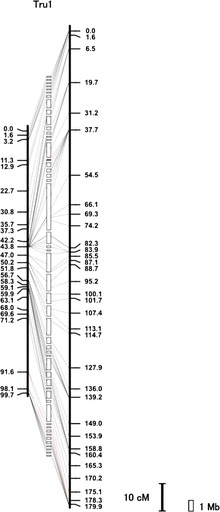
Fugu chromosome 1. Vertical black bars represent the male (left) or female (right) genetic map. Distances in centimorgans (cM) are indicated below (Kosambi mapping function). White boxes sandwiched between the male and female maps represent scaffolds. Scaffolds containing centromeric repeat sequences are labeled in red (see supplementary fig. S2 and Supplementary Data, Supplementary Material online). Transverse lines link the location of each marker on the genetic maps with its corresponding anchored scaffolds. Red transverse lines indicate disagreement between the position of marker on the genetic map and that of physical map. Such differences could be due to a misassembly in the reference sequence or an actual polymorphism between the mapping population and the sequenced individual. Gap between scaffolds is arbitrary because the actual distance between scaffolds is unknown. Scale bars represent 10 cM and 1 Mb. Details of all chromosomes and anchored scaffolds are shown in supplementary figure S2 and Supplementary Data, Supplementary Material online.
Table 1.
Number of Markers, Genetic Length and Scaffold Size for Each Chromosome
| Chromosome | Total no. of Markersa | Male Mapb |
Female Mapb |
Anchored Scaffold size (bp) |
|||
| Number of markers | Length (cM) | Number of Markers | Length (cM) | Before Merging of Scaffolds | After Merging of Scaffolds | ||
| 1 | 87 | 72 | 99.7 | 74 | 179.9 | 26,330,658 | 26,302,275 |
| 2 | 54 | 46 | 53.2 | 46 | 97.7 | 14,211,633 | 14,135,489 |
| 3 | 50 | 42 | 61.9 | 41 | 98.7 | 16,031,146 | 16,026,996 |
| 4 | 58 | 49 | 42.0 | 47 | 98.1 | 15,549,612 | 15,557,878 |
| 5 | 56 | 46 | 48.7 | 48 | 92.3 | 13,175,788 | 13,170,292 |
| 6 | 47 | 40 | 57.6 | 42 | 79.4 | 11,780,457 | 11,739,006 |
| 7 | 61 | 58 | 56.7 | 54 | 103.1 | 16,283,200 | 16,234,404 |
| 8 | 59 | 47 | 63.0 | 47 | 135.0 | 18,618,810 | 18,618,810 |
| 9 | 44 | 41 | 51.9 | 38 | 96.2 | 14,960,318 | 14,914,903 |
| 10 | 68 | 58 | 40.4 | 55 | 86.6 | 12,054,619 | 12,022,846 |
| 11 | 72 | 64 | 53.5 | 43 | 75.0 | 15,376,318 | 15,376,318 |
| 12 | 44 | 38 | 54.9 | 38 | 76.3 | 12,589,505 | 12,473,556 |
| 13 | 52 | 45 | 43.8 | 42 | 120.1 | 19,305,636 | 19,506,067 |
| 14 | 56 | 51 | 48.5 | 45 | 99.0 | 15,247,820 | 15,288,442 |
| 15 | 54 | 40 | 46.1 | 48 | 97.8 | 14,088,904 | 15,159,000 |
| 16 | 49 | 45 | 48.5 | 36 | 66.8 | 12,457,908 | 12,333,995 |
| 17 | 56 | 50 | 60.6 | 49 | 86.3 | 15,096,502 | 15,096,502 |
| 18 | 35 | 30 | 65.9 | 31 | 76.1 | 10,003,158 | 9,935,622 |
| 19 | 66 | 58 | 53.7 | 49 | 116.6 | 16,511,194 | 16,468,050 |
| 20 | 47 | 41 | 56.6 | 40 | 95.9 | 15,759,749 | 15,759,749 |
| 21 | 39 | 34 | 45.5 | 32 | 123.2 | 16,783,189 | 16,776,071 |
| 22 | 66 | 62 | 50.1 | 55 | 89.7 | 14,843,466 | 14,818,145 |
| Total | 1,220 | 1,057 | 1,202.8 | 1,000 | 2,189.8 | 337,059,590 | 337,714,416 |
The number of markers not involve additional markers that were used only for 190 or 314 full-sib progeny panel.
Details of scaffold information are shown in supplementary table S1, Supplementary Material online.
Integration of Genetic and Sequence Maps
The markers developed to specific regions of the scaffolds allowed us to integrate the genetic and sequence maps into a consolidated genome map. The 1,220 loci on the genetic map were useful for anchoring 749 scaffolds. We ordered these scaffolds to be consistent with the order of markers determined by the genetic map. This allowed us to place scaffolds that cumulatively represent 86% (337.1 Mb) of the sequenced genome onto the linkage groups. Among them, 195 scaffolds covering 224.9 Mb were oriented by assigning multiple genetically separated markers located on each scaffold. However, markers located in regions with low recombination frequency remained unresolved because of the limited number of siblings in the genotyping panel. To obtain a higher resolution map, we made new genotyping panels consisting of 190 and 314 siblings and analyzed 330 loci from each of the panels. This analysis revealed the orientation of another 74 scaffolds covering 56.5 Mb. Additionally, we were able to merge 749 scaffolds anchored to the genetic map with another 697 scaffolds by manual alignment of scaffold ends or by filling gaps between scaffolds using PCR (supplementary table S1, Supplementary Material online). In the final genome map, 278 superscaffolds are ordered and oriented on 22 chromosomes, and the total length of these scaffolds represents 72% (281.6 Mb) of the sequenced genome. An additional 237 scaffolds covering 10% of the genome were assigned to chromosomes (their orientation is not known). In addition, 182 scaffolds covering 4% of genome were anchored to the chromosomes, but their orientation and relative order within the anchor point could not be resolved (supplementary figs S2, Supplementary Data and Supplementary Data, Supplementary Material online). Thus, a total of 86% of the assembly was assigned to linkage groups.
Recombination Rate
With the integrated genome map, we examined the relationship between genetic distance and physical distance in the fugu genome. Given the fugu genome size of 392 Mb and male genetic map length of 1,202.8 cM, we calculated the average genetic distance per Mb of Takifugu genome to be 3.1 cM. In the female map, the distance is 5.6 cM/Mb. Comparison of recombination rates among 13 chordates characterized to date (fugu, stickleback, medaka, zebrafish, horse, dog, mouse, macaque, human, opossum, chicken, zebra finch, and Ciona savignyi) revealed that the rate of recombination in fugu is the highest in the group (fig. 2 and supplementary table S7, Supplementary Material online). Even the male-specific recombination rate in fugu is higher than the recombination rates in other groups (supplementary fig. S4, Supplementary Material online).
FIG. 2.—
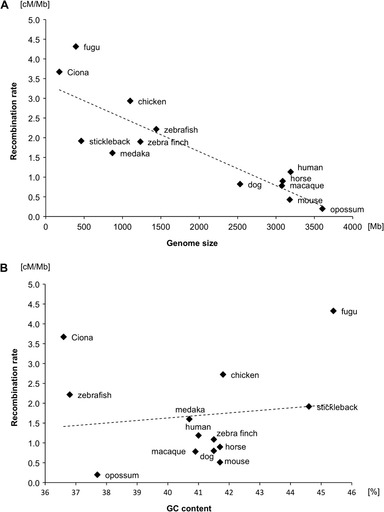
Scatter plots of genome sizes and GC contents versus recombination rates of chordates. (A) Genome sizes versus recombination rates. The golden path length for each species in Ensembl was regarded as their genome size (http://www.fugu-sg.org/ and http://www.ensembl.org/). (B) GC contents versus recombination rates. Details of genome sizes, genetic map sizes, and GC contents are listed in supplementary table S7, Supplementary Material online. The correlation between genome size and recombination rate was tested using Pearson’s product moment correlation coefficient as implemented in the “cor.test” function in R (http://www.r-project.org/).
On the integrated genome map, the recombination rate varied considerably between sexes and across the chromosomes (fig. 3 and supplementary fig. S5, Supplementary Material online). On the male map, recombination rates are elevated toward one or both ends of chromosomes while they are remarkably lower in the center of chromosomes. Indeed, no recombination event was observed over several megabases in the centers of most chromosomes of males during meiosis. In contrast, the recombination rates are more uniform on the female map.
FIG. 3.—
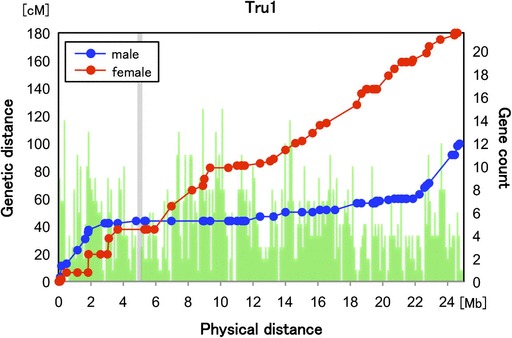
Genetic distance and physical distance in chromosome 1 for fugu. The positions in cM for female (red) and male (blue) are plotted against the physical position on Tru1. The number of predicted genes within bins of 10 kb is shown as green bars. A shadow box indicates the centromeric region where centromeric repeats were mapped (supplementary table S11, Supplementary Material online).
Conservation of Synteny among Fugu, Tetraodon, and Medaka
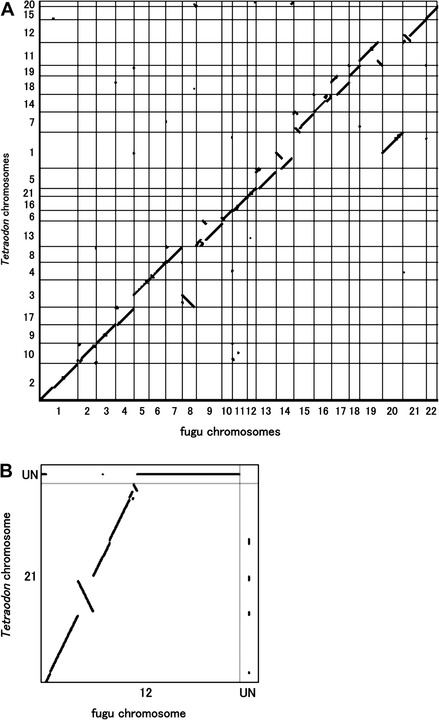
The construction of the integrated map of fugu made it possible to compare conservation of synteny (orthologous genes present on a single chromosome in two genomes irrespective of their order and orientation) between fugu and other teleosts. We first analyzed the extent of interchromosomal rearrangement events shaping the genomes of the two pufferfishes, fugu and Tetraodon. To compare the conservation of synteny between fugu and Tetraodon genomes, we first identified 10,482 pairs of orthologous genes that have been mapped on chromosomes in both species (supplementary table S2A, Supplementary Material online). These orthologs were arrayed according to fugu chromosomes (Tru) and Tetraodon chromosomes (Tni) in an Oxford grid (supplementary fig. S6A, Supplementary Material online). To create synteny maps of fugu and Tetraodon, we excluded 41 singletons from the set of orthologs (supplementary fig. S7A, Supplementary Data, Supplementary Material online). The maps contain 38 synteny blocks each composed of at least two genes (average 275; maximum 952) that have orthologs on the same chromosome in Tetraodon. The synteny blocks include >99% of the fugu–Tetraodon orthologs on the Oxford grid. The Oxford grid and the synteny maps suggest that 18 pairs of chromosomes in fugu and Tetraodon roughly exhibit one-to-one correspondence, with traces of translocation containing more than 10 orthologs in two Tetraodon chromosomes (Tni10 and Tni15). Furthermore, three of the chromosomes in Tetraodon (Tni1, Tni3, and Tni20) each share orthologs mainly with two fugu chromosomes, Tru14 and Tru20; Tru5 and Tru8; and Tru8 and Tru14; respectively. These chromosomes with one-to-two correspondence appear to have undergone fusion in Tetraodon or fission in fugu lineage after they diverged from their last common ancestor.
We next analyzed synteny conservation in fugu and medaka genomes by using 12,026 pairs of orthologous genes (supplementary table S2B, Supplementary Material online). The synteny maps of fugu and medaka contain 46 blocks that include 99% of fugu–medaka orthologs on the Oxford grid (supplementary fig. S7C and D, Supplementary Material online). The maximum and average number of genes per synteny block are 627 and 259, respectively. The Oxford grid and synteny maps indicate that 20 pairs of chromosomes in fugu and medaka exhibit one-to-one relationship, whereas two pairs of chromosomes show one-to-two correspondence (fugu to medaka) (supplementary fig. S6B, Supplementary Material online). Tru1 and Tru8 share orthologs mainly with two medaka chromosomes each, Ola19 and Ola21 and Ola2 and Ola18; respectively. Note that we identified more orthologs between fugu and medaka than between fugu and Tetraodon even though fugu is more closely related to Tetraodon. This is because we chose only genes that are mapped to chromosomes, and a higher proportion of medaka assembly (90%) and genes have been mapped to chromosomes compared with Tetraodon assembly (64%) and genes. We found more chromosome pairs with one-to-one relationship between fugu and medaka (20 pairs) than between fugu and Tetraodon (18 pairs). This indicates that additional interchromosomal rearrangement events took place in the Tetraodon lineage after it diverged from fugu. Overall, these analyses reveal an extremely conserved aspect of genomes among fugu, Tetraodon, and medaka that are grouped under the superorder Acanthopterygii, with only a few interchromosomal rearrangements having occurred after the divergence of the common ancestors of medaka and pufferfishes.
Reconstruction of Pufferfishes and Medaka Ancestral Karyotype
To infer the history of the interchromosomal rearrangements in the three teleost fish lineages, we reconstructed the karyotype of the common ancestors of fugu–Tetraodon and fugu–medaka. We first identified 758 quadruplet orthologs of fugu–Tetraodon–medaka–zebrafish (supplementary table S3A, Supplementary Material online). We then obtained 33 CL blocks of fugu–Tetraodon–medaka using these orthologs and reconstructed the karyotype of the ancestor of two pufferfishes (FT ancestor) by applying a two-of-three rule (see details in Methods). By using the same strategy, the ancestral karyotype of pufferfishes–medaka (FTM ancestor) was inferred with 168 CL blocks of FT ancestor–medaka–zebrafish. These analyses suggested that the FTM ancestor contained 23 chromosomes (denoted from A–X; fig. 4). Although the ancestral karyotype has been remarkably conserved in medaka, the common ancestor of pufferfishes experienced one fusion and one translocation. We deduced that Tru1 underwent the fusion event before the divergence of the two pufferfishes because CL blocks derived from AncA and AncB are syntenic on Tru1 and Tni2, but these CL blocks were mapped onto different chromosomes in both medaka and zebrafish genomes. To analyze the rearrangement events shaping the genomes of two pufferfishes on a finer scale, we used a data set containing 7,755 triplet orthologs of fugu–Tetraodon–medaka (supplementary table S3B, Supplementary Material online). This analysis revealed that, although fugu lineage has undergone only one fusion following the split between the fugu and Tetraodon lineages, Tetraodon lineage has experienced two fusions and three translocations (fig. 4).
FIG. 4.—
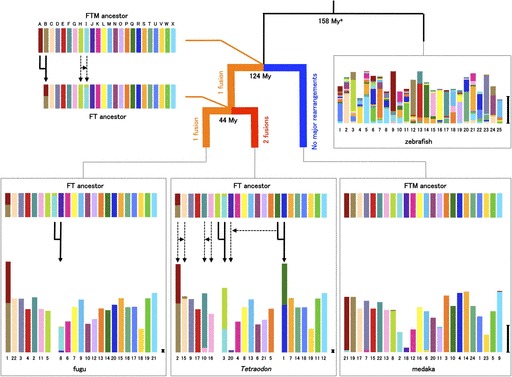
Reconstruction of the ancestral karyotypes of fugu–Tetraodon and pufferfishes–medaka. The proto-chromosomes of the pufferfishes–medaka (FTM ancestor) are labeled from A to X. Genome segments in each species are color coded according to the chromosome of the FTM ancestor. The length of chromosomes of extant species indicates the number of orthologs. Scale bar represents 20 orthologs. Gene order within chromosomes of each species has been reallocated to highlight orthologous relationships with gene on the FTM ancestral chromosomes. Major chromosomal fusions are indicated as solid arrows. Major translocations of the genome segments containing at least four orthologs are displayed as dotted arrows. FT ancestor means the common ancestor of fugu and Tetraodon. Details of orthologs are shown in supplementary table S3, Supplementary Material onine. aData of divergence times in phylogram are from Benton and Donoghue (2007).
In contrast to invertebrates that typically contain a single Hox gene cluster, vertebrates contain multiple Hox gene clusters that are usually located on different chromosomes. However, our previous study showed that in fugu HoxBb and HoxDa clusters are genetically linked on Tru1 (Kai et al. 2005). Our reconstruction of the ancestral karyotype explicitly indicates that the fusion of ancestral chromosomes AncA and AncB that occurred in the FT ancestor after it diverged from the medaka lineage brought the two Hox clusters onto the same chromosome in fugu and Tetraodon.
Reciprocal Loss of Duplicated Genes in Fugu and Tetraodon
Loss of reciprocal copies of duplicated genes following whole-genome duplication can act as a genetic barrier between populations, thereby driving them toward speciation (Lynch and Force 2000). Reciprocal copies of duplicated genes retained are generally misidentified as exact orthologs by the reciprocal best match approach. Because inclusion of such genes in the ortholog set results in an overestimation of chromosomal rearrangements when comparing gene order between two species (Sémon and Wolfe 2007a), we searched for such assignments in our data set of 9,660 fugu–Tetraodon orthologs that have positional information on the chromosomes (supplementary table S4A, Supplementary Material online). As seen in the synteny analysis, a vast majority of orthologs was located on their exact orthologous chromosomes (or chromosomal segments) between fugu and Tetraodon (supplementary fig. S6A, Supplementary Material online). However, for six orthologous pairs, the orthologous genes in one of the species were found to be located on their paralogous chromosomes. This pattern of distribution of orthologs on the Oxford grid can be either due to the actual translocation of genes on to the paralogous chromosome or the reciprocal loss of copies of duplicated genes in the two species. To resolve this, we examined the neighborhood of such genes to determine if they are flanked by paralogous set of genes (see Methods). This analysis suggested that at least three pairs of genes appeared to be incorrectly assigned as orthologs because of the reciprocal loss of duplicated genes in the two pufferfishes (supplementary fig. S1A, Supplementary Material online). Thus, these are clear instances of reciprocal loss of duplicated genes in the recent evolutionary history of pufferfishes. A whole-genome duplication is generally followed by a large scale loss of duplicate genes, and genes that are retained in duplicate over a long period are believed to be essential to the organism (Ohno 1970; Lynch and Conery 2000). The instances of recent loss of duplicate copies of genes in the pufferfish lineage indicate that genes can be retained in duplicate for hundreds of millions of years after the genome duplication and then independently lost in different lineages. The reciprocal pattern of loss of duplicate copies in the two pufferfishes raises the possibility that reciprocal loss might have played a role in the speciation of pufferfishes. During the course of this analysis, we found six pairs of genes assigned incorrectly as orthologs because of the potential reciprocal gene loss in the ortholog set of fugu and medaka (supplementary fig. S1B, Supplementary Material online). We excluded these pairs of genes from the analyses of gene order conservation described below.
Comparison of Gene Order Conservation among Fugu, Tetraodon, and Medaka
To gain insights into the extent of intrachromosomal rearrangements, we examined conservation of gene order among fugu, Tetraodon, and medaka. Figure 5 shows the distribution of orthologs on syntenic chromosome pairs between fugu and Tetraodon. The majority of orthologs are arranged along the main diagonals (fig. 5A), indicating that the gene order between the two pufferfishes has been highly conserved. However, some inversions were apparent as seen in the comparison between Tru12 and Tni21 (fig. 5B). The plots of other orthologous chromosome pairs are shown in supplementary figure S8, Supplementary Material online. To deduce the most parsimonious scenario of intrachromosomal rearrangements that can explain the current organization of chromosomes of the two pufferfishes, we first identified 147 conserved segments in which a set of two or more orthologs are consecutive in two pufferfishes (table 2). The number of conserved segments in each syntenic chromosome pair ranged from 3 (Tru3/Tni9 and Tru22/Tni15) to 13 (Tru7/Tni8). In the chromosomes that have experienced relatively complex interchromosomal rearrangements (Tru5, 8, 14, 20/Tni1, 3, 20), 26 conserved segments were detected. We then applied the GRIMM algorithm to the conserved segments and found 93 inversions between the chromosomes of the two pufferfishes. The number of inversions in each syntenic chromosome pair ranged from 1 (Tru3/Tni9 and Tru22/Tni15) to 8 (Tru7/Tni8). The maximum number of orthologs on the inverted blocks ranged from 2 (Tru22/Tni15) to 557 (Tru9/Tni13). For the chromosome groups that have experienced a more complex rearrangement (Tru5, 8, 14, 20/Tni1, 3, 20), 15 inversions can transform the gene order on the chromosomes of fugu to those of Tetraodon. The maximum number of orthologs on these inverted blocks is 375.
FIG. 5.—
Retention of synteny and gene order between fugu and Tetraodon chromosomes. The gene order of orthologs on fugu chromosomes and Tetraodon chromosomes are plotted. Orthologs with unknown gene order in the two species were excluded from the plot. (A) Genome-wide comparison of fugu with Tetraodon. The orthologs on all fugu chromosomes and all Tetraodon chromosomes are plotted. The greater length of the axis reflects the greater number of mapped genes. (B) Comparison of Tru12 with Tni21. The figures for other syntenic chromosome pairs are shown in supplementary figure S8, Supplementary Material online. Orthologs whose orders are not known in one of the two species are plotted in the row and column labeled as UN.
Table 2.
Number of Segments with Conserved Gene Order, Number of Inversions, Number of Genes on Inverted Blocks Between Fugu and Tetraodon
| Chromosome |
Number of Orthologs on Inverted Blocks |
|||||
| Fugu | Tetraodon | Number of Orthologs | Number of Segments with Conserved Gene Order | Number of Inversions | Maximum | Mean |
| 1 | 2 | 893 | 6 | 3 | 36 | 15 |
| 2 | 10 | 456 | 8 | 7 | 390 | 178 |
| 3 | 9 | 454 | 3 | 1 | 35 | 35 |
| 4 | 17 | 434 | 5 | 3 | 393 | 143 |
| 6 | 4 | 406 | 11 | 6 | 58 | 16 |
| 7 | 8 | 392 | 13 | 8 | 373 | 142 |
| 9 | 13 | 618 | 7 | 6 | 557 | 257 |
| 10 | 6 | 244 | 6 | 3 | 57 | 21 |
| 11 | 16 | 337 | 8 | 5 | 33 | 21 |
| 12 | 21 | 202 | 6 | 4 | 34 | 19 |
| 13 | 5 | 481 | 4 | 4 | 459 | 348 |
| 15 | 7 | 489 | 7 | 6 | 439 | 110 |
| 16 | 14 | 424 | 7 | 4 | 415 | 161 |
| 17 | 18 | 431 | 5 | 5 | 284 | 112 |
| 18 | 19 | 256 | 9 | 5 | 248 | 54 |
| 19 | 11 | 551 | 5 | 3 | 438 | 159 |
| 21 | 12 | 564 | 8 | 4 | 134 | 36 |
| 22 | 15 | 287 | 3 | 1 | 2 | 2 |
| 5, 8, 14, 20 | 1, 3, 20 | 1,632 | 26 | 15 | 375 | 52 |
By using the same method, we analyzed the conservation of gene order between fugu and medaka (supplementary fig. S9 and Supplementary Data, Supplementary Material online). We identified 656 conserved segments between chromosomes of these fishes using 10,755 orthologs (supplementary table S4B, Supplementary Material online). The GRIMM analysis detected 536 inversions between the chromosomes of fugu and medaka. The number of inversions in each orthologous chromosome ranged from 8 (Tru14/Ola10) to 39 (Tru12/Ola11 and Tru17/Ola1). The maximum number of genes on inverted blocks ranged from 83 (Tru5/Ola8) to 505 (Tru3/Ola7). In the chromosomes that have experienced fusion in the fugu lineage, (Tru1/Ola19, 21) and (Tru8/Ola2, 18), the numbers of inversions are 32 and 37, respectively. The maximum numbers of genes on the inverted blocks are 412 (Tru1/Ola19, 21) and 119 (Tru8/Ola2, 18), respectively.
The pattern of the size-dependant frequency of inverted blocks is similar between fugu and Tetraodon, and fugu and medaka (supplementary fig. S10, Supplementary Material online). Inversions have occurred more frequently in smaller blocks containing <10 orthologs as well as in larger blocks containing >100 orthologs in both fugu–Tetraodon and fugu–medaka lineages. However, the number of inversions is highly variable across the orthologous chromosomes of fugu and Tetraodon (CV = 42.1%) but nearly uniform across orthologous chromosomes of fugu and medaka (CV = 35.6%) (table 2 and supplementary table S8, Supplementary Material online). This observation suggests that the accumulation of inversions is still at an early stage in fugu and Tetraodon.
Comparison of Gene Order Conservation Between Teleosts and Mammals
To compare the conservation of gene order between teleosts and mammals, we analyzed the conservation of gene order in the three teleost fishes and compared them with that in human, mouse, and opossum. The divergence time of human–mouse (81 My) is nearly twice that of fugu–Tetraodon (44 My), whereas the divergence times of eutherian–opossum (132 My) and Tetraodontiformes–medaka (124 My) are comparable (Benton and Donoghue 2007).
Because the comparison of gene order between two sets of genomes is sensitive to the number and density of orthologs used for the analysis, we identified a set of 3,639 orthologs common to all the six genomes (supplementary table S5, Supplementary Material online). We first identified conserved segments in which a set of orthologs are consecutive in pairs of species and counted the number of orthologs on each segment. The analyses of the three teleost lineages showed that conserved segments are more stringently retained between fugu and Tetraodon than between fugu and medaka (fig. 6A). For example, the number of longer segments containing >80 orthologs in fugu–Tetraodon and fugu–medaka are 17 and 4, respectively, whereas the number of smaller segments containing <40 orthologs in fugu–Tetraodon and fugu–medaka are 88 and 325, respectively (supplementary table S9, Supplementary Material online). A similar trend was also seen in human–mouse and human–opossum comparisons. These results are in good agreement with the prediction that evolutionary distance is a major determinant for the gene order conservation. However, comparison of segments of conserved gene order between the three teleosts and the three mammals showed that teleost fishes contain more such segments than mammals. Although fugu and Tetraodon contain 17 fragments each with >80 orthologs, human and mouse contain only three such fragments (fig. 6A and supplementary table S9, Supplementary Material online). Even when the divergence times of fugu–Tetraodon and human–mouse are normalized, the pufferfishes contain more fragments (11 segments) than the two mammals. A similar trend was also observed between fugu–medaka (4 segments) and human–opossum (1 segment). These results suggest that the gene order is more highly conserved in teleosts than in mammals.
FIG. 6.—
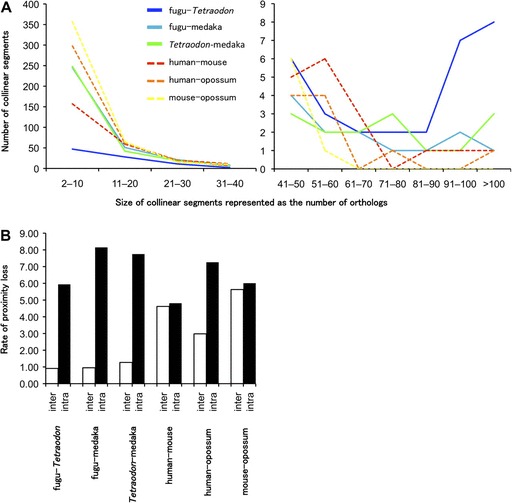
Retention of gene collinearity and loss of gene proximity in teleosts and mammals. (A) Number of collinear segments between the species pairs. Lines indicate the number of collinear segments observed in each segment size: solid blue lines represent fugu and Tetraodon; solid cyan line fugu and medaka; solid green line Tetraodon and medaka; dashed red line human and mouse; dashed orange line human and opossum; dashed yellow line mouse and opossum. (B) Rate of proximity loss between pairs of species after normalization with divergence times estimated by the fossil record. The rates of proximity loss caused by interchromosomal and intrachromosomal rearrangements are shown as white and black bars, respectively.
Conservation of Gene Proximity in Teleosts and Mammals
The higher level of gene order conservation in fugu, Tetraodon, and medaka compared with human, mouse, and opossum could be due to a lower degree of either inter- or intrachromosomal rearrangement rate or both. To evaluate the relative contributions of inter- and intrachromosomal rearrangements, we analyzed the loss of gene proximity caused by inter- and intrachromosomal rearrangements. The disruption of gene order results in the loss of proximity between pairs of genes, and therefore loss of gene proximity can be used as an approximation of the rate of chromosomal rearrangements (McLysaght et al. 2000; Sémon and Wolfe 2007a). We first measured the conservation of gene proximity in the three fish and three mammalian lineages using the 3,639 common orthologs of the six genomes. We then calibrated these measures with the divergence times of species estimated by the fossil record.
For example, when the data set of 3,617 pairs of proximate genes in fugu was considered as a start-point, the 3,511 pairs of their orthologs remained proximate in Tetraodon (end-point) (table 3, supplementary table S10A, Supplementary Material online). Therefore, the ratios of proximity conservation (PC ratio) and proximity loss (PL-total ratio) are 0.971 and 0.029, respectively. We then divided the PL-total ratio into two categories: PL-interchromosomal ratio (0.003) and PL-intrachromosomal ratio (0.026). After normalization with the divergence times, the estimated rates of PL-total, PL-inter and PL-intra between fugu and Tetraodon genomes were 6.66, 0.69, and 5.97, respectively. The measures were slightly different when the Tetraodon data set was considered as a start-point (table 3, supplementary table S10B, Supplementary Material online). This difference could be explained by the different numbers of chromosomes in fugu (n = 22) and Tetraodon (n = 21) (Sémon and Wolfe 2007a) (see details in supplementary table S10, Supplementary Material online). Note that the rearrangements that occurred between two neighboring genes are not counted.
Table 3.
Rearrangement Ratio and Rate Between Pairs of Species
| Start Point | Fugu | Tetraodon | Fugu | Medaka | Tetraodon | Medaka | Average of Teleosts | Human | Mouse | Human | Opossum | Mouse | Opossum | Average of Mammals |
| End Point | Tetraodon | Fugu | Medaka | Fugu | Medaka | Tetraodon | Mouse | Human | Opossum | Human | Opossum | Mouse | ||
| Number of proximate gene pairs in start point | 3,617 | 3,618 | 3,617 | 3,615 | 3,618 | 3,615 | N/A | 3,616 | 3,619 | 3,616 | 3,630 | 3,619 | 3,630 | N/A |
| Number of approximate gene pairs in end point | 3,511 | 3,508 | 3,209 | 3,207 | 3,205 | 3,219 | N/A | 3,337 | 3,345 | 3,140 | 3,127 | 3,079 | 3,057 | N/A |
| PC ratioa | 0.971 | 0.970 | 0.887 | 0.887 | 0.886 | 0.890 | 0.915 | 0.923 | 0.924 | 0.868 | 0.861 | 0.851 | 0.842 | 0.878 |
| PL-total ratiob | 0.029 | 0.030 | 0.113 | 0.113 | 0.114 | 0.110 | 0.085 | 0.077 | 0.076 | 0.132 | 0.139 | 0.149 | 0.158 | 0.122 |
| PL-inter ratioc | 0.003 | 0.005 | 0.012 | 0.011 | 0.018 | 0.014 | 0.011 | 0.040 | 0.035 | 0.027 | 0.052 | 0.050 | 0.099 | 0.051 |
| PL-intra ratiod | 0.026 | 0.026 | 0.100 | 0.102 | 0.096 | 0.096 | 0.074 | 0.037 | 0.041 | 0.105 | 0.087 | 0.099 | 0.059 | 0.071 |
| Divergence time by fossil record (My)e | 44 | 44 | 124 | 124 | 124 | 124 | N/A | 81 | 81 | 132 | 132 | 132 | 132 | N/A |
| PL-total ratef | 6.66 | 6.91 | 9.10 | 9.10 | 9.21 | 8.83 | 8.30 | 9.53 | 9.35 | 9.97 | 10.50 | 11.30 | 11.96 | 10.44 |
| PL-inter rateg | 0.69 | 1.13 | 1.00 | 0.89 | 1.45 | 1.09 | 1.04 | 4.98 | 4.26 | 2.01 | 3.94 | 3.79 | 7.47 | 4.41 |
| PL-intra rateh | 5.97 | 5.90 | 8.09 | 8.21 | 7.76 | 7.74 | 7.28 | 4.54 | 5.08 | 7.96 | 6.55 | 7.52 | 4.49 | 6.02 |
Ratio of conserved proximity. This is the ratio E/S, where S is the number of pairs in start point, and E is the number of pairs in end point.
Ratio of proximity loss is the ratio (S − E)/S.
This is the ratio PL-inter/S, where PL-inter is the number of proximity loss caused by interchromosomal rearrangements.
This is the ratio PL-intra/S, where PL-intra is the number of proximity loss caused by intrachromosomal rearrangements.
Estimates of divergence time of teleosts and mammalians based on fossil records were described by Benton and Donoghue (2007).
PL-total ratio/My/10−4.
PL-inter ratio/My/10−4.
PL-intra ratio/My/10−4.
The results of proximity analysis showed that the intrachromosomal rearrangement rates are comparable between the three teleost fishes (5.90–8.21, mean 7.28) and the three mammalian (4.49–7.96, mean 6.02) lineages. However, the interchromosomal rearrangement rates in the three fish lineages (0.69–1.45, mean 1.04) are considerably lower than those in the three mammals (2.01–7.47, mean 4.41) (fig. 6B and table 3; supplementary fig. S11, Supplementary Material online). Thus, we conclude that the three fish lineages have experienced a lower rate of interchromosomal rearrangements compared with the three mammalian lineages and that the lower level of gene order conservation in mammals is mainly due to a higher rate of interchromosomal rearrangements compared with the three teleosts.
Discussion
A Comprehensive Genetic Map of Fugu and Its Integration with the Genome Assembly
The genetic map of fugu has been improved considerably in the present study. Although the previous genetic map contained 200 markers (Kai et al. 2005), the present map contains 1,220 microsatellite markers. In addition, 99% of polymorphic markers used in this study show detectable linkage to at least one other marker, indicating the genome coverage is nearly complete. By using markers targeting-specific scaffolds, 86% of the assembled genome could be mapped to 22 fugu chromosomes, with much of it (72%) oriented. This consolidated assembly is made available in the public domain at http://www.fugu-sg.org/. In the current Tetraodon and medaka genome assemblies, 64% and 90% of the sequences have been anchored to the chromosomes, respectively. Thus, the extended assembly of fugu is comparable with the assemblies of Tetraodon and medaka. Together with the comprehensive genetic map, the present fugu genome assembly is a much more attractive resource than the previous draft genome sequence for genome-wide comparisons and for identifying genetic loci associated with various traits of pufferfishes.
Rate of Recombination
The recombination rate per Mb in fugu is the highest among vertebrates reported so far (see fig. 2 and supplementary table S7, Supplementary Material online). The exceedingly high recombination rate of fugu may be due to the small size of its genome compared with the genomes of other vertebrates. In mammals and chicken, it is reported that the recombination rate tends to be higher on smaller chromosomes (Rodionov 1996; International Chicken Genome Sequencing Consortium 2004; Groenen et al. 2009). This has been explained by the requirement of at least one chiasmata per bivalent during meiosis (Rodionov 1996). Consistent with this observation, we found a strong correlation between recombination rate and genome size among 12 species of vertebrates (Pearson correlation, r = −0.823, P < 0.001) (fig. 2A). Studies in mammals, chicken, and insects have shown that recombination rates are strongly correlated with GC content (Myers et al. 2005; Beye et al. 2006; Shifman et al. 2006; Groenen et al. 2009). The high recombination rate in fugu could also be due to its GC-rich genome. In support of this hypothesis, the GC content of fugu (45%) is the highest among the chordates compared. However, the recombination rates in these chordates do not show a strict correlation with their GC contents (fig. 2B). Therefore, GC content may not be a major determinant of recombination rate in chordates.
The female genetic map of fugu has a longer genetic length than its male map. Such a difference between sexes, particularly in autosomes, is widespread in animals (Lenormand and Dutheil 2005). The evolutionary significance of this phenomenon remains the subject of much debate (Lenormand 2003). Although comparisons of sex-specific genetic maps have been reported for many vertebrates (Sakamoto et al. 2000; Singer et al. 2002), the relation between the sex-specific recombination rate and the physical location on chromosomes has been examined for only a few species (Kong et al. 2002). In human, the chromosomal regions of high and low recombination ratio for the two sexes tend to coincide, although there are some exceptional regions in which a peak of recombination for males corresponds to a valley for females and vice versa (Kong et al. 2002; Lercher and Hurst 2003). Notably, the extent of the strong suppression of recombination around centromeres is similar for both sexes in human. However, in fugu the male-specific recombination deserts span more than half the chromosome for a majority of chromosomes (fig. 3 and supplementary fig. S5, Supplementary Material online). Because severe recombination suppression has been found in the gene-poor centromeric and pericentromeric heterochromatin regions in several species (The Cold Spring Harbor Laboratory, Washington University Genome Sequencing Center, PE Biosystems Arabidopsis Sequencing Consortium 2007; Topp and Dawe 2006; Yu et al. 2009), we anticipated that this is also the case in fugu. To determine the location of centromeres on the fugu integrated map, we first identified one of the centromeric repeats of fugu (fig. 7) and performed linkage analysis of scaffolds containing this centromeric repeat. This analysis revealed the position of the repeats on 11 chromosomes in the genome map (supplementary fig. S2 and Supplementary Data, Supplementary Material online). All centromeric repeats mapped were located within the recombination desert on the male map, confirming possible roles of repetitive sequences in the suppression of recombination. However, the fugu male-specific suppression of recombination also extended to the region with normal gene density (fig. 3). Thus, the extent of severe suppression cannot be simply explained by the high density of noncoding sequences. The molecular mechanisms of the suppression remain to be elucidated.
FIG. 7.—
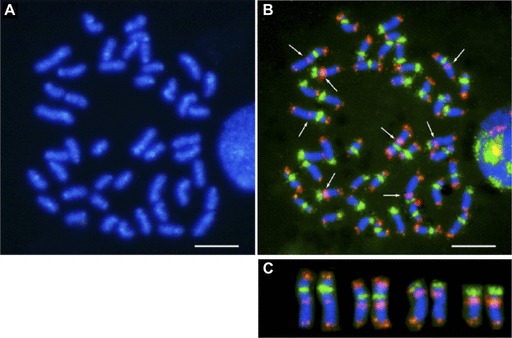
Fluorescence in situ hybridization of centromeric and telomeric repeats. (A) DAPI banding of metaphase chromosomes. Chromosome preparation was obtained from peripheral blood leucocytes of fugu. (B) Two-color FISH using the 118-mer centromeric and the telomeric (TTAGGG)n repeats probes. The centromeric and telomeric probes are labeled in green and red, respectively. Arrows indicate interstitial telomere-like sequence (ITS). (C) Confirmation of the ITS localization. These signals are shown on four chromosome pairs of fugu. Scale bar represents 5 μm.
Besides autosomes, the prominent recombination dimorphism often occurs on sex chromosomes because of their structural differences (Charlesworth et al. 2005). Previous studies have indicated that the fugu sex-determining region is located on Tru19 chromosome and transmitted to their offspring via a XX-XY system (Kikuchi et al. 2007). Based on the current integrated map of Tru19 (total length 16 Mb), the sex-determining gene is likely to reside in a region spanning ∼5 Mb, flanked by large autosome-like regions. The sex chromosome evolution is believed to involve suppression of recombination around the sex determining gene(s) in many species (but see Tanaka et al. 2007). However, the pattern of recombination dimorphism on the fugu sex chromosomes is indistinguishable from that of autosomes (fig. 3, supplementary fig. S5, Supplementary Material online). In addition, no Y chromosome-specific scaffold around the sex-determining region was found in this study. These data suggest that fugu has “young” sex chromosomes that are still in the early stage of differentiation. Further studies of such young sex chromosomes at the genomic sequence level should provide significant insights into our understanding of the evolution of sex chromosomes.
Evolution of Genome Architecture
The whole-genome sequences of teleosts that have experienced a fish-specific genome duplication event have uniquely contributed to our understanding of the evolution of genome architecture of vertebrates. By comparing Tetraodon genome with human genome, Jaillon et al. (2004) reconstructed the karyotype of the teleost ancestor as well as the bony vertebrate ancestor and deduced the major rearrangement events leading to the modern karyotype of Tetraodon. When medaka genome was subsequently completed, Kasahara et al. (2007) inferred the ancestral karyotype of teleosts by comparing genomes of medaka, zebrafish, Tetraodon, and human. One major disagreement between these studies is the origin of Tni6 and Tni21 chromosomes in Tetraodon. The former study inferred that these chromosomes were derived by a recent fission of an ancestral chromosome, whereas the latter suggested that these chromosomes have preserved their ancestral genomic structures without undergoing major rearrangements because the fish-specific genome duplication. Our analysis does not support a recent fission event suggested by Jaillon et al. (2004) but instead supports the scenario proposed by Kasahara et al. (2007). These comparisons demonstrate that using multiple species from diverse phylogenetic taxa increases precision in reconstructing the evolutionary history of genomes.
Interchromosomal Rearrangements in Fugu and Tetraodon Lineages
The comparison of the extended assembly of fugu with the Tetraodon genome sequence provided an opportunity to investigate the recent chromosomal rearrangements in these two closely related species of teleosts at a high resolution. Using the large number of orthologs between the two species, we identified one major fusion in the fugu lineage and two fusions and three translocations in the Tetraodon lineage (fig. 4). Although previous studies have analyzed rearrangement events in the Tetraodon lineage (Jaillon et al. 2004), they were unable to detect two of the three translocations in the Tetraodon lineage identified in this study. These Tetraodon lineage–specific translocations involved fragments of genomic regions on Tni1 and Tni2 that were translocated to Tni20 and Tni15, respectively, accounting for ∼28% and ∼4% of genes on Tni20 and Tni15, respectively. Besides the inclusion of fugu, using a higher number of orthologs (anchor points) in our study might have helped in detecting these events. Although Jaillon et al. (2004) used ∼4,300 orthologs of Tetraodon and human, and Kasahara et al. (2007) used 5,918 orthologs of medaka, Tetraodon, and human, we compared a substantially larger number of orthologs (7,755) of fugu, Tetraodon, and medaka.
Our analysis of interchromosomal rearrangements in the fugu and Tetraodon lineages because they diverged from a common ancestor showed that fugu has experienced fewer interchromosomal rearrangements. The two pufferfishes share many biological traits and their genomes are highly similar, yet they exhibit considerable difference in their chromosomal rearrangements. One major difference between fugu and Tetraodon is their habitats. Fugu is a marine species distributed in a wide region in East Asia, whereas Tetraodon inhabits freshwater and brackish water bodies in South-east Asia (FishBase, http://www.fishbase.org/home.html). Because a marine environment provides a larger and more contiguous habitat than a freshwater environment, it is reasonable to assume that the effective population size of fugu is larger than that of Tetraodon. Indeed, DeWoody and Avise (2000) have shown that the effective population size of marine fishes is about ten times higher than that of freshwater fishes. The larger effective populations experience a higher efficacy of purifying selection (Ohta 2002), thereby eliminating most of the deleterious mutations. Because chromosomal rearrangements can produce aneuploid genotypes (Hillier et al. 2007; Hill et al. 2008), the larger effective population size of fugu might be a factor responsible for the fewer interchromosomal rearrangements in the fugu lineage.
Besides habitat, the two pufferfishes show considerable difference in their generation times. The generation time of fugu (2 years for males and 3 years for females) is much longer than that of Tetraodon (about 1 year). The generation-time effect hypothesis predicts a higher mutation rate in species with shorter generation time but this is controversial (Li et al. 1996; Kumar and Subramanian 2002). However, the hypothesis may hold true for mutations that accumulate during germ-line cell division because species with the shorter generation time undergo more germ-line cell divisions per unit time. Therefore, it is possible that the longer generation time of fugu might have also contributed to the containment of interchromosomal rearrangements in fugu.
Chromosomal Rearrangement Rates in Teleosts and Mammals
Our analyses of conservation of gene order and loss of gene-proximity in three teleost fishes (fugu, Tetraodon, and medaka) and three mammals (human, mouse, and opossum) indicated that although the intrachromosomal rearrangement rates affecting the order of protein-coding genes are almost similar in both groups, the interchromosomal rearrangement rates are lower in the three teleost lineages than in the mammalian lineages (fig. 6B).
The genome assembly of fugu, Tetraodon, and medaka consist of 7,118 (this work), 128 (Jaillon et al. 2004), 8,134 (Ensembl build 50) scaffolds or ultracontigs, respectively, whereas those of human, mouse, and opossum are made up of 367 (NCBI build 36), 315 (NCBI build 37), and 5,180 (Mikkelsen et al. 2007) scaffolds or supercontigs, respectively. Because the high degree of fragmentation of some genomes introduces gaps in the assembly and artificially breaks the synteny, the interchromosomal rearrangements estimated by the disruption of proximate gene pairs will be overestimated for highly fragmented assemblies. To avoid this bias, we chose only genes mapped to the chromosomes. Because genes mapped in one species but not in another species will be miscounted as rearrangements, we then chose genes that showed one-to-one orthologous relationship from the mapped gene sets for all six vertebrates. This choice eliminates the possibility of lineage-specific gene loss events being miscounted as rearrangement events. One downside of this approach is that we ended up with a smaller number of orthologous set for comparison (e.g., a large number of human–mouse genes were dropped because of the relatively high level of fragmentation of fugu genome and the low coverage of Tetraodon assembly.).
Previous studies had suggested a lower degree of interchromosomal exchange in the teleost lineage compared with that in the human lineage (Naruse et al. 2004; Woods et al. 2005). In particular, Jaillon et al. (2004) and Kasahara et al. (2007) demonstrated a remarkable preservation of ancestral genomic structure in Tetraodon and medaka, respectively. However, their work did not focus on intrachromosomal rearrangements. Although they identified intrachromosomal rearrangements in the Tetraodon or medaka lineages, they did not estimate the extent of rearrangements. On the other hand, Sémon and Wolfe (2007a) estimated both inter- and intrachromosomal rearrangement rates among fugu, Tetraodon, zebrafish, human, mouse, and chicken by measuring the loss of gene proximity. However, the lack of chromosomal coordinates for genes predicted in the fugu assembly did not allow a reliable estimation of the rearrangement rate in the pufferfish lineage. Our analyses using the extended assembly and the positional information of genes along the chromosomes of fugu have revealed the relative contributions of inter- and intrachromosomal rearrangements to the evolution of fugu, Tetraodon, and medaka genomes and showed that the mammalian lineages have experienced a relatively higher degree of interchromosomal rearrangements compared with these teleosts. These findings indicate that mammalian genomes are more dynamic than teleost genomes at least at the level of interchromosomal exchanges.
Previous studies have shown that genomes of invertebrates such as Drosophila, Caenorhabditis, and Ciona have experienced an extremely low rate of interchromosomal rearrangements compared with mammals (Drosophila 12 Genomes Consortium 2007; Hillier et al. 2007; Hill et al. 2008). Although it is difficult to directly compare the frequency of interchromosomal rearrangements between fishes and these invertebrates due to the different estimation methods used, the interchromosomal rearrangements are much more rare at least in the Caenorhabditis lineage than in the lineages of pufferfishes and medaka. Nearly, 95% of orthologs between two Caenorhabditis species were found to have remained syntenic during the ∼100 My of their divergence (Hillier et al. 2007). This suggests that the rate of interchromosomal rearrangement in teleost fishes is intermediary to those in Caenorhabditis and mammals. The paucity of interchromosomal rearrangements in invertebrates compared with mammals was speculated to be, at least in part, due to the small effective population size of mammals (Hillier et al. 2007; Hill et al. 2008). Population sizes of mammals are indeed one to four orders of magnitude smaller than those of invertebrates (Yu et al. 2001; Small et al. 2007). However, the population-size hypothesis cannot fully explain the difference in the rate of interchromosomal rearrangements between mammals and teleosts because the estimated population sizes of teleost fishes are not particularly larger than those of mammals (DeWoody and Avise 2000; Hauser and Carvalho 2008). Besides population size, the effectiveness of selection against mildly deleterious mutations can also be influenced by factors such as recombination rate and reproduction strategy. It is known that a low recombination on chromosomes potentially leads to increased fixation of slightly deleterious mutations (Comeron et al. 2008). The high recombination rates in the genome of fugu and other teleosts (fig. 2) might play a role in effectively purging interchromosomal rearrangements in teleosts. It is also possible that the selection pressure is affected by the differences in the reproduction strategy of teleosts and mammals. Unlike mammals, many fishes have a high fecundity rate and a high juvenile mortality rate (Araki et al. 2008). This reproduction strategy of fishes potentially provides an opportunity for purifying selection at the juvenile stage (Lynch and O’Hely 2001; Araki et al. 2008).
Intrachromosomal rearrangements comprising mainly inversions can generate structural problems of chromosomes during meiosis, and the chromosomal breakpoints can disrupt coding regions and/or affect the expression patterns of genes. However, unlike interchromosomal rearrangements, majority of inversions do not produce aneuploid genotypes (Kirkpatrick 2010). Therefore, the rate of intrachromosomal rearrangements would be less sensitive to selection than the rate of interchromosomal rearrangements. This may explain the similar rate of proximity loss of genes by interchromosomal rearrangements in teleost and mammalian lineages.
Fugu as a Model for Evolutionary Genetic Studies
Recent advances in our understanding of the relationship between sequence and function of genes have paved the way for investigating genomic changes associated with evolutionary novelty, adaptation, and speciation in the wild. Genetic mapping using experimental crosses of organisms with divergent phenotypes has proved to be very effective in identifying genomic changes. Teleost fishes such as stickleback and cichlids have proved to be particularly useful for such an approach (Colosimo et al. 2004; Kocher 2004). Although fugu has hitherto received more attention as a genome model, we propose that fugu and its related pufferfishes of the genus Takifugu are also a good system for genetic study of phenotypic evolution (Kai et al. 2005). Pufferfishes belonging to the genus Takifugu have undergone explosive speciation in the recent 2–5 My (Yamanoue et al. 2009), resulting in ∼25 extant species that exhibit wide diversity in their body size, coloration, exoskeletal morphology, number of meristic skeletons, temperature preference, osmoregulation strategy, parasite resistance, and behavior (Uno 1955; Ogawa 1991; Kato et al. 2005). Furthermore, interspecies crosses of Takifugu produce fertile hybrid progeny that are amenable for genetic mapping and developmental studies (Masuda et al. 1991; Fujita and Abe 1992; Miyaki et al. 1995; Kikuchi et al. 2007; Suda et al. 2009). Thus, Takifugu species represent an interesting model to investigate the genetic basis of phenotypic evolution between closely related species and to identify the genetic basis of speciation in vertebrates. The integrated high-resolution genetic map and the genome assembly of fugu generated in the present study should greatly facilitate these lines of research.
Supplementary Material
Acknowledgments
We thank Naoki Mizuno, Masashi Fujita, and Yuka Jo for maintaining fish and Shinichi Kido, Takashi Kamiya, and Yumi Kawabata for help in some experiments. We also thank Kevin Lam, Yue Ying Tan, and Alison Lee for annotating v5 of the fugu genome assembly. This work was supported by grants from the Ministry of Education, Culture, Sports, Science and Technology of Japan (no. 20380107, no. 20228003, no. 18580175, no. 19040003 and no. 17208017), and the Biomedical Research Council of A*STAR, Singapore.
References
- Aparicio S, et al. Whole-genome shotgun assembly and analysis of the genome of Fugu rubripes. Science. 2002;297:1301–1310. doi: 10.1126/science.1072104. [DOI] [PubMed] [Google Scholar]
- Araki H, Berejikian BA, Ford MJ, Blouin MS. Fitness of hatchery-reared salmonids in the wild. Evol Appl. 2008;1:342–355. doi: 10.1111/j.1752-4571.2008.00026.x. [DOI] [PMC free article] [PubMed] [Google Scholar]
- Benton MJ, Donoghue PCJ. Paleontological evidence to date the tree of life. Mol Biol Evol. 2007;24:26–53. doi: 10.1093/molbev/msl150. [DOI] [PubMed] [Google Scholar]
- Beye M, et al. Exceptionally high levels of recombination across the honey bee genome. Genome Res. 2006;16:1339–1344. doi: 10.1101/gr.5680406. [DOI] [PMC free article] [PubMed] [Google Scholar]
- Brenner S, et al. Characterization of the pufferfish (Fugu) genome as a compact model vertebrate genome. Nature. 1993;366:265–268. doi: 10.1038/366265a0. [DOI] [PubMed] [Google Scholar]
- Charlesworth D, Charlesworth B, Marais G. Steps in the evolution of heteromorphic sex chromosomes. Heredity. 2005;95:118–128. doi: 10.1038/sj.hdy.6800697. [DOI] [PubMed] [Google Scholar]
- Colosimo PF, et al. The genetic architecture of parallel armor plate reduction in threespine sticklebacks. PLoS Biol. 2004;2:e109. doi: 10.1371/journal.pbio.0020109. [DOI] [PMC free article] [PubMed] [Google Scholar]
- Comeron JM, Williford A, Kliman RM. The Hill-Robertson effect: evolutionally consequences of weak selection and linkage in finite populations. Heredity. 2008;100:19–31. doi: 10.1038/sj.hdy.6801059. [DOI] [PubMed] [Google Scholar]
- DeWoody JA, Avise JC. Microsatellite variation in marine, freshwater and anadromous fishes compared with other animals. J Fish Biol. 2000;56:461–473. [Google Scholar]
- Drosophila 12 Genomes Consortium. Evolution of genes and genomes on the Drosophila phylogeny. Nature. 2007;450:203–218. doi: 10.1038/nature06341. [DOI] [PubMed] [Google Scholar]
- Fujita S. Artificial interspecific and intergeneric hybridizations among the Tetraodontid puffer (preliminary report) Jpn J Michurin Biol. 1967;3:5–11. [Google Scholar]
- Fujita S, Abe T. Induction of ovarian maturation and development of eggs, larvae, and juveniles of the purple puffer Takifugu porphyreus reared in the laboratory. Nippon Suisan Gakkaishi. 1992;58:1627–1632. [Google Scholar]
- Fujiwara A, Fujiwara M, Nishida-Umehara C, Abe S, Masaoka T. Characterization of Japanese flounder karyotype by chromosome bandings and fluorescence in situ hybridization with DNA markers. Genetica. 2007;131:267–274. doi: 10.1007/s10709-006-9136-z. [DOI] [PubMed] [Google Scholar]
- Fujiwara A, et al. Improved fish lymphocyte culture for chromosome preparation. Genetica. 2001;111:77–89. doi: 10.1023/a:1013788626712. [DOI] [PubMed] [Google Scholar]
- Goode DK, Snell P, Smith SF, Cooke JE, Elgar G. Highly conserved regulatory elements around the SHH gene may contribute to the maintenance of conserved synteny across human chromosome 7q36.3. Genomics. 2005;86:172–181. doi: 10.1016/j.ygeno.2005.04.006. [DOI] [PubMed] [Google Scholar]
- Groenen MAM, et al. A high-density SNP-based linkage map of the chicken genome reveals sequence features correlated with recombination rate. Genome Res. 2009;19:510–519. doi: 10.1101/gr.086538.108. [DOI] [PMC free article] [PubMed] [Google Scholar]
- Hauser L, Carvalho GR. Paradigm shifts in marine fisheries genetics: ugly hypotheses slain by beautiful facts. Fish Fish. 2008;9:333–362. [Google Scholar]
- Hill MM, et al. The C. savignyi genetic map and its integration with the reference sequence facilitates insights into chordate genome evolution. Genome Res. 2008;18:1369–1379. doi: 10.1101/gr.078576.108. [DOI] [PMC free article] [PubMed] [Google Scholar]
- Hillier LD, et al. Comparison of C. elegans and C. briggasae genome sequences reveals extensive conservation of chromosome organization and synteny. PLoS Biol. 2007;5:e167. doi: 10.1371/journal.pbio.0050167. [DOI] [PMC free article] [PubMed] [Google Scholar]
- Hurley I, Hale ME, Prince VE. Duplication events and the evolution of segmental identity. Evol Dev. 2005;7:556–567. doi: 10.1111/j.1525-142X.2005.05059.x. [DOI] [PubMed] [Google Scholar]
- Hurley IA, et al. A new time-scale for ray-finned fish evolution. Proc Biol Sci. 2007;22:489–498. doi: 10.1098/rspb.2006.3749. [DOI] [PMC free article] [PubMed] [Google Scholar]
- International Chicken Genome Sequencing Consortium. Sequence and comparative analysis of the chicken genome provide unique perspectives on vertebrate evolution. Nature. 2004;432:695–716. doi: 10.1038/nature03154. [DOI] [PubMed] [Google Scholar]
- Jaillon O, et al. Genome duplication in the teleost fish Tetraodon nigroviridis reveals the early vertebrate proto-karyotype. Nature. 2004;431:946–957. doi: 10.1038/nature03025. [DOI] [PubMed] [Google Scholar]
- Kai W, et al. A genetic linkage map for the tiger pufferfish, Takifugu rubripes. Genetics. 2005;171:227–238. doi: 10.1534/genetics.105.042051. [DOI] [PMC free article] [PubMed] [Google Scholar]
- Kasahara M, et al. The medaka draft genome and insights into vertebrate genome evolution. Nature. 2007;447:714–719. doi: 10.1038/nature05846. [DOI] [PubMed] [Google Scholar]
- Kato A, Doi H, Nakada T, Sakai H, Hirose S. Takifugu obscurus is a euryhaline fugu species very close to Takifugu rubripes and suitable for studying osmoregulation. BMC Physiol. 2005;5:18. doi: 10.1186/1472-6793-5-18. [DOI] [PMC free article] [PubMed] [Google Scholar]
- Kikuchi K, et al. The sex-determining locus in the tiger pufferfish, Takifugu rubripes. Genetics. 2007;175:2039–2042. doi: 10.1534/genetics.106.069278. [DOI] [PMC free article] [PubMed] [Google Scholar]
- Kirkpatrick M. How and why chromosome inversions evolve. PLoS Biol. 2010;8:e1000501. doi: 10.1371/journal.pbio.1000501. [DOI] [PMC free article] [PubMed] [Google Scholar]
- Kocher TD. Adaptive evolution and explosive speciation: the cichlid fish model. Nat Rev Genet. 2004;5:288–298. doi: 10.1038/nrg1316. [DOI] [PubMed] [Google Scholar]
- Kong A, et al. A high-resolution recombination map of the human genome. Nat Genet. 2002;31:241–247. doi: 10.1038/ng917. [DOI] [PubMed] [Google Scholar]
- Kumar S, Subramanian S. Mutation rates in mammalian genomes. Proc Natl Acad Sci U S A. 2002;99:803–808. doi: 10.1073/pnas.022629899. [DOI] [PMC free article] [PubMed] [Google Scholar]
- Lander ES, et al. MapMaker: an interactive computer package for constructing primary genetic linkage maps of experimental and natural populations. Genomics. 1987;1:174–181. doi: 10.1016/0888-7543(87)90010-3. [DOI] [PubMed] [Google Scholar]
- Lenormand T. The evolution of sex dimorphism in recombination. Genetics. 2003;163:811–822. doi: 10.1093/genetics/163.2.811. [DOI] [PMC free article] [PubMed] [Google Scholar]
- Lenormand T, Dutheil J. Recombination difference between sexes: a role for haploid selection. PLoS Biol. 2005;3:e63. doi: 10.1371/journal.pbio.0030063. [DOI] [PMC free article] [PubMed] [Google Scholar]
- Lercher MJ, Hurst LD. Imprinted chromosomal regions of the human genome have unusually high recombination rates. Genetics. 2003;165:1629–1632. doi: 10.1093/genetics/165.3.1629. [DOI] [PMC free article] [PubMed] [Google Scholar]
- Li WH, Ellsworth DL, Krushkal J, Chang BH, Hewett-Emmett D. Rate of nucleotide substitution in primates and rodents and the generation-time effect hypothesis. Mol Phylogenet Evol. 1996;5:182–187. doi: 10.1006/mpev.1996.0012. [DOI] [PubMed] [Google Scholar]
- Lynch M, Conery J. The evolutionary fate and consequences of gene duplication. Science. 2000;290:1151–1155. doi: 10.1126/science.290.5494.1151. [DOI] [PubMed] [Google Scholar]
- Lynch M, Force AG. The origin of interspecific genomic incompatibility via gene duplication. Am Nat. 2000;156:590–605. doi: 10.1086/316992. [DOI] [PubMed] [Google Scholar]
- Lynch M, O’Hely M. Captive breeding and the genetic fitness of natural populations. Conserv Genet. 2001;2:363–378. [Google Scholar]
- Masuda Y, Shinohara N, Takahashi Y, Tabeta O, Matsuura K. Occurrence of natural hybrid between pufferfishes, Takifugu xanthopterus and T. vermicularis, in Ariake bay, Kyushu, Japan. Nippon Suisan Gakkaishi. 1991;57:1247–1255. [Google Scholar]
- McLysaght A, Enright AJ, Skrabanek L, Wolfe KH. Estimation of synteny conservation and genome compaction between pufferfish (Fugu) and human. Yeast. 2000;17:22–36. doi: 10.1002/(SICI)1097-0061(200004)17:1<22::AID-YEA5>3.0.CO;2-S. [DOI] [PMC free article] [PubMed] [Google Scholar]
- Meyer A, Van de Peer Y. From 2R to 3R: evidence for a fish-specific genome duplication (FSGD) Bioessays. 2005;27:937–945. doi: 10.1002/bies.20293. [DOI] [PubMed] [Google Scholar]
- Mikkelsen TS, et al. Genome of the marsupial Monodelphis domestica reveals innovation in non-coding sequences. Nature. 2007;447:167–178. doi: 10.1038/nature05805. [DOI] [PubMed] [Google Scholar]
- Miyaki K, Tabeta O, Kayano H. Karyotypes in six species of pufferfishes genus Takifugu (Tetraodontidae, Tetraodontiformes) Fish Sci. 1995;61:594–598. [Google Scholar]
- Myers S, Bottolo L, Freeman C, McVean G, Donnelly P. A fine-scale map of recombination rates and hotspots across the human genome. Science. 2005;310:321–324. doi: 10.1126/science.1117196. [DOI] [PubMed] [Google Scholar]
- Nakatani Y, Takeda H, Kohara Y, Morishita S. Reconstruction of the vertebrate ancestral genome reveals dynamic genome reorganization in early vertebrates. Genome Res. 2007;17:1254–1265. doi: 10.1101/gr.6316407. [DOI] [PMC free article] [PubMed] [Google Scholar]
- Naruse K, et al. A medaka gene map: the trace of ancestral vertebrate proto-chromosomes revealed by comparative gene mapping. Genome Res. 2004;14:820–828. doi: 10.1101/gr.2004004. [DOI] [PMC free article] [PubMed] [Google Scholar]
- Nelson JS. Fishes of the world. 4th ed. New York: John Wiley and Sons, Inc; 2006. [Google Scholar]
- Ogawa K. Redescription of Heterobothrium tetrodomis (Goto, 1984) (Monogenea: Diclidophoridae) and other related new species from puffers of genus Takifugu (Teleost: tetraodontidae) Jpn J Parasitol. 1991;40:388–396. [Google Scholar]
- Ohno S. Evolution by gene duplication. New York: Springer-Verlag; 1970. [Google Scholar]
- Ohta T. Near-neutrality in evolution of genes and gene regulation. Proc Natl Acad Sci U S A. 2002;99:16134–16137. doi: 10.1073/pnas.252626899. [DOI] [PMC free article] [PubMed] [Google Scholar]
- Oleksyk TK, Smith MW, O’Brien SJ. Genome-wide scans for footprints of natural selection. Philos Trans R Soc B. 2010;365:185–205. doi: 10.1098/rstb.2009.0219. [DOI] [PMC free article] [PubMed] [Google Scholar]
- Pennacchio LA, et al. In vivo enhancer analysis of human conserved non-coding sequences. Nature. 2006;444:499–502. doi: 10.1038/nature05295. [DOI] [PubMed] [Google Scholar]
- Rodionov AV. Micro vs. macro: structural-functional organization of avian micro- and macrochromosomes. Genetika. 1996;32:597–608. [PubMed] [Google Scholar]
- Sakamoto T, et al. A microsatellite linkage map of rainbow trout (Oncorhynchus mykiss) characterization by large sex-specific differences in recombination rates. Genetics. 2000;155:1331–1345. doi: 10.1093/genetics/155.3.1331. [DOI] [PMC free article] [PubMed] [Google Scholar]
- Schuelke M. An economic method for the fluorescent labeling of PCR fragments. Nat Biotechnol. 2000;18:233–234. doi: 10.1038/72708. [DOI] [PubMed] [Google Scholar]
- Sémon M, Wolfe KH. Rearrangement rate following the whole-genome duplication in teleost. Mol Biol Evol. 2007a;24:860–867. doi: 10.1093/molbev/msm003. [DOI] [PubMed] [Google Scholar]
- Sémon M, Wolfe KH. Reciprocal gene loss between Tetraodon and zebrafish after whole genome duplication in their ancestor. Trends Genet. 2007b;23:108–112. doi: 10.1016/j.tig.2007.01.003. [DOI] [PubMed] [Google Scholar]
- Shifman S, et al. A high-resolution single nucleotide polymorphism genetic map of the mouse genome. PLoS Biol. 2006;4:e395. doi: 10.1371/journal.pbio.0040395. [DOI] [PMC free article] [PubMed] [Google Scholar]
- Singer A, et al. Sex-specific recombination rates in zebrafish (Danio rerio) Genetics. 2002;160:649–657. doi: 10.1093/genetics/160.2.649. [DOI] [PMC free article] [PubMed] [Google Scholar]
- Small KS, Brudno M, Hill MM, Sidow A. Extreme genomic variation in a natural population. Proc Natl Acad Sci U S A. 2007;104:5698–5703. doi: 10.1073/pnas.0700890104. [DOI] [PMC free article] [PubMed] [Google Scholar]
- Stephen S, Pheasant M, Makunin IV, Mattick JS. Large-scale appearance of ultraconserved elements in tetrapod genomes and slowdown of the molecular clock. Mol Biol Evol. 2008;25:402–408. doi: 10.1093/molbev/msm268. [DOI] [PubMed] [Google Scholar]
- Streelman JT, Peichel CL, Parichy DM. Development genetics of adaptation in fishes: the case for novelty. Annu Rev Ecol Evol Syst. 2007;38:655–681. [Google Scholar]
- Suda Y, et al. Evolution of Otx paralogue usages in early patterning of the vertebrate head. Dev Biol. 2009;325:282–295. doi: 10.1016/j.ydbio.2008.09.018. [DOI] [PubMed] [Google Scholar]
- Tanaka K, Takehana Y, Naruse K, Hamaguchi S, Sakaizumi M. Evidence for different origins of sex chromosomes in closely related Oryzias fishes: substitution of the master sex-determining gene. Genetics. 2007;177:2075–2081. doi: 10.1534/genetics.107.075598. [DOI] [PMC free article] [PubMed] [Google Scholar]
- Tesler G. GRIMM: genome rearrangements web sever. Bioinformatics. 2002;18:492–493. doi: 10.1093/bioinformatics/18.3.492. [DOI] [PubMed] [Google Scholar]
- The Cold Spring Harbor Laboratory, Washington University Genome Sequencing Center, PE Biosystems Arabidopsis Sequencing Consortium. The complete sequence of a heterochromatic island from a higher eukaryote. Cell. 2000;100:377–386. [PubMed] [Google Scholar]
- Topp CN, Dawe RK. Reinterpreting pericentromeric heterochromatin. Curr Opin Plant Biol. 2006;9:647–653. doi: 10.1016/j.pbi.2006.09.008. [DOI] [PubMed] [Google Scholar]
- Uno Y. Spawning habit and early development of a puffer, Fugu (Torafugu) niphobles (Jordan et Snyder) J Tokyo Univ Fish. 1955;41:169–183. [Google Scholar]
- Vandepoele K, De Vos W, Taylor JS, Meyer A, Van de Peer Y. Major events in the genome evolution of vertebrates: paranome age and size differ consiserably between ray-finned fishes and land vertebrates. Proc Natl Acad Sci U S A. 2004;101:1638–1643. doi: 10.1073/pnas.0307968100. [DOI] [PMC free article] [PubMed] [Google Scholar]
- Volff JN. Genome evolution and biodiversity in teleost fish. Heredity. 2005;94:280–294. doi: 10.1038/sj.hdy.6800635. [DOI] [PubMed] [Google Scholar]
- Woods IG, et al. The zebrafish gene map defines ancestral vertebrate chromosome. Genome Res. 2005;15:1307–1314. doi: 10.1101/gr.4134305. [DOI] [PMC free article] [PubMed] [Google Scholar]
- Woolfe A, Elgar G. Comparative genomics using Fugu reveals insights into regulatory subfunctionalization. Genome Biol. 2007;8:R53. doi: 10.1186/gb-2007-8-4-r53. [DOI] [PMC free article] [PubMed] [Google Scholar]
- Woolfe A, et al. Highly conserved non-coding sequences are associated with vertebrate development. PLoS Biol. 2005;3:e7. doi: 10.1371/journal.pbio.0030007. [DOI] [PMC free article] [PubMed] [Google Scholar]
- Yamanoue Y, et al. Explosive speciation of Takifugu: another use of fugu as a model system for evolutionary biology. Mol Biol Evol. 2009;26:623–629. doi: 10.1093/molbev/msn283. [DOI] [PubMed] [Google Scholar]
- Yeo G, Hoon S, Venkatesh B, Burge CB. Variation in sequence and organization of splicing regulatory elements in vertebrate genes. Proc Natl Acad Sci U S A. 2004;101:15700–15705. doi: 10.1073/pnas.0404901101. [DOI] [PMC free article] [PubMed] [Google Scholar]
- Yu N, et al. Global patterns of human DNA sequence variation in a 10-kb region on chromosome 1. Mol Biol Evol. 2001;18:214–222. doi: 10.1093/oxfordjournals.molbev.a003795. [DOI] [PubMed] [Google Scholar]
- Yu Q, et al. A physical map of the papaya genome with integrated genetic map and genome sequence. BMC Genomics. 2009;10:371. doi: 10.1186/1471-2164-10-371. [DOI] [PMC free article] [PubMed] [Google Scholar]
Associated Data
This section collects any data citations, data availability statements, or supplementary materials included in this article.