

Abstract
Despite considerable research connecting cellular metabolism with differentiation decisions, the underlying mechanisms that translate metabolite-sensitive activities into unique gene programs are still unclear. We found that aspects of the interleukin-2 (IL-2)-sensitive effector gene program in CD4+ and CD8+ T cells in type 1 conditions (Th1) were regulated by glutamine and alpha-ketoglutarate (αKG)-induced events, in part through changes in DNA and histone methylation states. We further identified a mechanism by which IL-2- and αKG-sensitive metabolic changes regulated the association of CCCTC-binding factor (CTCF) with select genomic sites. αKG-sensitive CTCF sites were often associated with loci containing IL-2- and αKG-sensitive genome organization patterns and gene expression in T cells. IL-2- and αKG-sensitive CTCF sites in T cells were also associated with genes from developmental pathways that had αKG-sensitive expression in embryonic stem cells. The data collectively support a mechanism wherein CTCF serves to translate αKG-sensitive metabolic changes into context-dependent differentiation gene programs.
In Brief / eTOC
Metabolic states dynamically change during cellular differentiation, but it is currently unclear how changes in metabolism mechanistically regulate differentiation gene programs. Chisolm et al. define a mechanism by which CTCF translates IL-2 and αKG-sensitive metabolic events into context-dependent differentiation gene programs.
Introduction
Cellular metabolism is closely coupled to differentiation gene programs in many developmental systems (Pearce et al., 2013; Ryall et al., 2015). In part, this is due to a similar complement of transcription factors playing dual roles regulating both the gene expression programs associated with differentiation and specific metabolic pathways (Oestreich et al., 2014; Polo et al., 2012). In T cells, T cell receptor (TCR)-and interleukin 2 (IL-2)-sensitive transcription factors coordinate the programming of metabolic states with the effector and memory gene programs (Chisolm and Weinmann, 2015). In particular, the induction of glycolysis, glutaminolysis, and the lipid biosynthesis pathway are required for effector T cell differentiation (Pearce et al., 2013; Wang et al., 2011). Inhibition of these metabolic states, whether in dysregulated environmental states, through genetic means, or with metabolic inhibitors, results in altered effector T cell differentiation (Chang et al., 2015; Doedens et al., 2013; Ho et al., 2015; Sukumar et al., 2013). To date, the mechanisms by which metabolic states actively contribute to the regulation of T cell differentiation gene programs are unclear.
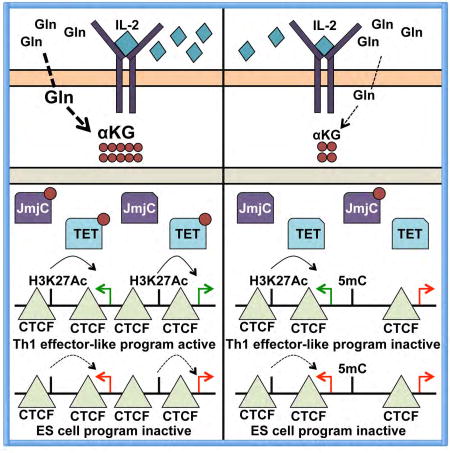
Research in embryonic stem (ES) cells has provided insight into how metabolism influences epigenetic states and differentiation gene programs. Metabolic reprogramming in ES cells plays a role in broadly regulating epigenetic states through the ability of metabolites to serve as donors and substrates for DNA and histone modifications, as well as co-factors for epigenetic-modifying complexes (Ryall et al., 2015). For example, threonine metabolism influences ES cell differentiation in part by modulating the metabolites S-adenosylmethionine (SAM) and acetyl-coenzyme A (acetyl-CoA) to broadly influence the state of histone modifications in the cell (Shyh-Chang et al., 2013). Glucose metabolism mediated through the glycolysis pathway can change acetyl-CoA levels and bulk histone acetylation to impact ES cell differentiation potential (Moussaieff et al., 2015). Recently, this activity was observed in T cells as well (Peng et al., 2016). Another example is related to glutamine (Gln) uptake, which in part regulates intracellular alpha-ketoglutarate (αKG) levels (Carey et al., 2015). The accumulation of intracellular αKG influences the differentiation potential of ES cells, with some of its activity related to the role for αKG as a required co-factor for the Jumonji C family of histone demethylases as well as for the Ten Eleven Translocation (TET) family of DNA-dioxygenases, which can cause broad changes in the state of histone and DNA methylation in the cell (Su et al., 2016; Tahiliani et al., 2009). A major gap in our current knowledge is how these broad epigenetic events are precisely translated into specific differentiation gene programs.
CCCTC-binding factor (CTCF) is a DNA-binding zinc finger transcription factor that plays a role in spatially organizing the genome to promote the precise regulation of developmental processes and gene programs (Benner et al., 2015; Bonora et al., 2014; Ong and Corces, 2014). The methylation state of select CTCF DNA binding sites influences the ability of CTCF to bind to genomic elements and is thought to be important for defining cell-type and context-specific gene programs (Teif et al., 2014). In addition, CTCF association with select genomic regions is dysregulated in glioma cells with mutations in isocitrate dehydrogenase (IDH), suggesting that aberrant metabolism disrupts the normal activity of CTCF (Flavahan et al., 2016). This raises the question of whether CTCF might be sensitive to natural changes in metabolic states that occur during cellular development and serve to integrate metabolic information into differential gene programs.
In this study, we found that metabolic perturbations mediated through Gln and αKG influenced aspects of the IL-2-sensitive effector gene program in CD4+ T helper 1 (Th1) and CD8+ T cytotoxic 1 (Tc1) cells. At least part of the role for αKG was related to histone H3 lysine 27 trimethylation (H3K27me3) and DNA-methylation states. Mechanistically, we defined that IL-2-sensitive changes in metabolism mediated through αKG promoted CTCF association with a select subset of CTCF sites and this impacted genome topology. We also found that IL-2- and αKG-sensitive events were differentially interpreted based in part on the surrounding epigenetic landscape. Collectively, these data suggest that changes in metabolism play a role in regulating cellular differentiation programs by altering CTCF binding patterns and genome interactions, but that additional context-dependent activities influence the functional impact for these events.
Results
αKG influences the expression of IL-2-sensitive genes in CD4+ Th1 and CD8+ Tc1 cells
To define the mechanisms by which IL-2-sensitive changes in metabolism contribute to T cell differentiation gene programs, we utilized an experimental system in which primary CD4+ or CD8+ T cells polarized in type 1 conditions were maintained in either high or low environmental concentrations of IL-2 (Figure S1A)(Oestreich et al., 2012; Oestreich et al., 2014). The strength of IL-2-signaling can influence the gene expression programming between the effector and memory (or T follicular helper (Tfh)) differentiation signatures in T cells (Ballesteros-Tato et al., 2012; Kalia et al., 2010; Oestreich et al., 2012; Pipkin et al., 2010). We recapitulated these results in RNA-sequencing (RNA-seq) and gene set enrichment analyses (GSEA), which demonstrated that high environmental IL-2 concentrations (high IL-2) promoted a gene signature similar to effector T cells formed during a natural type I immune response in vivo (Figure S1C)(Luckey et al., 2006; Wherry et al., 2007). In contrast, genes in the memory signature as well as the Tfh signature were enriched in cells maintained in low environmental IL-2 concentrations (low IL-2). In addition, metabolites in the glycolysis pathway as well as in glutaminolysis, such as αKG, accumulate in effector T cells and with high IL-2 conditions (Gerriets et al., 2015; van der Windt et al., 2013; Verbist et al., 2016; Wang et al., 2011)(Figure S1D). Taken together, this represents a tractable primary cell setting to define the mechanisms by which metabolic events influence T cell differentiation gene programs.
To address whether the IL-2-induced accumulation of αKG contributes to T cell differentiation gene programming, we added cell permeable αKG (dimethyl-alpha-ketoglutarate, referred to as αKG)(Carey et al., 2015) to primary CD4+ or CD8+ T cells polarized in type I conditions and maintained in low environmental IL-2 concentrations (Figure S1A). If αKG plays an important role in promoting aspects of the IL-2-dependent effector gene program, the addition of αKG to CD4+ Th1 or CD8+ Tc1 cells maintained in low IL-2 concentrations would promote the expression of the effector program similar to that observed in high IL-2 conditions. We first performed quantitative reverse transcriptase polymerase chain reaction (qRT-PCR) analyses to assess the expression of select IL-2-sensitive effector or memory genes in the Th1 or Tc1 cells maintained in high IL-2, low IL-2, or low IL-2 with αKG. Genes associated with the effector program, including Ifng, Cxcr4 and Prdm1, as well as genes associated with the glycolysis pathway, including Hk2 and Slc2a1, were induced in both high IL-2 as well as low IL-2 with αKG in comparison to the low IL-2 condition alone (Figure 1A, 1B). In contrast, select genes associated with memory or Tfh potential, such as Tcf7, were inhibited by the addition of αKG to the low IL-2 condition similar to the high IL-2 condition (Figure 1A, 1B). As a control, the addition of cell permeable succinate had little to no effect on the expression of these genes in CD4+ Th1 cells (Figure S1E).
Figure 1. αKG-induced metabolic changes regulate select genes in the IL-2-sensitive pathway.

(A, B) Transcripts from (A) primary CD4+ T cells or (B) CD8+ T cells polarized in type 1 conditions and exposed to high IL-2 (black bars), low IL-2 (white bars), or low IL-2 with αKG (grey bars) for two days were measured by qRT-PCR and/or RNA-seq (see also Fig. S2). (C) Flow cytometry, (D) ELISA, and (E, F) western blot analyses of protein expression levels for CXCR3, IFNγ, TCF1 and HK2 are shown for primary CD4+ T cells maintained as indicated in (A). The n= at least (A, C, E, F) 3, (B) 4, or (D) 6 independent biological replicates for each gene/protein. (A, B, D) Error bars represent the standard error of the mean (SEM) and an unpaired student t-test was performed with p values indicated (* ≤0.05, **≤0.001, and ***≤0.0001). See also Fig. S1, S2.
We next addressed whether the αKG-sensitive changes in gene expression cause a functional consequence on protein expression. To assess this, we monitored protein expression encoded by IL-2-and αKG-sensitive genes from primary CD4+ T cells polarized in Th1 conditions and maintained in high IL-2, low IL-2, or low IL-2 with αKG. Similar to the gene expression data, TCF1 (encoded by the Tcf7 gene) and chemokine receptor CXCR3 protein expression were inhibited by IL-2- and αKG-sensitive activities, whereas interferon γ (IFNγ) production and hexokinase 2 (HK2) expression were enhanced (Figure 1C–F). Therefore, protein and gene expression patterns were similar, indicating that αKG-sensitive changes in gene expression can be translated into functional changes at the protein level.
αKG induces aspects of the IL-2-sensitive effector gene program in CD4+ Th1 and CD8+ Tc1 cells
We next conducted RNA-seq analyses on CD4+ Th1 or CD8+ Tc1 cells maintained in high IL-2, low IL-2, or low IL-2 with αKG to define the composition of the IL-2-sensitive gene program that is impacted by metabolic changes related to αKG. As a control, the RNA-seq experiments showed similar trends in the expression of the select genes that were monitored by qRT-PCR (Figure 1A, 1B, S2A, S2B). Using a two-fold threshold for differential gene expression, roughly 28% to 35% of the gene program that was induced in high IL-2 relative to low IL-2 conditions was also induced by the addition of αKG to the low IL-2 condition in CD4+ Th1 and CD8+ Tc1 cells, respectively (Figure 2A, 2B). In contrast, αKG inhibited approximately 8% to 14% of the genes that were more highly expressed in low IL-2 relative to high IL-2 conditions. These data suggest αKG-sensitive events play a role in both the induction and inhibition of the IL-2-sensitive gene program in CD4+ Th1 and CD8+ Tc1 cells, with αKG-sensitive activities having a greater role in promoting IL-2-inducible events. Additionally, nearly 80% of the genes that were αKG-sensitive were also IL-2-sensitive (Figure 2A, 2B). This suggests that a substantial portion of the αKG-sensitive program in CD4+ Th1 and CD8+ Tc1 cells relates to the IL-2-sensitive program.
Figure 2. Gln- and α KG-sensitive events regulate a portion of the IL-2-sensitive pathway.

(A, B) Venn diagrams comparing genes that were induced (left) or inhibited (right) by at least 2-fold in high IL-2 (blue circles) or the addition of αKG to low IL-2 (yellow circles) as compared to low IL-2 conditions in (A) CD4+ or (B) CD8+ T cells. (C, D) FDR q values for the enrichment of select pathways from a GSEA examining genes from (C) CD4+ or (D) CD8+ T cells that were induced 2-fold in high IL-2 relative to low IL-2 (black bars) or low IL-2 with αKG relative to low IL-2 (hatched bars). (E) Flow cytometry analysis of E450 dilution in primary CD4+ T cells polarized in Th1 conditions and exposed to high IL-2 (dark blue), low IL-2 (light blue), or low IL-2 with αKG (purple) for two days. Data are representative of 3 independent biological replicates. (F) qRT-PCR analysis of transcript expression from primary CD4+ T cells polarized in Th1 conditions that were maintained in media with Gln and in high IL-2 conditions (black bar), low IL-2 (white bar), or low IL-2 with αKG (dark grey bar) or were maintained without Gln and in high IL-2 (light grey) or high IL-2 with αKG (medium grey) for two days. The n= at least 4 independent biological replicates for each gene. Error bars represent SEM and an unpaired student t-test was performed with p values indicated (* ≤0.05, **≤0.001, and ***≤0.0001). (G) The frequency of CD45.1+OTII cells in the recipients of control (Ctrl) and DON treated cells. (H, J) The frequency and (I, K) number of CD45.1+OTII cells with a (H, I) Teff phenotype (Bcl6loCXCR5loTbethiBlimp1hi) or (J, K) Tfh cell phenotype (Bcl6hiCXCR5hiTbetloBlimp1lo) in recipients receiving control or DON treated cells. Data are shown as the mean ± SD (n=5–6 mice) and are representative of two independent experiments. P values were determined using a two-tailed Student´s t-test (* ≤0.05, **≤0.005). (L) Heatmap displaying Z-scores for genes that were induced (top) or inhibited (bottom) by at least 2-fold in comparison to cells maintained without Gln. Conditions are shown above each lane (see STAR methods for detailed description of design). See also Fig. S1–3.
We next performed GSEA on the genes that were induced by the addition of αKG to low IL-2 in comparison to the low IL-2 condition alone. The genes induced by αKG were enriched for pathways associated with effector potential, antigen response, IL-2-STAT5-signaling, and glycolysis, indicating genes in these pathways were sensitive to positive feedback regulation mediated by IL-2-sensitive changes in metabolism (Figure 2C, 2D, S2C)(Goldrath et al., 2004; Luckey et al., 2006). The number of genes induced by αKG in these pathways was approximately 30–50% or more of the genes that were induced in the high IL-2 condition in comparison to low IL-2. Of note, not all genes that were induced by αKG in the low IL-2 condition were expressed to the same magnitude as compared to the high IL-2 condition. In addition, not all pathways, including the cell cycle G2M checkpoint, that were induced by strong IL-2-signaling were also regulated by αKG (Figure 1, 2, S2). There was also some divergence in the identity of the genes with defined effector functions and some variability in the magnitude for the αKG-sensitive induction of genes between CD4+ Th1 and CD8+ Tc1 cells (Figure 1, 2, S2). Taken together, these data suggest that IL-2-sensitive metabolic changes related to αKG play a conserved role in the activation of a subset of genes associated with aspects of the IL-2-sensitive effector T cell differentiation program in type 1 conditions. However, additional events related to the traditional IL-2-signaling pathway are also required for the full induction of this program and aspects of the cell type background influence how αKG-sensitive events are interpreted.
GSEA indicated that genes in the G2M checkpoint pathway were induced by IL-2-sensitve, but not αKG-sensitive, events. Therefore, we next compared the cellular proliferation rates for the CD4+ T cells polarized in Th1 conditions and maintained in high IL-2, low IL-2 or low IL-2 with αKG. Th1 cells maintained in high IL-2 conditions proliferated more robustly than cells maintained in either low IL-2 or low IL-2 with αKG (Figure 2E). Thus, consistent with the gene expression data, αKG-sensitive activities were not sufficient to promote the IL-2-sensitive enhancement of cellular proliferation. Additionally, the size of the cell as measured by forward and side scatter was more similar between high IL-2 and low IL-2 with αKG in comparison to the low IL-2 condition (Figure S3A). Together, these data suggest that αKG-sensitive activities are sufficient to promote the events that lead to an increase in cell size, but this is not translated into more robust proliferative capacity. These data also indicated that the similarities in IL-2-and αKG-sensitive gene expression patterns were not merely caused by similarities in proliferation rates.
Gln- and αKG-sensitive events in part regulate the IL-2-sensitive gene program
Gln can be converted into αKG through the glutaminolysis pathway, which is important for the regulation of αKG-sensitive ES cell differentiation gene programs (Carey et al., 2015). In T cells, Gln transporter expression and glutaminolysis is required to promote aspects of effector T cell functions (MacIver et al., 2013; Nakaya et al., 2014; Pollizzi et al., 2016; Verbist et al., 2016). Together, this led us to ask whether limiting Gln influences the IL-2-sensitive gene programs that are regulated by αKG-sensitive events.
To address this question, we performed experiments limiting Gln activity during CD4+ Th1 cell differentiation and tested the ability of αKG to rescue Gln-sensitive gene expression. As one approach, primary CD4+ T cells polarized in Th1 conditions were maintained in high environmental IL-2 and either left untreated or were treated with the Gln analog 6-diazo-5-oxo-L-norleucine (DON) to inhibit glutaminolysis. As another approach, cells were maintained in the presence or absence of Gln. Both DON treatment and culturing cells in the absence of Gln inhibited the IL-2-sensitive expression of several genes associated with the effector program, including Prdm1, Hlx, and genes in the glycolysis pathway, while it modestly enhanced expression of Tcf7, a gene related to the Tfh or memory program (Figure 2F, S3B, S3C). The addition of αKG to Th1 cells maintained without Gln in high IL-2 conditions, or those treated with DON, rescued the Gln-sensitive expression of these genes (Figure 2F, S3B, S3C).
The gene expression experiments were consistent with previous studies that indicated Gln is important for promoting the T effector (Teff) cell differentiation program at the expense of alternative programs such as the Tfh cell program (Nakaya et al., 2014). To test this concept in vivo, we performed adoptive transfer experiments with CD4+ T cells specific to ovalbumin (CD45.1+OTII) that were treated with DON to inhibit glutaminolysis. Briefly, CD45.1+OTII cells polarized in Th1 conditions in vitro were either left untreated or treated with DON. We then adoptively transferred equivalent numbers of CD45.1+OTII cells from each group into wild-type (CD45.2+)mice. One day later, recipient mice were infected intranasally with an influenza virus expressing the OVA323–339 peptide (PR8-OTII), and the phenotype of the donor CD45.1+CD4+ T cells was determined on day 8 in the lung-draining mediastinal lymph nodes. We found that control and DON-treated CD45.1+OTII cells equivalently expanded in response to infection (Figure 2G). However, the frequencies (Figure 2H) and numbers (Figure 2I) of CD45.1+OTII cells with a Teff-like phenotype (Bcl6loCXCR5loTbethiBlimp1hi) were decreased in the recipient mice of DON treated cells relative to the recipient mice of untreated cells. In contrast, the frequencies (Figure 2J) and numbers (Figure 2K) of CD45.1+OTII cells with a Tfh cell-like phenotype (Bcl6hiCXCR5hiTbetloBlimp1lo) were increased in the mice receiving DON treated cells relative to the untreated cells. These data indicate that glutaminolysis activity at the time of initial polarization events stably influences the differentiation potential of CD4+ T cells in vivo during the course of an influenza infection.
To define the gene program impacted by these activities, we performed an RNA-seq analysis on CD4+ T cells polarizing in Th1 conditions cultured either with or without Gln at the time of initial TCR activation. Following TCR stimulation, the cells were then split and maintained in high IL-2 or low IL-2 concentrations in either the presence or absence of Gln (Figure S1B). Gln mechanistically plays many roles in regulating signaling events, mechanistic target of rapamycin (mTOR), and posttranslational events such as O-GlcNAcylation (Nakaya et al., 2014; Swamy et al., 2016). To focus our analysis on the Gln-sensitive activities that are related to αKG, we also examined cells cultured with or without αKG addition. As another control, we examined by qRT-PCR a subset of genes in the presence of rapamycin (Figure S4G). The RNA-seq analysis identified a subset of approximately 204 genes that were IL-2-, Gln-, and αKG-sensitive, with the vast majority of genes (171) induced by IL-2-, Gln-, and αKG-sensitive events (Figure 2L). Genes with functions more specifically associated with T cell differentiation programming were often stably inhibited throughout the differentiation program when Gln was absent at the time of TCR activation. This suggests a type of epigenetic process that involves Gln- and αKG-sensitive events influences key aspects of the T cell differentiation program. In contrast, the expression of genes in the glycolysis pathway appeared to be more transiently sensitive to Gln and αKG activities, indicating some genes were impacted by the current state of Gln in the environment (Figure 2L).
IL-2- and αKG-sensitive events influence H3K27me3 states in CD4+ Th1 cells
We next wanted to interrogate the mechanisms by which αKG influences the regulation of the IL-2-sensitive gene programs in CD4+ Th1 cells. αKG is a required cofactor for DNA and histone demethylase complexes (Su et al., 2016). We found that genes induced by αKG in CD4+ Th1 and CD8+ Tc1 cells were significantly enriched for pathways related to H3K27me3 and DNA methylation states in diverse cell types (Figure 3A). Genes induced in high IL-2 relative to low IL-2 conditions were also highly enriched in the same pathway datasets. These pathway analyses allude to a role for αKG in regulating the IL-2-sensitive differentiation program through alteration of H3K27me3 and DNA methylation states.
Figure 3. IL-2 and αKG-sensitive events are related to H3K27me3 and DNA methylation states.

(A) GSEA of select chemical and genetic perturbations datasets examining genes induced in the low IL-2 with αKG compared to the low IL-2 condition in CD4+ Th1 (light grey) or CD8+ Tc1 (dark grey) cells. (B) Histograms representing differential H3K27me3 ChIP-seq peak read depth enrichment between high IL-2 compared to low IL-2 conditions (left) or low IL-2 with αKG relative to low IL-2 conditions (right). The distribution of the log ratio of peak read enrichment is displayed. (C, D) qRT-PCR analysis of transcripts from primary CD4+ Th1 cells exposed to (C) high IL-2 (black bars), low IL-2 (white bars), high IL-2 with DON (light grey bars) or high IL-2 with GSK-J4 (dark grey bars) or (D) high IL-2 (black bars), low IL-2 (white bars), low IL-2 with αKG (dark grey bars), or low IL-2 with 5-azacytidine (light grey bars). (C, D) The n= at least (C) 4 except high IL-2 with DON n= 3 or (D) 3 independent biological replicates for each gene. Error bars represent SEM and an unpaired student t-test was performed with p values indicated (* ≤0.05, **≤0.001, and ***≤0.0001). See also Fig. S3.
To start to address this possibility, we performed a chromatin immunoprecipitation-sequencing (ChIP-seq) analysis examining H3K27me3 states in CD4+ Th1 cells maintained in high IL-2, low IL-2, or low IL-2 with αKG. There was a modest global decrease in H3K27me3 ChIP enrichment throughout the genome in the high IL-2 compared to low IL-2 conditions suggesting that events downstream of IL-2-signaling generally favor lower H3K27me3 levels (Figure 3B). The addition of αKG to the low IL-2 condition caused a global decrease in H3K27me3 ChIP enrichment that was modestly more robust than the decrease observed in the high IL-2 condition (Figure 3B). Previous studies have shown a role for Jmjd3, an H3K27me3-demethylase, in T cell and Th1 differentiation states (Manna et al., 2015; Miller et al., 2008). Thus, these data suggest that the IL-2-sensitive changes in H3K27me3 might be functionally regulated by αKG-sensitive events impacting H3K27me3-demethylase activity.
To address this, we performed experiments limiting H3K27me3-demethylase activity in high IL-2 conditions. Primary CD4+ T cells polarized in Th1 conditions were maintained in high IL-2 concentrations either with or without GSK-J4, an H3K27-demethylase inhibitor. For comparison, cells were maintained in low IL-2 concentrations or high IL-2 with DON to limit αKG activity. For these experiments, we examined the expression of IL-2- and αKG-sensitive genes that were associated with strong decreases in αKG-sensitive H3K27me3 peaks. Genes analyzed with this criteria, including Prdm1 and P4ha2, were inhibited by the addition of GSK-J4 to the high IL-2 condition (Figure 3C, S3D). As a negative control, Hlx, a gene that was induced by IL-2- and αKG-sensitive activities, but was not associated with αKG-sensitive H3K27me3 peaks in the ChIP-seq analysis, was not impacted by GSK-J4 (Figure 3C). These data suggest that the role for αKG as a cofactor in H3K27-demethylase complex activity is important for a subset of IL-2 and αKG-sensitive target gene expression.
DNA methylation states play a role in IL-2- and αKG-sensitive gene expression
We next wanted to assess whether the state of DNA methylation might contribute to the expression of the IL-2-sensitive genes that are also sensitive to αKG. To begin to address this question, we examined the role for TET2, a DNA-demethylase that requires αKG as a cofactor for its activity, in regulating IL-2-and αKG-sensitive genes. We transfected primary CD4+ T cells polarized in Th1 conditions with either a control small interfering RNA (siRNA) or an siRNA to Tet2 and maintained the cells in high environmental IL-2 concentrations. The qRT-PCR analyses demonstrated that several IL-2- and αKG-sensitive target genes had decreased expression with Tet2 knockdown (Figure S3E). To further address whether genes with IL-2- and αKG-sensitive expression might be influenced by DNA methylation states, we utilized the DNA methyltransferase inhibitor 5-azacytidine (5-aza) to inhibit DNA methylation events. CD4+ Th1 cells maintained in low IL-2 concentrations were either left untreated or were treated with 5-aza. In the qRT-PCR analyses, IL-2- and αKG-sensitive genes, including Hk2, Ifng and Hlx, were induced by 5-aza treatment to a similar extent as αKG treatment (Figure 3D). The inhibition of DNA methylation diminished the expression of genes such as Klf2 and Sell (encodes CD62L) to a similar extent as αKG inhibited their expression. It is also worth noting that αKG-sensitive genes such as Tcf7 were not affected by DNA-methylation inhibitor treatment (Figure 3D). These data suggest that DNA methylation states play a context-dependent role in regulating the expression of a subset of IL-2- and αKG-sensitive genes.
A subset of CTCF sites is sensitive to IL-2 and αKG
The mechanisms that enable metabolic programs, which can influence broad changes in DNA and histone methylation states, to be translated into context-dependent gene programs are still being elucidated. CTCF has the capacity to influence the organization of the genome and plays a role in regulating developmental programs (Bonora et al., 2014). Although many CTCF sites are constitutively occupied in diverse cell types, a subset of CTCF sites are occupied in a context- or cell-type sensitive manner in part related to the DNA methylation status of select CTCF sites in different cellular backgrounds (Fang et al., 2015; Ong and Corces, 2014). A recent study found there was reduced association of CTCF with a subset of sites in glioma cells, which contained mutations in IDH that enhance 2-hydroxyglutarate (2HG) production (Flavahan et al., 2016). 2HG competitively inhibits αKG-dependent activities and a recent study found that 2HG promotes the development of CD8+ memory T cells at the expense of effector cell differentiation (Tyrakis et al., 2016). Taken together with our results, this leads to the hypothesis that αKG-sensitive metabolic states might influence CTCF activity to translate changes in IL-2-sensitive metabolism into new potentials for differentiation gene programs in T cells.
To begin to address this hypothesis, we performed a CTCF ChIP-seq analysis on CD4+ Th1 cells maintained in high IL-2, low IL-2, or low IL-2 with αKG to define the sites associated with CTCF in each condition. We first performed a clustering analysis of rank correlations using CTCF read depth across all identified binding sites to assess the relationship between the genomic localization of CTCF in each condition. CD4+ Th1 cells maintained in low IL-2 with αKG clustered more closely with the CD4+ Th1 cells in high IL-2 as compared to the low IL-2 condition (Figure 4A). These data indicated that CTCF association with genomic regions was more similar in cells maintained in high IL-2 and low IL-2 with αKG as compared to cells in the low IL-2 condition.
Figure 4. IL-2- and αKG-sensitive events impact CTCF.

(A) A heatmap representing genome-wide CTCF enriched ChIP-seq peaks from biological replicates of primary CD4+ T cells polarized in Th1 conditions that were exposed to high environmental IL-2, low IL-2, or low IL-2 with αKG conditions for two days. (B) Histograms representing differential CTCF ChIP-seq peak read depth enrichment between high IL-2 compared to low IL-2 conditions (left) or low IL-2 with αKG relative to low IL-2 conditions (right). The distribution of the log ratio of peak read enrichment is displayed. (C) CTCF-ChIP-seq tracks from two biological replicates of CD4+ Th1 cells exposed to high IL-2, low IL-2, or low IL-2 with αKG displayed with the UCSC genome browser. Differential CTCF peaks are highlighted with a blue arrow. (D, E) qRT-PCR analysis of transcripts from primary CD4+ T cells polarized in Th1 conditions and transfected with a control siRNA to GFP (black bar), (D) an siRNA to Ctcf (grey bar) or (E) an siRNA to Rad21 (dark grey bar). The control GFP siRNA is the same for Figure S3E and 4D. The n= at least 3 independent biological replicates for each gene. Error bars represent SEM and an unpaired student t-test was performed with p values indicated (* ≤0.05, **≤0.001, and ***≤0.0001). See also Fig. S4–7.
We next performed a differential peak analysis comparing CTCF peaks in the Th1 cells maintained in either high IL-2 compared to the low IL-2 condition or low IL-2 with αKG compared to low IL-2. The vast majority of CTCF peaks from the ChIP-seq analysis were similarly enriched when comparing either high IL-2 relative to the low IL-2, or low IL-2 with αKG relative to the low IL-2 condition in Th1 cells. However, a subset of peaks, approximately 10%, displayed differential CTCF enrichment. There was a general increase in the frequency of peaks that had enhanced CTCF association in Th1 cells maintained in either high IL-2 or low IL-2 with αKG when compared relative to the low IL-2 condition (Figure 4B). These data suggest that IL-2- and αKG-sensitive events promote the association of CTCF with select sites across the genome.
A subset of αKG-sensitive genes is associated with αKG-sensitive CTCF sites
We next wanted to assess whether genes with αKG-sensitive expression in the RNA-seq analyses also had αKG-sensitive CTCF peaks in their vicinity. Approximately 40% of the genes with αKG-inducible gene expression were associated with αKG-inducible CTCF peaks in their proximity. Some examples of the αKG-inducible genes with αKG-sensitive CTCF peaks are shown in Figure 4C and S4A (also see Figures 5, 6A, 7, S4–7). αKG-inducible peaks were distributed across many different locations relative to the gene, including at distal sites upstream and downstream of the gene as well as in the promoter region. αKG-inducible CTCF peaks were often similarly induced in the high IL-2 condition (Figure 4C, 5, 6A, 7, S4–7).
Figure 5. IL-2- and αKG-sensitive CTCF association correlates with changes in genomic organization.

(A–D) In situ Hi-C or CTCF ChIP-seq experiments were performed with primary CD4+ T cells polarized in Th1 conditions and maintained in high IL-2, low IL-2, or low IL-2 with αKG for two days. (A,B) UCSC genome browser tracks displaying a Hi-C (A) PC1 analysis to define transcriptionally permissive (PC1 positive; black) versus inert/or transcriptionally repressive (PC1 negative; grey) genomic compartments, (B) an analysis of outer TAD boundaries and (A,B) ChIP-seq CTCF tracks as described in 4C. (C, D) Circos plots for genomic regions surrounding Hlx (Chr1:184,000,000–187,200,000) and Cxcr4 (Chr1:128,800,000–131,040,000) indicating the probability for genomic interactions from the in situ Hi-C analysis. The minimum probability of interaction shown is a p value of ≤0.0001 with the increased weight of a line indicating a higher significance for the interaction (lower p value). (E) UCSC genome browser tracks displaying CTCF ChIP-seq from Th1 cells exposed to high IL-2, low IL-2, or low IL-2 with αKG, and an ATAC-seq analysis of NP-specific CD8+ T cells isolated 9 days after influenza infection that were sorted into CD25hi or CD25lo populations. Regions displayed were associated with the interaction loops identified in the circos plots in (C, D). Blue arrows indicate IL-2- and αKG-sensitive CTCF sites and yellow arrows indicate ATAC-seq changes. See also Fig. S4–6.
Figure 6. IL-2- and αKG-sensitive events inhibit DNA methylation within CTCF peaks found in proximity to Hk2 and Sell.

(A) CTCF-ChIP-seq tracks from two biological replicates of CD4+ Th1 cells exposed to high IL-2, low IL-2, or low IL-2 with αKG displayed with the UCSC genome browser. The differential CTCF peaks analyzed in (B) and (C) are highlighted with a blue arrow above each track. (B, C) Bisulfite sequencing analysis of DNA from primary CD4+ T cells polarized in Th1 conditions and maintained in high IL-2, low IL-2, or low IL-2 with αKG for two days. The CpG sites within IL-2- and αKG-sensitive CTCF peaks in proximity to (B) Hk2 and (C) Sell as indicated in (A) were monitored. Open circles represent the average of clones with no methylation whereas closed circles represent the average of methylated clones for an experiment. Results are representative of two independent biological replicates (see also Fig. S4E).
Figure 7. A subset of genes with αKG-sensitive CTCF peaks have αKG-inducible gene expression in ES cells.

(A, B) UCSC genome browser tracks representing Hi-C PC1 analysis, CTCF ChIP-seq, or H3K27Ac ChIP-seq peaks for CD4+ Th1 cells exposed to high IL-2, low IL-2, or low IL-2 with αKG. Displayed are regions surrounding the (A) Pdgfra gene or (B) genes from differentiation pathways associated with ES and T cells. (C) Graphs representing the FPKM values from the RNA-seq analyses of CD4+ Th1 cells, E14Tg2a cells, and CD8+ Tc1 cells with 3, 4, and 4 independent biological replicates respectively. See also Fig. S7.
We next wanted to determine if CTCF plays a functional role in the expression of the genes that are located in proximity to IL-2- and αKG-sensitive CTCF peaks. To address this, we transfected primary CD4+ or CD8+ T cells polarizing in type 1 conditions with a control siRNA or an siRNA to Ctcf and maintained the cells in high IL-2. Reducing Ctcf mRNA using siRNAs caused a decrease in the expression of IL-2- and αKG-sensitive target genes as monitored by qRT-PCR (Figure 4D, S4B, S4C). In addition, we performed complementary experiments with an siRNA to Rad21, a member of the cohesin complex, which along with CTCF is important for chromatin loop formation. Reducing Rad21 expression using siRNAs also inhibited the expression of IL-2- and αKG-sensitive target genes (Figure 4E, S4D). These data suggest that CTCF complexes involved in genome organization play a role in the functional regulation of IL-2- and αKG-sensitive target gene expression.
IL-2- and αKG-sensitive CTCF binding events correlate with changes in genome organization
Collectively, the ChIP-seq and siRNA data led to the hypothesis that IL-2- and αKG-sensitive CTCF binding events might influence genome organization. To address this, we performed an in situ Hi-C analysis on CD4+ Th1 cells maintained in high IL-2, low IL-2, or low IL-2 with αKG. After generating genomic contact matrices, we first performed a PC1 analysis to assess the composition of the open PC1 positive (permissive and/or transcriptionally active) and closed PC1 negative (inert and/or repressive) regions across the genome. We observed genomic regions that were differentially localized within open versus inert chromatin regions in an IL-2- and αKG-sensitive manner (Figure 5A, S5A). For example, approximately 60 kb upstream and downstream of Lilrb4 was contained in an open configuration in primary Th1 cells maintained in either high IL-2 or low IL-2 with αKG conditions, whereas the region surrounding Lilrb4 was in an inert or closed configuration in the low IL-2 condition (Figure 5A). There were IL-2- and αKG-sensitive CTCF sites flanking the boundaries delineating this change (Figure 5A), and the expression of Lilrb4 was induced by IL-2-, Gln-, and αKG-sensitive events in Th1 cells (Figure 2L).
We also performed an analysis of the in situ Hi-C data to define the outer topological associated domain (TAD) boundaries. Changes in the organization of outer TAD boundaries were identified by IL-2-and αKG-sensitive CTCF sites in proximity to genes with IL-2- and αKG-sensitive expression. Examples included regions in proximity to Hk2 and Slc2a1, which were enhanced by IL-2- and αKG-sensitive events, and Cxcr3, which was inhibited by IL-2- and αKG-sensitive events (Figure 5B, S5B). We also conducted an analysis of the in situ Hi-C data to determine the directionality index (DI) for genomic regions (Dixon et al., 2012). A positive DI value indicates a bias for downstream interactions whereas a negative DI value represents an interaction bias for upstream regions. In proximity to genes such as Hk2, Sell and Slc2a1, the DI indicated that the interactions were predominantly in the same orientation (i.e. upstream or downstream) in Th1 cells maintained in high IL-2, low IL-2, or low IL-2 with αKG. However, the boundary changed or the strength of interaction bias was increased in the high IL-2 condition, and low IL-2 with αKG, in comparison to the low IL-2 condition (Figure S5, S4F). In addition, we observed several regions, including in proximity to Cxcr3, that showed similar DI configurations in the Th1 cells maintained in either high IL-2 concentrations or low IL-2 with αKG, whereas the region had an opposing directionality index in the low IL-2 condition (Figure S5). Overall, roughly half of the genes that were induced by IL-2-, Gln-, and αKG-sensitive events were found in proximity to changes in chromatin topology.
Genomic interactions are sensitive to IL-2 and αKG events
We also performed interaction analyses to generate circos plots for genomic intervals surrounding select genes with IL-2- and αKG-sensitive expression to define the probabilities for interactions between specific genomic regions. The interaction analysis identified two pairs of genomic regions surrounding Hlx with a greater probability for the interaction in the high IL-2, and low IL-2 with αKG conditions as compared to the low IL-2 condition (Figure 5C). The interaction analysis also identified an enrichment of significant interactions (i.e. more interactions) in the genomic regions surrounding Hlx (Figure 5C). There were both IL-2- and αKG-sensitive changes in the probabilities for interactions and/or enrichment of significant interactions in the genomic regions by Cxcr4 and Prdm1 as well (Figure 5D, S6A). IL-2- and αKG-sensitive CTCF sites were often located in proximity to the genomic locations with increased probabilities of interactions (Figure 5E, S6C).
We next wanted to test the hypothesis that the genomic regions with increased probabilities of IL-2- and αKG-sensitive interactions might contain regulatory elements inside the interaction regions that were responsive to IL-2. In addition, we wanted to perform this analysis with T cells that were generated during a type 1 immune response in vivo to extend the mechanistic interpretations to T cells differentiating in their natural environment. To accomplish this, we performed assay for transposase-accessible chromatin-sequencing (ATAC-seq) experiments to define chromatin accessibility in antigen specific CD8+ T cells generated during the course of an influenza infection in mice. We sorted tetramer positive influenza nucleoprotein (NP) antigen specific CD8+ T cells into CD25hi and CD25lo populations. CD25 is induced on activated T cells and is a component of the high affinity IL-2-receptor complex. This means that CD25hi cells receive stronger IL-2 signals as compared to the CD25lo population. We performed this analysis with CD8+ T cells to exclude confounding issues with CD4+ T cells, where the CD25hi population includes regulatory T cells in addition to Th1 cells.
The mechanistic prediction for these experiments was that the genomic interactions enhanced by IL-2-sensitive events would contain IL-2-sensitive regulatory elements (as monitored by differential chromatin accessibility) in CD25hi relative to CD25lo antigen specific T cells. To examine this, we monitored ATAC-seq peaks found between CTCF sites and within the regions that were identified in the interaction analyses to have increased probabilities of IL-2- and αKG-sensitive interactions. We observed several examples in which there were regions with changes in accessibility in the CD25hi compared to CD25lo antigen specific CD8+ T cells located within the IL-2- and αKG-sensitive interaction regions identified in the circos plots. These included regions adjacent to Hlx, Cxcr4, and Prdm1 (Figure 5E, S6C). In addition, there were ATAC-seq accessibility changes in the CD25hi compared to CD25lo antigen specific CD8+ T cells in regions distant to Cxcr4, Prdm1, and Plk2 associated with enhanced IL-2- and αKG-sensitive interactions identified in the circos plots (Figure S5C, S6).
IL-2- and αKG-sensitive changes in DNA methylation at CTCF peaks in proximity to Hk2 and Sell
We next wanted to address whether IL-2- and αKG-sensitive modulation of CTCF association might relate to αKG-sensitive changes in DNA methylation. To start to test the role for DNA methylation in IL-2-and αKG-sensitive CTCF association, we performed bisulfite-sequencing experiments to monitor the methylation status of DNA sequences contained within the IL-2- and αKG-sensitive CTCF ChIP-seq enriched peaks. We monitored CTCF peaks that were associated with Hk2 and Sell, genes that were positively or negatively regulated by αKG-sensitive activities, respectively (Figure 6A, 1A, S2A, S2B). CpG sites within the IL-2- and αKG-sensitive CTCF enriched peaks found in proximity to Hk2 and Sell had less methylation in Th1 cells maintained in both high IL-2 or low IL-2 with αKG conditions in comparison to the low IL-2 condition (Figure 6B, 6C, S4E). Mechanistically consistent with our findings, a previous study showed that regions upstream of Sell reciprocally had enhanced methylation in 2HG treated T cells (Tyrakis et al., 2016). The IL-2- and αKG-sensitive decrease in DNA methylation correlated with IL-2- and αKG-sensitive enhanced CTCF association as well as alterations in genome organization in proximity to these regions (Figure 6A, S4F, S5A). As noted above, inhibiting DNA methylation in primary CD4+ Th1 cells in low IL-2 conditions promoted Hk2 expression while it inhibited Sell expression (Figure 3D).
It is important to note that CpG sites associated with IL-2- and αKG-sensitive CTCF peaks were also found in regions with little methylation present in primary Th1 cells, or no differential methylation. This indicates that DNA methylation cannot be the only mechanism for IL-2- and αKG-sensitive targeting of CTCF. Further research will be necessary to define other αKG-sensitive mechanisms that contribute to modulating CTCF association with select sites in the genome. Taken together, the data suggest that IL-2- and αKG-sensitive inhibition of DNA methylation promotes the IL-2- and αKG-sensitive association of CTCF with a subset of genomic regions and this correlates with changes in genomic topology. The IL-2- and αKG-sensitive events can be interpreted in a context-dependent manner as exemplified by the enhanced or diminished expression of Hk2 and Sell, respectively.
Context-dependent role for αKG-sensitive CTCF association
In IDH mutant gliomas that overproduce 2HG, a competitive inhibitor of αKG, there was hypermethylation at select CTCF sites that inhibited the binding of CTCF, including at a site contained within an insulator element that is upstream of the PDGFRA oncogene (Flavahan et al., 2016). In Th1 cells, we observed αKG-sensitive association of CTCF with several sites surrounding the Pdgfra locus, and this correlated with an adjacent αKG-sensitive change in genome organization (Figure 7A). Upon closer inspection of the identity of the genes in proximity to the IL-2- and αKG-sensitive CTCF peaks in Th1 cells, we further observed that many peaks were associated with genes expressed early in development, often in ES cells (Figure 7B, S7A). This included CTCF sites within the HoxA locus and adjacent to Barx2 (Figure 7B, S7A). In addition, there was an IL-2- and αKG-sensitive CTCF site associated with the Il17 locus (Figure 7B). Despite the αKG-sensitive induction of the CTCF peaks associated with the genes in these divergent developmental pathways, many of these genes were not expressed, or only lowly expressed, in Th1 cells.
Enhancer landscapes have been shown to be critical for defining both normal and pathogenic T cell differentiation programs (Vahedi et al., 2015; Vahedi et al., 2012). In order for changes in CTCF binding events that influence genome organization to exert a functional outcome on gene expression, an active enhancer landscape would need to be present in that region. This creates a scenario where metabolically regulated changes in CTCF association and genome interactions might be interpreted in a cell-type or context-dependent manner depending upon the enhancer landscape present. To start to address this hypothesis, we performed an H3K27Ac ChIP-seq analysis in Th1 cells maintained in high IL-2, low IL-2, or low IL-2 with αKG to examine potential enhancer regions in each condition. The IL-2- and αKG-sensitive effector genes in Th1 cells tended to contain regions of H3K27Ac in proximity to the genes that were actively expressed (Figure 7B, S7B). In some cases, the regions of H3K27Ac were both IL-2- and αKG-sensitive, whereas other regions of H3K27Ac were IL-2-sensitive, but not sensitive to αKG. In contrast, the genes from the divergent developmental pathways that were associated with αKG-sensitive CTCF peaks, but were not expressed in Th1 cells, tended to lack robust H3K27Ac in the regions surrounding the genes (Figure 7B, S7A).
A subset of genes associated with αKG-sensitive CTCF sites is αKG-sensitive in ES cells
This led us to ask whether the expression of a subset of genes associated with αKG-sensitive CTCF peaks might be induced by αKG in the context of a cell type where the genes are naturally expressed and presumably active enhancers are present. To address this, we performed qRT-PCR and RNA-seq analyses in the mouse ES cell line E14Tg2a that were either left untreated or exposed to αKG. Consistent with previous results in ES cells, Klf2 and Esrrb were downregulated by the addition of αKG, while Asz1 was upregulated as analyzed by qRT-PCR (data not shown)(Carey et al., 2015). In the RNA-seq analysis approximately one third of the genes that were αKG-inducible in ES cells were associated with an αKG-inducible CTCF peak in Th1 cells. For example, the expression of Barx2, Pkp2, and several genes in the HoxA locus were induced by the addition of αKG to the ES cell line (Figure 7C and data not shown). The RNA-seq analyses also identified a subset of genes that were αKG-sensitive in CD4+ Th1, CD8+ Tc1 and ES cells (Figure 7C, S7C). When comparing the αKG treatment to the untreated state in the different cell types, the relative fold induction for the genes was often similar between CD4+ Th1, CD8+ Tc1 and ES cells (Figure 7C, S7C). However, the absolute level of gene expression varied greatly between the T cells and ES cells. Collectively, the data are suggestive that αKG-sensitive metabolic events promote an initial mechanistic step, including enhancing CTCF binding at select sites, which is subsequently translated into consequences on gene expression in a context-dependent manner.
Discussion
In this study, we identified a connection between IL-2- and αKG-sensitive metabolic states with CTCF binding dynamics, genome organization, and gene programming events in CD4+ Th1 cells. The data suggested that αKG-sensitive metabolic events are integrated by selective changes in CTCF genomic distribution, but this is interpreted in a context-dependent manner, which in part is influenced by the enhancer landscape in the cell. The finding that there is a connection between metabolites and CTCF association at select sites could help to explain how changes in metabolites that impact basic epigenetic processes might contribute to more specific gene programming events. The observation that only a small fraction of CTCF sites display differential binding in response to αKG-induced metabolic changes creates the potential to focus general metabolic programming perturbations onto specific regions of the genome. Of note, because the interpretation of chromosomal organization events mediated by CTCF are directly influenced by both the epigenetic landscape and activities of the regulatory domains in the cell, the αKG-sensitive changes in CTCF association and genome organization will become context-dependent. This provides a potential mechanistic interpretation for why each cell type did not have to evolve a novel way to interpret similar metabolic changes that occur during developmental transition states. It also might provide an explanation for how metabolic changes can both positively or negatively influence opposing gene programs in the same cell type.
A recent study found that 2HG is important for the formation of memory T cells in vivo (Tyrakis et al., 2016). 2HG is a competitive inhibitor of αKG, and predictable for this antagonistic metabolite pair, our experiments uncovered a role for αKG in promoting effector-associated gene expression and inhibiting memory- or Tfh-associated gene expression. Taken together, these independent and complementary studies indicate that the αKG-2HG metabolic axis is important for T cell differentiation. Future studies will need to define whether 2HG also antagonizes CTCF association with the genome in T cells, which would be predicted based upon the findings presented here and studies in glioma cells (Flavahan et al., 2016). It will also be interesting to define whether disease states that overproduce 2HG and secrete it into the extracellular environment, such as in gliomas and AML with mutations in IDH, impact T cell function through modulating genome organization.
One area of caution in suggesting a direct connection between αKG-mediated events, such as DNA and histone demethylation, and the regulation of CTCF association, is that metabolic pathways are interconnected, making it difficult to definitively connect the change in the level of one metabolite with a specific downstream event. To mitigate the technical limitations of interpreting data associated with the addition of cell-permeable αKG to cells, we also performed experiments to limit Gln, which is one pathway that naturally produces intracellular αKG. Previous studies, as well as the data presented here, have shown that Gln is involved in effector T cell differentiation (Johnson et al., 2016; Nakaya et al., 2014; Wang et al., 2011). This is at least in part because it regulates mTOR activity, which is involved in the regulation of a diverse set of genes (Finlay and Cantrell, 2011; Johnson et al., 2016; Nakaya et al., 2014). In our study, the reciprocal activities associated with limiting Gln and rescuing activities with αKG were able to focus the analysis on the target genes that are the most likely to be naturally regulated by Gln- and αKG-sensitive activities. This allowed us to define a role for αKG-sensitive events in the role for Gln in T cell programming. However, because other metabolite activities are influenced by the glutaminolysis pathway as well, to be cautious in the interpretation of the data, we propose that the data are consistent with the interpretation that either αKG-dependent events, or events that are related to changes in αKG-sensitive metabolic programs, influence CTCF association with a subset of sites surrounding genes involved in cellular differentiation programs.
The data suggest that αKG activity in the context of TET enzymes plays a direct role in regulating IL-2- and αKG-sensitive CTCF association at a subset of sites. However, not all CTCF sites had differential methylation. Therefore, other activities must also play a role in targeting CTCF to a subset of genes. One possibility could be related to mTOR and hypoxia inducible factor 1 (HIF1) activities, and we observed an enrichment of genes in mTOR and HIF1-related pathways in the αKG-induced genes. However, we found that αKG was still able to induce or inhibit the expression of select IL-2- and αKG-sensitive genes in the presence of rapamycin, an mTOR inhibitor. Although this qRT-PCR analysis was not exhaustive, these data suggest that αKG-sensitive events are independent of mTOR in at least some circumstances. Further research is needed to address possible roles for other pathways to more comprehensively define the αKG-sensitive metabolic changes that are required for influencing CTCF binding. It will also be important to define other αKG-sensitive mechanistic steps that are independent of CTCF that regulate aspects of the IL-2-sensitive gene expression program.
IL-2 plays an important role in influencing T cell differentiation decisions and the strength of IL-2- signaling impacts this selection process (Liao et al., 2013; Mitra et al., 2015; Spangler et al., 2015). Our study now defined that metabolic changes sensitive to environmental IL-2 concentrations play a feed-forward role in influencing select aspects of differentiation programs in CD4+ Th1 and CD8+ Tc1 cells. In addition, we observed that IL-2-signaling enhanced the expression of some genes that encode the enzymes and transporters associated with the glutaminolysis pathway, and we speculate that this can serve in a positive feedback manner to promote the accumulation of metabolites, such as αKG. It is important to note that αKG-sensitive events only regulate a portion of the IL-2-sensitive program and additional IL-2-sensitive events are often needed for full induction of gene expression. Therefore, taken together with the current data in the field, our study suggests that in addition to the role for IL-2 in regulating STAT proteins and other signaling pathways (Liao et al., 2013), the ability of IL-2 to select metabolic states also influences its gene programming potential. Collectively, the findings now provide mechanistic links between TCR- and IL-2-sensitive metabolic state selection in T cells to gene programming decisions.
STAR Methods
CONTACT FOR REAGENT AND REAGENT SHARING
Further information and requests for resources and reagents should be directed to and will be fulfilled by the lead contact, Amy Weinmann (weinmann@uab.edu)
EXPERIMENTAL MODEL AND SUBJECT DETAILS
All of the primary CD4+ or CD8+ T cells used for experiments were isolated from the spleen and lymph nodes of at least 6 week old C57BL/6 mice both male and female. All of the samples used for the NGS experiments were done on primary cells from male C57BL/6 mice, or C57BL/6 OTI mice. For the OTII experiments C57BL/6 (B6), B6.SJL-Ptprca Pepcb/BoyJ (CD45.1+ B6 congenics), and C57BL/6.OTII (OTII) were originally obtained from Jackson Laboratories. OTII mice were crossed to B6.SJL-Ptprca Pepcb/BoyJ mice to B6.CD45.1+ OTII mice. C57BL/6 mice used for the OTII transfer experiments were directly ordered from Jackson laboratory and used at least a week after arriving to the University of Alabama at Birmingham (UAB) animal facility. All other mice were bred in the UAB animal facility. All experimental procedures involving animals were approved by the UAB Institutional Animal Care and Use Committee and were performed according to guidelines outlined by the National Research Council. The cell line E14TG2a is a male mus musculus embryonic stem cell line that is derived from blastocysts.
METHOD DETAILS
Primary cell isolation and cell culture
Primary CD4+ or CD8+ T cells were isolated from the spleen and lymph nodes of at least 6 week old C57BL/6 mice using negative selection MagCellect kits (R&D systems) as described in previous publications (Oestreich et al., 2012; Oestreich et al., 2014). Cells were stimulated with plate-bound anti- CD3 (clone 145-2C11, 5µg/mL) and anti-CD28 (clone 37.51, 10µg/mL) and polarized in type 1 conditions (anti-IL4 (clone 11B11, 10µg/mL) and IL-12 (R&D catalog number 419ML-010, 5ng/mL)). At day 3, cells were split and cultured for two days in the presence of either high IL-2 (100units/mL), high IL-2 with DON (6-Diazo-5-oxo-L-norleucine Sigma, D2141, 0.5ug/mL), high IL-2 with GSK-J4 (Millipore, histone lysine demethylase inhibitor VIII GSK-J4 CAS 1373423-53-0, 5µM), low IL-2 (2.5units/mL), low IL-2 with cell permeable αKG (dimethyl-alpha-ketoglutarate, Sigma 349631, 4mM), low IL-2 with cell permeable succinate (dimethyl-succinate, Sigma W239607, 4mM), low IL-2 with 5-azacytidine (Sigma, A1287, 5uM), low IL-2 with rapamycin (EMD Millipore; 553211, 200nM), or low IL-2 with rapamycin and cell permeable αKG. Working concentrations of cell permeable αKG and succinate used in cell culture were determined from a published study (Carey et al., 2015). Experiments with mice were performed with approval from the University of Alabama at Birmingham IACUC.
For the experiments to define the role for glutamine in the IL-2-senstive programming of Th1 cells, primary CD4+ T cells were isolated and stimulated with plate bound αCD3 (5µg/mL) and αCD28 (10µg/mL) in either IMDM (Life Technologies) or RPMI without glutamine (Life Technologies) media in type 1 polarizing conditions. At day three, the cells were split into RPMI media either with or without glutamine (Life Technologies) and maintained in high IL-2, high IL-2 with αKG (4mM), low IL-2, or low IL-2 with αKG (4mM) for two days. IMDM or RPMI medias contained 10% FBS (Life Technologies), 1% Penicillin/Streptomycin (Life Technologies), and 50 µM 2-mercaptoethanol (Sigma).
The ES cell line E14TG2a (generously supplied by Hao Jiang (UAB)) was maintained in DMEM knockout media (Life Tecnhologies) with 15% ES cell certified FBS (Omega Scientific), 0.1mM non-essential amino acids (Life Technologies), 2mM glutamine (Life Technologies), 0.1mM 2-mercaptoethanol (Sigma), and 1000units/mL of recombinant LIF (Biolegend) grown on 0.1% gelatin (Millipore) coated plates. For experiments, the cells were exposed to this media without glutamine and either left untreated or treated with cell permeable αKG for two days as previously described (Carey et al., 2015).
Quantitative RT-PCR
RNA was isolated from the cells using the Nucleospin RNA kit (Clontech). cDNA was made using the PrimeScript first strand cDNA synthesis kit (Clontech). An equal amount of cDNA was amplified with the iQSybr Green Mix (Biorad) using gene specific primers. See quantification and statistical analysis section for details on data analysis.
RNA-sequencing (RNA-seq) and analysis
At least 2 (CD4+ T cells without glutamine at time of TCR activation), 3 (all other CD4+ Th1 cells) or 4 (CD8+ Tc1 cells and ES cells) independent biological replicate experiments for each condition were analyzed with RNA-seq. Library preparation and RNA sequencing was conducted through Genewiz. Libraries were sequenced using a 1×50bp single end rapid run on the HiSeq2500 platform. The analysis of the RNA-seq data was performed using the Penn State Galaxy publicly available server using the Tuxedo suite analysis tools. Fastq files were first aligned to the mm10 reference genome using Tophat (Kim et al., 2013). Cufflinks, Cuffmerge, Cuffquant, and Cuffnorm were performed to define FPKM values for genes (Trapnell et al., 2010). Differential gene expression was determined using Cuffdiff (Trapnell et al., 2010). For the Venn Diagrams, proportional graphical representations were made with the BioVenn program (Hulsen et al., 2008). All statistically significant genes with at least a 2-fold change and FPKM value of 1 or greater in at least one condition were included in differential gene analyses. For Figure 2L, genes were initially identified in a CuffDiff analysis based upon statistically significant differences with at least a 2-fold change between the Th1 cells continuously maintained with glutamine in high IL-2 compared to Th1 cells continuously maintained without glutamine in high IL-2. The genes also have at least a 2-fold change in the Th1 cells continuously maintained with glutamine in the high IL-2 versus the low IL-2 comparison, and the low IL-2 with αKG versus the low IL-2 comparison. Heatmaps were generated using the gplots package (version 3.0.1) into R version 3.3.1. The final six genes displayed in the heatmap for the inhibited genes used a fold change cutoff of 1.8.
Gene Set Enrichment Analysis (GSEA)
GSEA was performed using the Molecular Signatures Database on the publicly available MIT BROAD Institute server (Subramanian et al., 2005). The genes analyzed by GSEA were generated from the Cuffdiff analysis of the RNA-seq experiments from CD4+ Th1 cells, CD8+ Tc1 cells, or ES cells. The differential expressed gene datasets used were derived from the genes identified as statistically significant in the Cuffdiff analysis that also had at least a 2-fold change and an FPKM expression value of 1 in at least one of the conditions.
Proliferation Assay
Upon isolation, 2.5×10⁶ primary CD4+ T cells were labeled with cell proliferation dye 450 (eBiosciences). Briefly cells were washed two times with PBS (Life Technologies) and stained in 1× dye in a 2.0 × 10⁷ concentration for 20 minutes at room temperature in the dark. The reaction was quenched by adding 5× IMDM media (Life Technologies), and incubated on ice for 5 min in the dark. Cells were washed twice with media, and plated at a concentration of 0.6×10⁶ cells and cultured as described above for activation and polarization. On day 3, cells were split and cultured as described above. On day 5, 1×10⁶ cells were additionally stained with CD4 (GK1.5, Biolgend) and analyzed by flow cytometry.
Transfection of primary CD4+ Th1 or CD8+ Tc1 cells
Primary CD4+ or CD8+ T cells were isolated from C57BL/6 mice and stimulated on plates coated with αCD3 (5µg/mL) and αCD28 (10µg/mL). On day 1 after isolation, the IMDM media was removed and replaced with Accell siRNA delivery media (Dharmacon GE) containing 100µM (Rad21) or 200µM (Ctcf and Tet2) siRNA or a control siRNA (eGFP). The siRNAs used in this study were for murine Ctcf (13018), Rad21 (19357), Tet2 (214133) or to eGFP as a control (Dharmacon GE). Six hours after transfection, type 1 cytokines were added, and 24 hours post transfection the IMDM media was added to transfected cells. The cells were split at day three after isolation and maintained in type 1 polarizing conditions and high IL-2 as described above.
Bisulfite Analysis
1–2×10⁶ cells were harvested from primary CD4+ Th1 cells maintained in high IL-2, low IL-2, or low IL-2 with αKG. Genomic DNA was isolated using the Gentra Puregene Cell Kit (Qiagen). 200–600ng of genomic DNA was used in the bisulfite conversion reaction (EZ DNA Methylation kit; Zymo Research). After 14 hours, the bisulfite converted DNA was purified and then amplified with primers specific to an IL-2- and αKG-sensitive CTCF peak in proximity to Hk2 or Sell using a hot start polymerase (Zymo Taq). Bisulfite primers were designed using the online bisulfite primer seeker program from Zymo Research. Amplicons were cloned into the pcDNA vector (TOPO TA Expression Kit; Invitrogen) and were subjected to Sanger sequencing. Data represent the average methylation from at least 17 or 10 independent clones from each condition for Hk2 and Sell, respectively. As displayed in Figure 6B, 6C, S4E; for the Hk2 locus, CpG1 is located at Chr6:82,813,739–82,813,740 and CpG2 at Chr6:82,813,792–82,813,793 on the mm9 genome. For the Sell locus, CpG1 is located at Chr1:165,991,593–165,991,594, CpG2 at Chr1:165,991,647–165,991,648, CpG3 at Chr1:165,991,700–165,991,701, and CpG4 at Chr1:165,991,725–165,991,726 in the mm9 reference genome.
Western Analysis and Flow Cytometry
A western analysis was performed on primary CD4+ Th1 cells maintained in high IL-2, low IL-2, or low IL-2 with αKG for two days. The antibodies used were for HK2 (Abcam, ab76959), TCF1 (Cell Signaling, C63D9), CTCF (Millipore, 07–729) and STAT4 (Santa Cruz, C-20, sc-486X). Total STAT4 protein expression was monitored as a control for equivalent protein input in each sample in the western analysis. For flow cytometry, primary CD4+ Th1 cells maintained in high IL-2, low IL-2, or low IL-2 with αKG for two days were analyzed for CXCR3 (αCXCR3; Clone: CXCR3–173; Biolegend). Flow cytometry analyses were done with FlowJo V.10. software.
ELISA
ELISA was performed with the supernatants from primary CD4+ Th1 cells polarized in Th1 conditions as described above and then maintained in high IL-2, low IL-2, or low IL-2 with αKG for two days. Samples were incubated overnight on plate bound anti-IFNγ (Clone R4-6A2). Samples were then incubated with a biotinylated secondary antibody (XMG1.2), and a streptavidin-HRP for developing. Analysis was performed using software SoftMax Pro 6.2.1 on the SpectraMax M2 instrument and concentrations were normalized to a density of 106 cells.
Chromatin immunoprecipitation followed by next-generation sequencing (ChIP-seq)
ChIP-seq was performed as previously outlined (Reddy et al., 2009) with primary CD4+ T cells polarized in Th1 conditions and exposed to high IL-2, low IL-2, or low IL-2 with αKG. For the H3K27me3 ChIP-seq, for the low IL-2 and low-2 with αKG conditions, one experiment was performed with 10units/mL of IL-2 and the second experiment was performed with 2.5units/mL of IL-2. Briefly, 20 million cells were crosslinked with 1% formaldehyde for 10 minutes while sonication was performed using a Bioruptor (Diagenode). Following sonication, ChIP was performed using antibodies targeting CTCF (Active Motif, 61312), H3K27ac (Abcam, ab4729) and H3K27me3 (Millipore, 07–449). Following library preparation, ChIP DNA and input control DNA was sequenced on a HiSeq 2000 instrument (Illumina) using singleend 50bp read sequencing. Sequenced reads were mapped to the mouse mm9 reference genome and peaks were identified using the MACS peak caller (Zhang et al., 2008). To identify αKG-induced peaks for RNA-seq comparisons, normalized sequencing read depth at all sites (in reads per million aligned reads) identified across distinct conditions were calculated, compared and ranked. CTCF peaks that had at least an average normalized read depth value of 2 and a 1.478 fold increase (unadjusted p value of 0.05) in the low IL-2 with αKG compared to the low IL-2 condition were identified as αKG-induced peaks. These were then subjected to a Genomic Regions Enrichment Annotations Tool (GREAT) analysis (Bejerano lab, Stanford University (McLean et al., 2010)) using the basal plus extension default parameters (proximal: 5.0 kb; 1.0 kb downstream; plus distal up to 1000 kb) to determine the genes that were associated with the CTCF peak. We then compared their identity with the genes from the RNA-seq data defining αKG-inducible gene expression.
In Situ Hi-C
Hi-C protocol outlined in (Rao et al., 2014) was performed with the following alterations. Nuclei were resuspended in 0.5% SDS diluted in a final concentration of 1× NEB Buffer 2 in step 10. A smaller volume (21.6 µL) 10× NEB was added at step 12. Each sequencing library was incubated with USER enzyme for 15 minutes at 37°C after step 56. Final libraries were submitted to a paired-end run on Illumina HiSeq 2500. Read lengths of 100 bp (left read) and 90 bp (right read) were acquired. Hi-C sequencing was conducted at the IGM Genomics Center, University of California, San Diego, La Jolla, CA.
Hi-C Analysis
Reads were first trimmed from the 3’ end of sequences to GATC (MboI restriction enzyme site). Trimmed reads were aligned to mm9 with Bowtie software with parameters --chunkmbs 128 --mm -m1 --best --strata -p4 -S. The remainder of analysis was performed using Homer (Hypergeometric Optimization of Motif Enrichment)(Heinz et al., 2010; Lin et al., 2012). Only unique reads and paired end tags with more than 1.5× fragment length on the same chromosome separating them were retained. Sequence reads were checked for GC and other nucleotide bias. Tag counts of all directories were normalized to the sample with lowest sequencing depth. A map resolution of 26,000 kb was chosen to ensure that > 80% of loci had at least 1000 contacts. A superRes of 52,000 kb was used. Circos diagrams were generated with Circos software. Only interactions with a p value ≤ 0.0001 are depicted. Line thickness of Circos diagrams refer to the p value, wherein a darker line depicts a lower p value. In depth explanations of normalization, generation of Hi-C correlation matrices, principal component analysis (PCA) and finding significant interactions are previously described (Lin et al., 2012).
Adoptive transfer and Influenza infection
CD8+ T and CD4+ T cells from the spleens of naïve B6.OTI or B6.CD45.1+ OTII mice were isolated using anti-CD8 MACS beads and LS columns (Miltenyi Biotec) according to the manufacturer´s instructions for CD8+ T cells, or using negative selection MagCellect kits (R&D systems) for CD4+ T cells. For CD4+ OTII T cell transfer experiments, cells were stimulated with plate-bound anti-CD3 (clone 145-2C11, 5µg/mL) and anti-CD28 (clone 37.51, 10µg/mL) and polarized in type 1 conditions (anti-IL4 (clone 11B11), 10µg/mL) and IL-12 (R&D catalog number 419ML-010, 5ng/mL) in the absence (Ctrl) or presence of DON for three days. In the indicated experiments (25 × 103) of OTI cells or (25 × 104) of OTII cells were intravenously injected into the indicated recipient mice. Recipient mice of OTI cells were infected intranasally with 0.1 LD50 of influenza A/WSN/33 (WSN)-OVA one day later (an influenza strain engineered to express OVA257–264 in the neuraminidase stalk protein of influenza A/WSN/33). Recipient mice of OTII cells were infected intranasally with 500 VFU of PR8-OTII influenza virus (an engineered strain of PR8 that express the OVA323–339 peptide in the hemagglutinin (HA) molecule) one day after adoptive transfer. WSN-OVA and PR8-OTII were administered intranasally in 100 µl of PBS.
Cell preparation, flow cytometry and cell sorting
Cell suspensions from lung-draining, mediastinal lymph nodes (mLNs) were harvested, mechanically disrupted and filtered through a 70 µm nylon cell strainer (BD Biosciences). Cells were washed and resuspended in PBS with 2% donor calf serum and 10 µg/ml FcBlock (2.4G2 -BioXCell) for 10 min on ice before staining with fluorochrome-conjugated antibodies. Fluorochrome-labeled anti-CD8 (53-6.7), anti-CD19 (1D3), anti-CD45.1 (A20), CD45.2 (104) anti-CD25 (PC61), anti-Bcl6 (clone K112.91, dilution 1/50), anti-CXCR5 (clone 2G-8, dilution 1/50), anti-CD4 (clone RM4–5), anti-Blimp-1 (clone 5E7) were from BD Biosciences. Anti-T-bet (clone 4B10) was purchased from Biolegend. Dead cell exclusion was performed using 7-AAD (Calbiochem). The H-2Db class I tetramer containing NP366–374 peptide (NP) was generated by the NIH Tetramer Core Facility (Atlanta, GA). When indicated, the intracellular staining was performed using the mouse regulatory T cell staining kit (eBioscience) following manufacturer’s instructions. Flow cytometry was performed using a FACSCanto II (BD Biosciences) and an Attune NxT Flow Cytometer (ThermoFischer Scientific). In the indicated experiments, donor CD25hi and CD25lo OTI cells and endogenous CD25hi and CD25lo NP-specific CD8+ T cells were sorted using a FACSAria II sorter (BD Biosciences).
ATAC-seq
ATAC-seq was performed on 10,000–50,000 antigen specific CD8+ T cells generated as described above. The ATAC-seq protocol was performed as previously published (Buenrostro et al., 2015). Briefly, cells were lysed in ice-cold lysis buffer (10mM TrisCl pH 7.4, 10mM NaCl, 3mM MgCl2, 0.1% Igepal). Transposase reactions were performed using Tn5 transposase (Illumina) and were incubated for 30 minutes at 37°C. DNA was purified with the MinElut Kit (Qiagen). Libraries were amplified using Nextara primers with NEBNext High-Fidelity 2X PCR Master Mix (New England Biolegends), and reactions were purified with the PCR Purification Kit (Qiagen). Libraries were sequenced on a 1×50bp paired end run on a HiSeq2500 instrument in a rapid run mode at the University of Alabama at Birmingham Heflin Center for Genomic Science.
ATAC-seq analysis
The raw fastq data files were first trimmed to remove primer adapters using Trim Galore! version 0.4.1. The trimmed sequences were then aligned to the mouse reference genome (mm9) from UCSC using Bowtie2 version 2.2.9 with the option ‘-X 2000’ (Langmead et al., 2009). Aligned reads were then sorted followed by removal of duplicates using Picard version 2.6.0 SortSam and MarkDuplicates, respectively (Picard: http://broadinstitute.github.io/picard). Peak calling was then performed using Model-based Analysis of ChIP-seq (MACS2) callpeak version 2.1.1.20160309 using these options: ‘-B’, ‘-q 0.05’, ‘--call-summits’, ‘—nomodel', ‘--nolambda', and --keep-dup all’ (Zhang et al., 2008). For visualization of the peaks in the UCSC Genome Browser, alignment files were normalized using deepTools version 2.3.3 bamCoverage using the options: ‘--normalizeTo1× 2150570000’, and ‘--ignore For Normalization chrX chrM’ (Ramirez et al., 2016).
UCSC genome browser
ChIP-seq, ATAC-seq, and Hi-C data are displayed using the University of California Santa Cruz (UCSC) genome browser (http://genome.ucsc.edu/)(Kent et al., 2002).
QUANTIFICATION AND STATISTICAL ANALYSIS
For qRT-PCR, the Rps18 gene was used for normalization of each sample. Normalized samples were then compared relative to the low IL-2 condition (Figure 1A, 1B, 3D), high IL-2 with glutamine (Figure 2F), high IL-2 (Figure 3C) or control siGFP (Figure 4D, 4E) sample for each independent experiment. Statistical analysis for qRT-PCR: the error bars represent standard error mean (SEM). Unpaired student t-tests were conducted using the GraphPad Prism online software. For the influenza experiments, the data are shown as the mean ± SD (n=5–6 mice/group) and are representative of two independent experiments. A two-tailed Student´s t-test was used to analyze the data and determine the p value. RNA-seq analysis and statistics were performed using the Tuxedo suite tools with the Penn State Galaxy website. Quantification and alignments of NGS analysis for RNA-seq, ChIP-seq and ATAC-seq are also described in more detail in the methods section above.
DATA AND SOFTWARE AVAILABILITY
All of the sequencing data can be found publicly available on the NCBI GEO website under the accession number for a Super Series GSE89722. The accession number for the individual sequencing types are as follows RNA-seq: GSE88829; ChIP-seq: GSE88857; ATAC-seq: GSE89038; and HiC-Seq: GSE89676.
Supplementary Material
Highlights.
Gln- and αKG-sensitive events promote the IL-2-sensitive effector-like gene program
IL-2- and αKG-sensitive events influence DNA and H3K27 methylation in Th1 cells
IL-2 and αKG-sensitive events regulate CTCF and genome organization in Th1 cells
αKG-sensitive changes in CTCF are interpreted into context-dependent gene programs
Acknowledgments
We thank Wayne Cheng and members of the Weinmann lab, as well as Kimberly Newberry and Sarah Meadows from the Myers lab, for key technical assistance and helpful discussions. We thank the National Institutes of Health (AI061061 and AI113026 to A.S.W.; AI110480 to A.B.T.; AI116584 to B.L.; AI00880, AI09599, DK242301 and AI102853 to C.M) and the Comprehensive Minority Faculty and Student Development Program (D.A.C) for funding. IL-2 was provided by the NCI preclinical repository.
Footnotes
Publisher's Disclaimer: This is a PDF file of an unedited manuscript that has been accepted for publication. As a service to our customers we are providing this early version of the manuscript. The manuscript will undergo copyediting, typesetting, and review of the resulting proof before it is published in its final citable form. Please note that during the production process errors may be discovered which could affect the content, and all legal disclaimers that apply to the journal pertain.
Author Contributions
D.A.C and A.S.W conceived of and designed the study and experiments, performed/supervised experiments, and wrote the manuscript. D.S. and R.M.M. performed/supervised ChIP-seq, A.J.M and C.M. performed/supervised in situ Hi-C, D.K.C. performed bioinformatics analyses of ATAC-seq, and A.B.T. and B.L. performed influenza/adoptive transfers. All authors contributed to manuscript editing.
References
- Ballesteros-Tato A, Leon B, Graf BA, Moquin A, Adams PS, Lund FE, Randall TD. Interleukin-2 inhibits germinal center formation by limiting T follicular helper cell differentiation. Immunity. 2012;36:847–856. doi: 10.1016/j.immuni.2012.02.012. [DOI] [PMC free article] [PubMed] [Google Scholar]
- Benner C, Isoda T, Murre C. New roles for DNA cytosine modification, eRNA, anchors, and superanchors in developing B cell progenitors. Proc Natl Acad Sci U S A. 2015;112:12776–12781. doi: 10.1073/pnas.1512995112. [DOI] [PMC free article] [PubMed] [Google Scholar]
- Bonora G, Plath K, Denholtz M. A mechanistic link between gene regulation and genome architecture in mammalian development. Curr Opin Genet Dev. 2014;27:92–101. doi: 10.1016/j.gde.2014.05.002. [DOI] [PMC free article] [PubMed] [Google Scholar]
- Buenrostro JD, Wu B, Chang HY, Greenleaf WJ. ATAC-seq: A Method for Assaying Chromatin Accessibility Genome-Wide. In: Frederick M, Ausubel, et al., editors. Current protocols in molecular biology. Vol. 109. 2015. pp. 21 29 21–29. [DOI] [PMC free article] [PubMed] [Google Scholar]
- Carey BW, Finley LW, Cross JR, Allis CD, Thompson CB. Intracellular alpha-ketoglutarate maintains the pluripotency of embryonic stem cells. Nature. 2015;518:413–416. doi: 10.1038/nature13981. [DOI] [PMC free article] [PubMed] [Google Scholar]
- Chang CH, Qiu J, O'Sullivan D, Buck MD, Noguchi T, Curtis JD, Chen Q, Gindin M, Gubin MM, van der Windt GJ, et al. Metabolic Competition in the Tumor Microenvironment Is a Driver of Cancer Progression. Cell. 2015;162:1229–1241. doi: 10.1016/j.cell.2015.08.016. [DOI] [PMC free article] [PubMed] [Google Scholar]
- Chisolm DA, Weinmann AS. TCR-Signaling Events in Cellular Metabolism and Specialization. Frontiers in immunology. 2015;6:292. doi: 10.3389/fimmu.2015.00292. [DOI] [PMC free article] [PubMed] [Google Scholar]
- Dixon JR, Selvaraj S, Yue F, Kim A, Li Y, Shen Y, Hu M, Liu JS, Ren B. Topological domains in mammalian genomes identified by analysis of chromatin interactions. Nature. 2012;485:376–380. doi: 10.1038/nature11082. [DOI] [PMC free article] [PubMed] [Google Scholar]
- Doedens AL, Phan AT, Stradner MH, Fujimoto JK, Nguyen JV, Yang E, Johnson RS, Goldrath AW. Hypoxia-inducible factors enhance the effector responses of CD8(+) T cells to persistent antigen. Nat Immunol. 2013;14:1173–1182. doi: 10.1038/ni.2714. [DOI] [PMC free article] [PubMed] [Google Scholar]
- Fang R, Wang C, Skogerbo G, Zhang Z. Functional diversity of CTCFs is encoded in their binding motifs. BMC genomics. 2015;16:649. doi: 10.1186/s12864-015-1824-6. [DOI] [PMC free article] [PubMed] [Google Scholar]
- Finlay D, Cantrell DA. Metabolism, migration and memory in cytotoxic T cells. Nat Rev Immunol. 2011;11:109–117. doi: 10.1038/nri2888. [DOI] [PMC free article] [PubMed] [Google Scholar]
- Flavahan WA, Drier Y, Liau BB, Gillespie SM, Venteicher AS, Stemmer-Rachamimov AO, Suva ML, Bernstein BE. Insulator dysfunction and oncogene activation in IDH mutant gliomas. Nature. 2016;529:110–114. doi: 10.1038/nature16490. [DOI] [PMC free article] [PubMed] [Google Scholar]
- Gerriets VA, Kishton RJ, Nichols AG, Macintyre AN, Inoue M, Ilkayeva O, Winter PS, Liu X, Priyadharshini B, Slawinska ME, et al. Metabolic programming and PDHK1 control CD4+ T cell subsets and inflammation. J Clin Invest. 2015;125:194–207. doi: 10.1172/JCI76012. [DOI] [PMC free article] [PubMed] [Google Scholar]
- Goldrath AW, Luckey CJ, Park R, Benoist C, Mathis D. The molecular program induced in T cells undergoing homeostatic proliferation. Proc Natl Acad Sci U S A. 2004;101:16885–16890. doi: 10.1073/pnas.0407417101. [DOI] [PMC free article] [PubMed] [Google Scholar]
- Heinz S, Benner C, Spann N, Bertolino E, Lin YC, Laslo P, Cheng JX, Murre C, Singh H, Glass CK. Simple combinations of lineage-determining transcription factors prime cis-regulatory elements required for macrophage and B cell identities. Mol Cell. 2010;38:576–589. doi: 10.1016/j.molcel.2010.05.004. [DOI] [PMC free article] [PubMed] [Google Scholar]
- Ho PC, Bihuniak JD, Macintyre AN, Staron M, Liu X, Amezquita R, Tsui YC, Cui G, Micevic G, Perales JC, et al. Phosphoenolpyruvate Is a Metabolic Checkpoint of Anti-tumor T Cell Responses. Cell. 2015;162:1217–1228. doi: 10.1016/j.cell.2015.08.012. [DOI] [PMC free article] [PubMed] [Google Scholar]
- Hulsen T, de Vlieg J, Alkema W. BioVenn - a web application for the comparison and visualization of biological lists using area-proportional Venn diagrams. BMC genomics. 2008;9:488. doi: 10.1186/1471-2164-9-488. [DOI] [PMC free article] [PubMed] [Google Scholar]
- Johnson MO, Siska PJ, Contreras DC, Rathmell JC. Nutrients and the microenvironment to feed a T cell army. Semin Immunol. 2016;28:505–513. doi: 10.1016/j.smim.2016.09.003. [DOI] [PMC free article] [PubMed] [Google Scholar]
- Kalia V, Sarkar S, Subramaniam S, Haining WN, Smith KA, Ahmed R. Prolonged interleukin-2Ralpha expression on virus-specific CD8+ T cells favors terminal-effector differentiation in vivo. Immunity. 2010;32:91–103. doi: 10.1016/j.immuni.2009.11.010. [DOI] [PubMed] [Google Scholar]
- Kent WJ, Sugnet CW, Furey TS, Roskin KM, Pringle TH, Zahler AM, Haussler D. The human genome browser at UCSC. Genome research. 2002;12:996–1006. doi: 10.1101/gr.229102. [DOI] [PMC free article] [PubMed] [Google Scholar]
- Kim D, Pertea G, Trapnell C, Pimentel H, Kelley R, Salzberg SL. TopHat2: accurate alignment of transcriptomes in the presence of insertions, deletions and gene fusions. Genome biology. 2013;14:R36. doi: 10.1186/gb-2013-14-4-r36. [DOI] [PMC free article] [PubMed] [Google Scholar]
- Langmead B, Trapnell C, Pop M, Salzberg SL. Ultrafast and memory-efficient alignment of short DNA sequences to the human genome. Genome biology. 2009;10:R25. doi: 10.1186/gb-2009-10-3-r25. [DOI] [PMC free article] [PubMed] [Google Scholar]
- Liao W, Lin JX, Leonard WJ. Interleukin-2 at the crossroads of effector responses, tolerance, and immunotherapy. Immunity. 2013;38:13–25. doi: 10.1016/j.immuni.2013.01.004. [DOI] [PMC free article] [PubMed] [Google Scholar]
- Lin YC, Benner C, Mansson R, Heinz S, Miyazaki K, Miyazaki M, Chandra V, Bossen C, Glass CK, Murre C. Global changes in the nuclear positioning of genes and intra- and interdomain genomic interactions that orchestrate B cell fate. Nat Immunol. 2012;13:1196–1204. doi: 10.1038/ni.2432. [DOI] [PMC free article] [PubMed] [Google Scholar]
- Luckey CJ, Bhattacharya D, Goldrath AW, Weissman IL, Benoist C, Mathis D. Memory T and memory B cells share a transcriptional program of self-renewal with long-term hematopoietic stem cells. Proc Natl Acad Sci U S A. 2006;103:3304–3309. doi: 10.1073/pnas.0511137103. [DOI] [PMC free article] [PubMed] [Google Scholar]
- MacIver NJ, Michalek RD, Rathmell JC. Metabolic regulation of T lymphocytes. Annu Rev Immunol. 2013;31:259–283. doi: 10.1146/annurev-immunol-032712-095956. [DOI] [PMC free article] [PubMed] [Google Scholar]
- Manna S, Kim JK, Bauge C, Cam M, Zhao Y, Shetty J, Vacchio MS, Castro E, Tran B, Tessarollo L, Bosselut R. Histone H3 Lysine 27 demethylases Jmjd3 and Utx are required for T-cell differentiation. Nature communications. 2015;6:8152. doi: 10.1038/ncomms9152. [DOI] [PMC free article] [PubMed] [Google Scholar]
- McLean CY, Bristor D, Hiller M, Clarke SL, Schaar BT, Lowe CB, Wenger AM, Bejerano G. GREAT improves functional interpretation of cis-regulatory regions. Nature biotechnology. 2010;28:495–501. doi: 10.1038/nbt.1630. [DOI] [PMC free article] [PubMed] [Google Scholar]
- Miller SA, Huang AC, Miazgowicz MM, Brassil MM, Weinmann AS. Coordinated but physically separable interaction with H3K27-demethylase and H3K4-methyltransferase activities are required for T-box protein-mediated activation of developmental gene expression. Genes Dev. 2008;22:2980–2993. doi: 10.1101/gad.1689708. [DOI] [PMC free article] [PubMed] [Google Scholar]
- Mitra S, Ring AM, Amarnath S, Spangler JB, Li P, Ju W, Fischer S, Oh J, Spolski R, Weiskopf K, et al. Interleukin-2 activity can be fine tuned with engineered receptor signaling clamps. Immunity. 2015;42:826–838. doi: 10.1016/j.immuni.2015.04.018. [DOI] [PMC free article] [PubMed] [Google Scholar]
- Moussaieff A, Rouleau M, Kitsberg D, Cohen M, Levy G, Barasch D, Nemirovski A, Shen-Orr S, Laevsky I, Amit M, et al. Glycolysis-mediated changes in acetyl-CoA and histone acetylation control the early differentiation of embryonic stem cells. Cell metabolism. 2015;21:392–402. doi: 10.1016/j.cmet.2015.02.002. [DOI] [PubMed] [Google Scholar]
- Nakaya M, Xiao Y, Zhou X, Chang JH, Chang M, Cheng X, Blonska M, Lin X, Sun SC. Inflammatory T cell responses rely on amino acid transporter ASCT2 facilitation of glutamine uptake and mTORC1 kinase activation. Immunity. 2014;40:692–705. doi: 10.1016/j.immuni.2014.04.007. [DOI] [PMC free article] [PubMed] [Google Scholar]
- Oestreich KJ, Mohn SE, Weinmann AS. Molecular mechanisms that control the expression and activity of Bcl-6 in TH1 cells to regulate flexibility with a TFH-like gene profile. Nat Immunol. 2012;13:405–411. doi: 10.1038/ni.2242. [DOI] [PMC free article] [PubMed] [Google Scholar]
- Oestreich KJ, Read KA, Gilbertson SE, Hough KP, McDonald PW, Krishnamoorthy V, Weinmann AS. Bcl-6 directly represses the gene program of the glycolysis pathway. Nat Immunol. 2014;15:957–964. doi: 10.1038/ni.2985. [DOI] [PMC free article] [PubMed] [Google Scholar]
- Ong CT, Corces VG. CTCF: an architectural protein bridging genome topology and function. Nat Rev Genet. 2014;15:234–246. doi: 10.1038/nrg3663. [DOI] [PMC free article] [PubMed] [Google Scholar]
- Pearce EL, Poffenberger MC, Chang CH, Jones RG. Fueling immunity: insights into metabolism and lymphocyte function. Science. 2013;342:1242454. doi: 10.1126/science.1242454. [DOI] [PMC free article] [PubMed] [Google Scholar]
- Peng M, Yin N, Chhangawala S, Xu K, Leslie CS, Li MO. Aerobic glycolysis promotes T helper 1 cell differentiation through an epigenetic mechanism. Science. 2016;354:481–484. doi: 10.1126/science.aaf6284. [DOI] [PMC free article] [PubMed] [Google Scholar]
- Pipkin ME, Sacks JA, Cruz-Guilloty F, Lichtenheld MG, Bevan MJ, Rao A. Interleukin-2 and inflammation induce distinct transcriptional programs that promote the differentiation of effector cytolytic T cells. Immunity. 2010;32:79–90. doi: 10.1016/j.immuni.2009.11.012. [DOI] [PMC free article] [PubMed] [Google Scholar]
- Pollizzi KN, Sun IH, Patel CH, Lo YC, Oh MH, Waickman AT, Tam AJ, Blosser RL, Wen J, Delgoffe GM, Powell JD. Asymmetric inheritance of mTORC1 kinase activity during division dictates CD8(+) T cell differentiation. Nat Immunol. 2016;17:704–711. doi: 10.1038/ni.3438. [DOI] [PMC free article] [PubMed] [Google Scholar]
- Polo JM, Anderssen E, Walsh RM, Schwarz BA, Nefzger CM, Lim SM, Borkent M, Apostolou E, Alaei S, Cloutier J, et al. A molecular roadmap of reprogramming somatic cells into iPS cells. Cell. 2012;151:1617–1632. doi: 10.1016/j.cell.2012.11.039. [DOI] [PMC free article] [PubMed] [Google Scholar]
- Ramirez F, Ryan DP, Gruning B, Bhardwaj V, Kilpert F, Richter AS, Heyne S, Dundar F, Manke T. deepTools2: a next generation web server for deep-sequencing data analysis. Nucleic acids research. 2016;44:W160–165. doi: 10.1093/nar/gkw257. [DOI] [PMC free article] [PubMed] [Google Scholar]
- Rao SS, Huntley MH, Durand NC, Stamenova EK, Bochkov ID, Robinson JT, Sanborn AL, Machol I, Omer AD, Lander ES, Aiden EL. A 3D map of the human genome at kilobase resolution reveals principles of chromatin looping. Cell. 2014;159:1665–1680. doi: 10.1016/j.cell.2014.11.021. [DOI] [PMC free article] [PubMed] [Google Scholar]
- Reddy TE, Pauli F, Sprouse RO, Neff NF, Newberry KM, Garabedian MJ, Myers RM. Genomic determination of the glucocorticoid response reveals unexpected mechanisms of gene regulation. Genome research. 2009;19:2163–2171. doi: 10.1101/gr.097022.109. [DOI] [PMC free article] [PubMed] [Google Scholar]
- Ryall JG, Cliff T, Dalton S, Sartorelli V. Metabolic Reprogramming of Stem Cell Epigenetics. Cell stem cell. 2015;17:651–662. doi: 10.1016/j.stem.2015.11.012. [DOI] [PMC free article] [PubMed] [Google Scholar]
- Shyh-Chang N, Locasale JW, Lyssiotis CA, Zheng Y, Teo RY, Ratanasirintrawoot S, Zhang J, Onder T, Unternaehrer JJ, Zhu H, et al. Influence of threonine metabolism on Sadenosylmethionine and histone methylation. Science. 2013;339:222–226. doi: 10.1126/science.1226603. [DOI] [PMC free article] [PubMed] [Google Scholar]
- Spangler JB, Tomala J, Luca VC, Jude KM, Dong S, Ring AM, Votavova P, Pepper M, Kovar M, Garcia KC. Antibodies to Interleukin-2 Elicit Selective T Cell Subset Potentiation through Distinct Conformational Mechanisms. Immunity. 2015;42:815–825. doi: 10.1016/j.immuni.2015.04.015. [DOI] [PMC free article] [PubMed] [Google Scholar]
- Su X, Wellen KE, Rabinowitz JD. Metabolic control of methylation and acetylation. Current opinion in chemical biology. 2016;30:52–60. doi: 10.1016/j.cbpa.2015.10.030. [DOI] [PMC free article] [PubMed] [Google Scholar]
- Subramanian A, Tamayo P, Mootha VK, Mukherjee S, Ebert BL, Gillette MA, Paulovich A, Pomeroy SL, Golub TR, Lander ES, Mesirov JP. Gene set enrichment analysis: a knowledge-based approach for interpreting genome-wide expression profiles. Proc Natl Acad Sci U S A. 2005;102:15545–15550. doi: 10.1073/pnas.0506580102. [DOI] [PMC free article] [PubMed] [Google Scholar]
- Sukumar M, Liu J, Ji Y, Subramanian M, Crompton JG, Yu Z, Roychoudhuri R, Palmer DC, Muranski P, Karoly ED, et al. Inhibiting glycolytic metabolism enhances CD8+ T cell memory and antitumor function. J Clin Invest. 2013;123:4479–4488. doi: 10.1172/JCI69589. [DOI] [PMC free article] [PubMed] [Google Scholar]
- Swamy M, Pathak S, Grzes KM, Damerow S, Sinclair LV, van Aalten DM, Cantrell DA. Glucose and glutamine fuel protein O-GlcNAcylation to control T cell self-renewal and malignancy. Nat Immunol. 2016;17:712–720. doi: 10.1038/ni.3439. [DOI] [PMC free article] [PubMed] [Google Scholar]
- Tahiliani M, Koh KP, Shen Y, Pastor WA, Bandukwala H, Brudno Y, Agarwal S, Iyer LM, Liu DR, Aravind L, Rao A. Conversion of 5-methylcytosine to 5-hydroxymethylcytosine in mammalian DNA by MLL partner TET1. Science. 2009;324:930–935. doi: 10.1126/science.1170116. [DOI] [PMC free article] [PubMed] [Google Scholar]
- Teif VB, Beshnova DA, Vainshtein Y, Marth C, Mallm JP, Hofer T, Rippe K. Nucleosome repositioning links DNA (de)methylation and differential CTCF binding during stem cell development. Genome research. 2014;24:1285–1295. doi: 10.1101/gr.164418.113. [DOI] [PMC free article] [PubMed] [Google Scholar]
- Trapnell C, Williams BA, Pertea G, Mortazavi A, Kwan G, van Baren MJ, Salzberg SL, Wold BJ, Pachter L. Transcript assembly and quantification by RNA-Seq reveals unannotated transcripts and isoform switching during cell differentiation. Nature biotechnology. 2010;28:511–515. doi: 10.1038/nbt.1621. [DOI] [PMC free article] [PubMed] [Google Scholar]
- Tyrakis PA, Palazon A, Macias D, Lee KL, Phan AT, Velica P, You J, Chia GS, Sim J, Doedens A, et al. S-2-hydroxyglutarate regulates CD8+ T-lymphocyte fate. Nature. 2016;540:236–241. doi: 10.1038/nature20165. [DOI] [PMC free article] [PubMed] [Google Scholar]
- Vahedi G, Kanno Y, Furumoto Y, Jiang K, Parker SC, Erdos MR, Davis SR, Roychoudhuri R, Restifo NP, Gadina M, et al. Super-enhancers delineate disease-associated regulatory nodes in T cells. Nature. 2015;520:558–562. doi: 10.1038/nature14154. [DOI] [PMC free article] [PubMed] [Google Scholar]
- Vahedi G, Takahashi H, Nakayamada S, Sun HW, Sartorelli V, Kanno Y, O'Shea JJ. STATs shape the active enhancer landscape of T cell populations. Cell. 2012;151:981–993. doi: 10.1016/j.cell.2012.09.044. [DOI] [PMC free article] [PubMed] [Google Scholar]
- van der Windt GJ, O'Sullivan D, Everts B, Huang SC, Buck MD, Curtis JD, Chang CH, Smith AM, Ai T, Faubert B, et al. CD8 memory T cells have a bioenergetic advantage that underlies their rapid recall ability. Proc Natl Acad Sci U S A. 2013;110:14336–14341. doi: 10.1073/pnas.1221740110. [DOI] [PMC free article] [PubMed] [Google Scholar]
- Verbist KC, Guy CS, Milasta S, Liedmann S, Kaminski MM, Wang R, Green DR. Metabolic maintenance of cell asymmetry following division in activated T lymphocytes. Nature. 2016;532:389–393. doi: 10.1038/nature17442. [DOI] [PMC free article] [PubMed] [Google Scholar]
- Wang R, Dillon CP, Shi LZ, Milasta S, Carter R, Finkelstein D, McCormick LL, Fitzgerald P, Chi H, Munger J, Green DR. The transcription factor Myc controls metabolic reprogramming upon T lymphocyte activation. Immunity. 2011;35:871–882. doi: 10.1016/j.immuni.2011.09.021. [DOI] [PMC free article] [PubMed] [Google Scholar]
- Wherry EJ, Ha SJ, Kaech SM, Haining WN, Sarkar S, Kalia V, Subramaniam S, Blattman JN, Barber DL, Ahmed R. Molecular signature of CD8+ T cell exhaustion during chronic viral infection. Immunity. 2007;27:670–684. doi: 10.1016/j.immuni.2007.09.006. [DOI] [PubMed] [Google Scholar]
- Zhang Y, Liu T, Meyer CA, Eeckhoute J, Johnson DS, Bernstein BE, Nusbaum C, Myers RM, Brown M, Li W, Liu XS. Model-based analysis of ChIP-Seq (MACS) Genome biology. 2008;9:R137. doi: 10.1186/gb-2008-9-9-r137. [DOI] [PMC free article] [PubMed] [Google Scholar]
Associated Data
This section collects any data citations, data availability statements, or supplementary materials included in this article.