

Abstract
Ebola virus (EBOV) causes a severe disease in humans with the potential for significant international public health consequences. Currently, treatments are limited to experimental vaccines and therapeutics. Therefore, research into prophylaxis and antiviral strategies to combat EBOV infections is of utmost importance. The requirement for high containment laboratories to study EBOV infection is a limiting factor for conducting EBOV research. To overcome this issue, minigenome systems have been used as valuable tools to study EBOV replication and transcription mechanisms and to screen for antiviral compounds at biosafety level 2. The most commonly used EBOV minigenome system relies on the ectopic expression of the T7 RNA polymerase (T7), which can be limiting for certain cell types. We have established an improved EBOV minigenome system that utilizes endogenous RNA polymerase II (pol II) as a driver for the synthesis of minigenome RNA. We show here that this system is as efficient as the T7-based minigenome system, but works in a wider range of cell types, including biologically relevant cell types such as bat cells. Importantly, we were also able to adapt this system to a reliable and cost-effective 96-well format antiviral screening assay with a Z-factor of 0.74, indicative of a robust assay. Using this format, we identified JG40, an inhibitor of Hsp70, as an inhibitor of EBOV replication, highlighting the potential for this system as a tool for antiviral drug screening. In summary, this updated EBOV minigenome system provides a convenient and effective means of advancing the field of EBOV research.
Keywords: Ebola virus, filoviruses, minigenome system, RNA polymerase II, T7 RNA polymerase, antiviral drug screening
1. Introduction
Ebola virus (EBOV) is an emerging virus of significant international health concern (Rougeron et al., 2015). Currently, there are no licensed vaccines or treatments available to combat EBOV disease (EVD) and as such, research aimed at identifying targets for therapeutic intervention is of high priority. However, the classification of EBOV as a biosafety level 4 (BSL-4) pathogen greatly limits studies using live virus. To circumvent the requirement for high containment, minigenome systems have been developed as tools to study various aspects of the EBOV replication cycle, particularly replication and transcription, in a BSL-2 setting (for review see (Brauburger et al., 2015b; Hoenen et al., 2011; Mühlberger, 2007)). Minigenomes are truncated versions of the viral genome, consisting of the 3′ and 5′ viral genome ends which typically flank a reporter gene of choice, often green fluorescent protein (GFP) or luciferase. DNA encoding the minigenome is cloned into an expression plasmid and co-transfected into cells along with plasmids encoding the viral proteins required for EBOV genome replication and transcription. Importantly, EBOV minigenome systems have also been used extensively for antiviral drug screening (Edwards et al., 2015; Enterlein et al., 2006; Filone et al., 2013; Jasenosky et al., 2010; Olsen et al., 2016; Uebelhoer et al., 2014). Most of the currently existing EBOV minigenomes are under the control of the T7 RNA polymerase (T7) promoter and thus require T7 expression in the transfected cells (Garcia-Dorival et al., 2016; Mühlberger et al., 1999; Uebelhoer et al., 2014). There are different approaches for expressing T7 in mammalian cells. It can be supplied in trans, e.g. by infection with a T7-expressing recombinant virus such as MVA-T7 (Sutter et al., 1995), or by co-transfection with a T7-expressing plasmid (Watanabe et al., 2004). While T7-expressing viruses may interfere with different aspects of the minigenome system or cause cytopathic effects, plasmid-based T7 may be expressed at levels insufficient to support minigenome activity in certain cell types due to technical difficulties. There are also few cell lines available that stably express T7 (Buchholz et al., 1999; Ito et al., 2003). Though the widely used BSR-T7/5 cell line (Buchholz et al., 1999) supports robust EBOV T7-dependent minigenome activity (Brauburger et al., 2015a; Brauburger et al., 2014; Trunschke et al., 2013), it is derived from baby hamster kidney (BHK) cells and is therefore not an ideal cell type to study EBOV infection, since rodents are not relevant hosts for EBOV. The T7-based EBOV minigenome system has been used successfully for nearly two decades, diminishing the necessity for alternative systems. Recently, however, when attempting to use this system in other, more relevant cells, we encountered difficulties due to T7-induced cytopathicity. An attractive alternative to T7-based systems is the use of cellular RNA polymerases that are endogenously expressed in the cell types of interest. Both RNA polymerase I (pol I) (Freiberg et al., 2008; Groseth et al., 2005; Jasenosky et al., 2010; Perez et al., 2003) and RNA polymerase II (pol II) (Inoue et al., 2003; Martin et al., 2006; Yanai et al., 2006) have been used successfully to drive reverse genetics systems for nonsegmented negative-sense (NNS) RNA viruses. Pol I has species-specific requirements for promoter recognition, which therefore restricts the repertoire of cell lines available for use (Heix and Grummt, 1995). We were therefore interested in establishing a pol II-based EBOV minigenome system.
Compared to the existing T7-based minigenome system, the pol II minigenome constructs require some adaptations to assure efficient minigenome activity. In the T7 EBOV minigenome system, transcription of the minigenomic cDNA by T7 results in a negative-sense minigenome RNA, which is used as a template for replication and transcription by the EBOV polymerase complex. Precise 3′ ends of the minigenome are a prerequisite for replication activity and are generated through the self-cleavage activity of the hepatitis delta virus (HDV) ribozyme, which is attached to the 3′ end of the minigenome (Mühlberger et al., 1999; Pattnaik et al., 1992). As for the 5′ terminal nucleotides of the minigenome, short overhangs are accepted for proper replication activity (Collins et al., 1991; Conzelmann and Schnell, 1994; Mühlberger et al., 1998; Mühlberger et al., 1999; Pattnaik et al., 1992). Transcription from the T7 promoter starts with the last nucleotide of the promoter immediately followed by the terminal nucleotides of the EBOV minigenome. In contrast to T7, pol II does not have a precise transcription initiation site (Butler and Kadonaga, 2002). Therefore, the minigenome sequence in the pol II construct must be flanked by two ribozymes. Commonly, the HDV ribozyme is used to generate 3′ ends and a hammerhead ribozyme is used to generate defined 5′ ends (Ghanem et al., 2012; Yanai et al., 2006).
Here we describe an optimized EBOV minigenome system that is based on pol II-driven gene expression. We show that the EBOV pol II minigenome system is as efficient as the widely used T7 minigenome system, but possesses greater cell type flexibility, particularly with cells that are difficult to transfect. Furthermore, using a cost-efficient transfection method, we optimized the EBOV pol II minigenome system for use in antiviral drug screening assays.
2. Materials and Methods
2.1 Cells and Viruses
Cell lines used in this study include: human embryonic kidney cells (HEK 293T; ATCC CRL-3216), African green monkey kidney cells (Vero; ATCC CRL-1586), human epithelial osteosarcoma cells (U20S; ATCC HTB-96), human hepatocellular carcinoma (Huh7) cells, human cervical carcinoma (HeLa; ATCC CCL-2), the hamster baby kidney cell line BSR-T7/5 constitutively expressing T7 (Buchholz et al., 1999), and the kidney fibroblast cell line RoNi/7.1 from the fruit bat Rousettus aegyptiacus (Kuhl et al., 2011)). All cell lines with the exception of the BSR-T7/5 and the RoNi/7.1 cells were maintained in Dulbecco modified Eagle medium (DMEM) supplemented with 10% fetal bovine serum (FBS), penicillin (50 units/ml), streptomycin (50 mg/ml) and L-glutamine (200 mM). The BSR-T7/5 cells were maintained in Glasgow’s Minimum Essential Medium (G-MEM) supplemented with 10% FBS, L-glutamine (200 mM), 2% MEM amino acid solution (50x), and 10% FBS, with geneticin antibiotic selection (1 mg/ml). RoNi/7.1 cells were grown in DMEM supplemented with penicillin (100 units/ml), streptomycin (100 μg/ml), L-glutamine (2 mM), 1% sodium pyruvate (100 mM) and 1% MEM amino acids (100x).
For infections with modified vaccinia virus Ankara expressing T7 (MVA-T7) (Sutter et al., 1995), 293T and RoNi/7.1 cells were seeded at 5×10⁵ cells per well in 12-well dishes. One day after seeding, cell supernatants were removed and replaced with the indicated amounts of MVA-T7 in fresh media. Virus was allowed to adhere to cells in a volume of 0.5 mL for 1 hour and then cells were supplemented with an additional 1 mL of fresh media. Cytopathic effects (CPE) were determined by brightfield microscopy.
2.2 Cloning of minigenomes
The sequence of the 3E5E minigenome (Mühlberger et al., 1999) was inserted into vector pcDNA3 under the control of the CMV promoter. To generate precise 5′ ends, synthesized fragments containing the hammerhead ribozyme sequence and the terminal nucleotides of the EBOV trailer were annealed and inserted between the CMV promoter and the EBOV trailer region as described previously (Yanai et al., 2006). The chloramphenicol acetyltransferase reporter gene in the original construct was replaced by the eGFP gene or firefly luciferase gene using BstXI and NotI restriction sites. An NheI restriction site was inserted in the pcDNA3-based minigenomes upstream of the HDV ribozyme sequence using Gibson Assembly (NEB).
To create a pCAGGS version of the pol II minigenome, both the eGFP and luciferase minigenome sequences were cloned into the pCAGGS plasmid backbone, which contains the CAG promoter, using NheI.
The replication-deficient EBOV L mutant (Lsynth−) was generated by site-directed mutagenesis and contains an N743 to A substitution within the highly conserved GDNQ motif at the catalytic site.
2.3 Transfection of cells
To transfect 293T, HeLa, and Vero cells, the TransIT-LT1 (Mirus Bio) was used following the manufacturer’s instructions. To transfect BSRT7/5, Huh7, U2OS, and RoNi/7.1 cells, Lipofectamine LTX with Plus reagent (Life Technologies) was used according to the manufacturer’s recommendations. One day prior to transfection, cells were seeded in 12-well tissue culture plates so that they were 70–80% confluent at the time of transfection (1×10⁵ cells/well seeded for Huh7 and Vero cells and 2×10⁵ cells/well seeded for 293T, HeLa, BSRT7/5, U20S, and RoNi/7.1 cells). Each well was transfected with 125 ng pCAGGS-NP, 125 ng pCAGGS-VP35, 50 ng pCAGGS-VP30, 50 ng of pMIR-beta galactosidase (pMIR β-gal), 500 ng pCAGGS-L or pCAGGS-Lsynth−, and 750 ng of either the T7 or pol II minigenome plasmid, unless otherwise indicated. Cells transfected with the T7 minigenome were also transfected with 500 ng of pCAGGS-T7 to facilitate initial minigenome transcription. To transfect cells with the minigenome system components for drug screening, the transfection reagent polyethylenimine HCl MAX (PEI, Polysciences, Inc.) was used. Briefly, one day prior to transfection, 2×10⁶ 293T cells were seeded in T75 tissue culture flasks so that they were 70–80% confluent at the time of transfection. Transfections were performed as described previously (Longo et al., 2013), scaling up for the amount of DNA and using a PEI-to-DNA ratio of 8:1 (132 μL of 7.5 mM PEI and 16.5 μg total DNA per flask). Plasmid amounts for transfection of T75 flasks were as follows: 1.25 μg pCAGGS-NP, 1.25 μg pCAGGS-VP35, 0.5 μg pCAGGS-VP30, 5 μg of pCAGGS-L or pCAGGS-Lsynth− as indicated, and 7.5 ug of pol II minigenome plasmid. Six hours post transfection, cells were trypsinized and seeded in 96-well tissue culture plates at 2×10⁴ cells/well.
2.4. Measuring minigenome activity
Minigenome activity was assayed either by examining eGFP expression using a fluorescent microscope or measuring luciferase activity at the indicated time points post transfection using the Luciferase Assay System (Promega). Samples were diluted in 1× cell lysis buffer (Promega) as needed. To account for potential differences in transfection efficiency, luciferase values were normalized to β-gal values (Promega). Luciferase activity of samples from 96-well plates was assayed using Firefly Luc Assay reagent (NanoLight Technology). Luciferase values were calculated as fold induction over the Lsynth− values. Standard error of the mean (SEM) values and paired, two-tailed t tests for all figures were calculated using GraphPad Prism software.
2.5 Drug treatment and Z-factor calculation
Hsp70-inhibitor JG40 was added either at the time of re-seeding (6 hours post transfection) or at 24 hours post transfection, at the indicated concentrations. Cells were harvested for minigenome activity at 72 hours post transfection. Proton nuclear magnetic resonance and tandem mass spectrometry were used to confirm the identity of JG40 and high-performance liquid chromatography to assure purity (>95%) (Li et al., 2013; Taguwa et al., 2015).
Z-factor values for each plate were calculated using the equation Z-factor = 1 − [(3σc+ + 3σc−)/(|μc+ − μC−|)] (Zhang et al., 1999). The positive control contained all components of the polymerase complex. The negative controls expressed all components of the polymerase complex with the following exceptions: expressing a catalytically deficient L (Lsynth−), lacking L (minus L), or lacking VP35 (minus VP35).
3. Results and Discussion
3.1 Comparison of pol II and T7 minigenome systems in 29 3T cells
To generate a pol II-driven EBOV minigenome, we inserted the EBOV minigenome sequence flanked by HDV and hammerhead ribozyme sequences in vector pcDNA3 under the control of the CMV promoter. However, when tested for their activity in the minigenome assay, these first-generation pol II minigenomes were found to be inferior compared to the T7 system (data not shown). A possible explanation for this result is that pol II-dependent minigenome expression from the pcDNA3 vector is not sufficient to jump-start the minigenome system. To boost pol II-dependent minigenome expression, we inserted the minigenome sequence including the flanking ribozymes into the pCAGGS expression vector under the control of the highly active CAG promoter that combines the CMV-IE enhancer with the chicken β-actin promoter (Niwa et al., 1991) (Figure 1). Activity of this second-generation EBOV pol II minigenome system was then compared to the established T7 system. 293T cells were transfected with pCAGGS EBOV support plasmids encoding NP, VP35, VP30, and L in addition to increasing amounts of either the pol II- or T7-driven EBOV minigenome plasmids containing an eGFP reporter gene. For the T7 system, pCAGGS-T7 was also added to the transfection mixture. As a negative control, the plasmid encoding the functional L protein was replaced with a plasmid coding for a replication-deficient version of L (Lsynth−). Live cell fluorescence microcopy was performed at one, two and three days post transfection for each system, using eGFP fluorescence as an indicator of efficient minigenome activity. At all time points examined, the T7 minigenome system showed the greatest activity when 750 ng of the minigenome plasmid were used (Figure 2A). In contrast, the pol II minigenome system showed considerable activity when as little as 100 ng of minigenome DNA were transfected (Figure 2B). Similar to the T7 minigenome system, expression of eGFP was highest at three days post transfection. The requirement for less plasmid DNA per transfection might improve the transfection efficiency and thus reproducibility, making the pol II system an attractive system to monitor EBOV replication and transcription.
Figure 1. Cloning of the pol II EBOV minigenome in pCAGGS.
The minigenome sequence is flanked by two ribozymes. HH rib, hammerhead ribozyme; HDV rib, hepatitis delta ribozyme. Transcription of the minigenome by pol II leads to the production of negative-sense minigenomes. The EBOV leader and trailer regions are shown as dark gray boxes. The gene start signal is shown as a white triangle and the gene end (GE) signal as a white box. eGFP is shown as an example reporter gene in the green box. eGFP is flanked by the 3′ UTR of NP (negative sense) and the 5′ UTR of L (negative sense) as shown in light gray boxes (not to scale).
Figure 2. Comparison of the T7 and pol II eGFP minigenome systems.
293T cells were transfected with the indicated concentrations of either the T7 (A) or pol II (B) driven minigenome system along with the necessary support plasmids. As a negative control, cells were co-transfected with a plasmid encoding inactive L (Lsynth−) in place of the plasmid encoding the functional L. Images are representative of eGFP expression (shown in green) monitored at one, two, and three days post transfection (DPT) from two independent experiments.
To more quantitatively compare the efficiency of the pol II and T7 minigenome systems, firefly luciferase based minigenome systems were used. 293T cells were transfected with different amounts of the indicated luciferase minigenome plasmids concurrently with the EBOV pCAGGS support plasmids, a pCAGGS T7 plasmid for wells transfected with the T7 minigenome plasmid, and a pMIR-β-gal plasmid as a transfection control. At one, two, and three days post transfection, cells were lysed and luciferase activity was measured (Figure 3). When 50 or 250 ng of the pol II minigenome plasmid were transfected, luciferase activity significantly above that of the negative control was detected (Figure 3A and B, black bars). However, using these same concentration of minigenome plasmid for the T7 system, luciferase activity was at or only slightly above that of the negative control (Figure 3A and B, gray bars). When 750 ng of minigenome DNA were used, the T7 system was more efficient than the pol II system, especially at two days post transfection (Figure 3C). Taken together, these data show that the pol II system is highly efficient in 293T cells, even when low minigenome plasmid amounts are used for transfection.
Figure 3. Comparison of the T7 and Pol II luciferase minigenome systems.
293T cells were transfected with 50 ng (A), 250 ng (B), or 750 ng (C) of either the T7 or pol II promoter driven minigenome plasmids containing the firefly luciferase reporter gene along with the necessary support plasmids. As a negative control, cells were co-transfected with a plasmid encoding inactive L (Lsynth−) in place of the functional L plasmid. Luciferase activity of cells transfected with the Lsynth− mutant was set as background activity. As a transfection efficiency control, the cells were also transfected with pMIR β-gal. Luciferase activity was normalized to beta-galactosidase activity. Data from two independent experiments, each done in triplicate are represented as fold induction of minigenome activity (as indicated by luciferase activity) with standard error of the mean (SEM) compared to the negative control (Lsynth−).
3.2 The EBOV pol II minigenome system works efficiently in six cell lines from four different species
One drawback of the T7 minigenome system is that expressing T7 in different cell types can be challenging. For example, our attempts to establish a reliable T7-based filoviral minigenome systems in a fruit bat cell line, the Rousettus aegyptiacus cell line RoNi/7.1 (Kuhl et al., 2011), failed because we were not able to express plasmid-encoded T7 in these cells (data not shown). Because fruit bats are a suspected reservoir species for EBOV (Leroy et al., 2005), bat cell-based minigenome assays would be highly beneficial for filovirus research. Attempts to express T7 in the RoNi/7.1 cells via the replication-deficient vaccinia virus MVA-T7 (Sutter et al., 1995) resulted in a severe cytopathic effect (CPE) and cell death one day after infection (Supplemental Figure 1), similar to results reported for another R. aegyptiacus cell line (Jordan et al., 2009). This does not provide enough time to perform minigenome assays. Together, these data indicate that the T7 minigenome system is not well suited for use in R. aegyptiacus cells.
We next examined if the pol II minigenome system could be used in a wider range of cell lines, particularly those that are more difficult to transfect or are not compatible with T7 expression such as the RoNi/7.1 cell line. Six different cell lines from four different species, including Egyptian rousette (RoNi/7.1), African green monkey (Vero), hamster (BSR-T7/5), and human (U2OS, Huh7, and HeLa) were transfected with either the T7- or pol II-driven luciferase minigenome components. For this set of experiments, we used 750 ng of each individual minigenome plasmid to ensure sufficient T7 minigenome activity. At two days post transfection, cells were lysed and luciferase activity was measured. Based on statistically significant differences, the T7 and pol II minigenome systems worked equally well in three cell lines, while the T7 system worked better in U2OS cells and the pol II minigenome system worked better in RoNi/7.1, and, unexpectedly, BSR-T7/5 cells (Figure 4). In the cell lines transfected with the pol II minigenome system, the luciferase activity was induced in the range of approximately 50-fold (U2OS cells) to 2,900-fold (Vero cells) over a negative control. Intriguingly, there was an approximately 50-fold induction of luciferase activity in the RoNi/7.1 cell line transfected with the pol II minigenome. There was much more variability in the T7 minigenome system, ranging from an approximately 5-fold increase in reporter gene expression (RoNi/7.1 cells) to 370-fold (Huh7 cells). In summary, our results indicate that the pol II system is better suited for use in a wider range of cell lines, particularly those that are more difficult to transfect. This opens up new opportunities to study EBOV replication mechanisms in cell lines obtained from potential reservoir species that are refractory to T7 expression.
Figure 4. Comparison of pol II and T7 minigenomes in 6 different cell lines.
The indicated cell lines were transfected with 750 ng of either the T7 or pol II promoter driven minigenome plasmids containing the firefly luciferase reporter gene along with the necessary support plasmids as in figure 3. Data from three independent experiments, each done in triplicate are represented as fold induction of minigenome activity (as indicated by luciferase activity) compared to the negative control (Lsynth−). Significance was determined using a paired, two-tailed t test; * p < 0.05; *** p < 0.0005.
3.3 The EBOV pol II minigenome system as a tool for antiviral drug screening
One of the many benefits of using minigenome systems is to screen for potential antivirals or therapeutics. To determine if the pol II minigenome system could be used for antiviral drug screening, 293T cells were transfected in a T75 flask with the components of the pol II luciferase minigenome system and reseeded into 96-well plates. To test the system, we used the allosteric heat shock protein 70 (Hsp70) inhibitor JG40, which has broad-spectrum antiviral activity against various pathogenic flaviviruses (Taguwa et al., 2015), but has not previously been tested as an EBOV inhibitor. Importantly, VER-15508, another Hsp70 inhibitor, has been shown to inhibit EBOV minigenome activity (Garcia-Dorival et al., 2016), and depletion of BiP/GRP78, an ER-resident Hsp70, by siRNA greatly inhibited both EBOV and MARV replication (Spurgers et al., 2010). Drug added at 24 hours post transfection induced little to no change in luciferase activity at all concentrations tested (Figure 5A). However, when JG40 was added at a final concentration of 5 mM at 6 hours post transfection, it decreased luciferase activity more than 5-fold compared to untreated cells. Combined with previous data (Garcia-Dorival et al., 2016; Spurgers et al., 2010) our results further highlight the need for more research into the potential for Hsp70 as a target for the development of filovirus therapeutics. Indeed, Hsp70 inhibitors would be intriguing targets for anti-filovirus drugs since they inhibit cellular components, making it more difficult for escape mutants to arise. In addition, Hsp70 inhibitors have already been used in human preclinical and clinical trials to treat cancer and Alzheimer’s disease have exhibited good tolerability with few associated side effects (Evans et al., 2010; Goloudina et al., 2012).
Figure 5. Identification of an EBOV replication inhibitor using the pol II minigenome system in an antiviral drug screen.
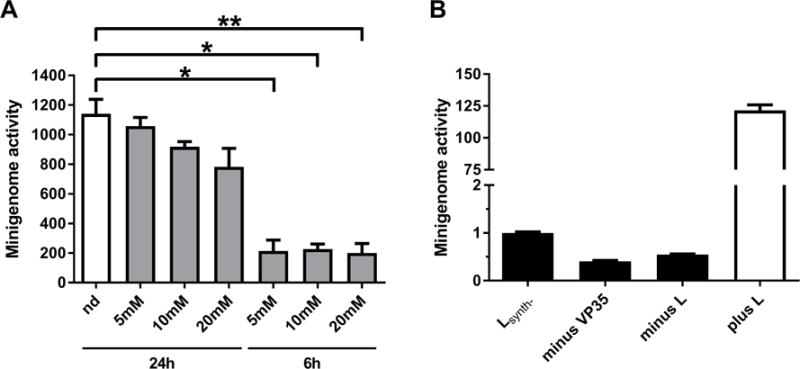
293T cells were transfected with the pol II minigenome plasmid containing the firefly luciferase reporter gene and support plasmids and plated in a 96-well plate at 6 h post transfection. (A) Cells were either left untreated (nd) or were treated with JG40 at the indicated concentrations and time points post transfection. At two days post transfection, cell lysates were harvested and luciferase assays were performed. Data from three independent experiments are shown as a mean fold induction of luciferase activity divided by the negative control (expressing Lsynth− instead of L), with standard error of the mean (SEM) for 6 wells for each condition. Significance was determined using a paired, two-tailed t test; * p < 0.05; ** p < 0.005. (B) Cells were transfected as in (A) but with three separate negative controls; one containing a catalytically inactive L instead of L (Lsynth−), one lacking L (minus L), and one lacking VP35 (minus VP35). Data from three independent experiments are represented as in (A).
Next, we tested if the pol II minigenome system could be reliably used for antiviral drug screens. The Z-factor is a commonly used metric to measure the robustness of high-throughput screening assays which relies on four measurements: the means and standard deviations of the assay’s positive and negative controls (Zhang et al., 1999). Z-factors generally range in value from −1 to 1, where a value of 1 represents an ideal assay. Any value 0.5 or above is indicative of a high-quality assay (Zhang et al., 1999).
Because half of the measurements involved in calculating a system’s Z-factor are derived from the system’s negative controls, the choice of a suitable negative control is important. High-throughput assays using filovirus minigenome systems have been used with a variety of negative controls, including not expressing VP35 (Edwards et al., 2015) or not expressing L (Uebelhoer et al., 2014). To examine if the choice of the negative control affects the efficiency and reliability of the pol II minigenome system in a 96-well format, we compared different negative controls, including minus L, minus VP35 and Lsynth−. Lsynth− had the highest background amongst the negative controls, approximately 2.5-fold higher than the minus VP35 control and 1.8-fold higher than the minus L control (Figure 5B). The slightly higher activity of the Lsynth− compared to the minus L control might be due to a miniscule amount of residual polymerase activity in the L mutant. Of note, VP35 is not only a cofactor of the EBOV polymerase, it also blocks activation of the double-stranded RNA-dependent protein kinase PKR, leading to enhanced translation of ectopic proteins (Feng et al., 2007; Gantke et al., 2013; Schümann et al., 2009). An interesting possibility is that the lower reporter gene activity in the minus VP35 control is due to the lack of translational enhancement of non-specific reporter gene activity.
Use of the pol II minigenome 96-well format resulted in a robust assay with a Z-factor of 0.74, regardless of the negative control used (Figure 5B), similar to or better than established EBOV minigenome systems (Edwards et al., 2015; Jasenosky et al., 2010; Uebelhoer et al., 2014). Due to the large-scale transfections and subsequent re-seeding of the cells, this system assures consistent well-to-well transfection efficiency, as also observed for other minigenome-based antiviral drug screening platforms (Edwards et al., 2015; Jasenosky et al., 2010; Uebelhoer et al., 2014). Our data therefore indicate that the newly established pol II-based EBOV minigenome system is improved and reliable, making it an ideal tool for antiviral drug screening. Large-scale transfections using the highly effective and inexpensive transfection reagent PEI represent an attractive and intriguing prospect for the development of high-throughput minigenome assay screens. Future studies will reveal the potential of this system to be used in high-throughput formats such as the 384-well format.
Supplementary Material
293T and RoNi/7.1 cells were infected with modified vaccinia Ankara expressing T7 (MVA-T7) at an MOI of 5 in three independent experiments. Representative 40x brightfield images of uninfected (mock) and MVA-T7-infected cells were taken at 24 h post infection, with magnified insets (2× magnification) to more clearly see cell morphology.
An RNA polymerase II driven Ebola virus minigenome system was developed to improve upon established T7 driven systems.
The pol II system is efficient and more versatile than the T7 systems, with applications in a wider range of cell types.
It provides a biologically relevant tool for studying Ebola virus replication and transcription.
It can be scaled up easily for use in cost effective antiviral drug screens.
Acknowledgments
The authors thank U. J. Buchholz, NIAID/NIH, Bethesda, MD for providing BSRT7/5 cells, J. Alonso, Texas Biomedical Research Institute, San Antonio, TX for sharing Huh7 cells, T. Takimoto, St. Jude Children’s Research Hospital, Memphis, TN and Y. Kawaoka, University of Wisconsin, Madison, WI for providing pCAGGS-T7 plasmid, and R. Fearns, Boston University, Boston, MA for sharing MVA-T7 virus stocks. The Rousettus aegyptiacus cell line RoNi/7.1 was generated by M. A. Müller and C. Drosten, University of Bonn Medical Centre, Bonn, Germany with funds from the EU-FP7 ANTIGONE (no. 278976) framework and the German Research Council (DR 772/10-2). Inhibitor JG40 was a kind gift from J. Gestwicki, University of California, San Francisco, CA.
This work was funded by the Defense Threat Reduction Agency (DTRA) grant HDTRA1-14-1-0016 (PI G. Palacios), by the National Institute of Allergy and Infectious Diseases of the National Institutes of Health under award numbers R21-AI126457, R03-AI114293 and UC6AI058618. The funders had no role in study design, data collection and analysis, decision to publish, or preparation of the manuscript.
Footnotes
Publisher's Disclaimer: This is a PDF file of an unedited manuscript that has been accepted for publication. As a service to our customers we are providing this early version of the manuscript. The manuscript will undergo copyediting, typesetting, and review of the resulting proof before it is published in its final citable form. Please note that during the production process errors may be discovered which could affect the content, and all legal disclaimers that apply to the journal pertain.
References
- Brauburger K, Boehmann Y, Krahling V, Muhlberger E. Transcriptional Regulation in Ebola Virus: Effects of Gene Border Structure and Regulatory Elements on Gene Expression and Polymerase Scanning Behavior. J Virol. 2015a;90:1898–1909. doi: 10.1128/JVI.02341-15. [DOI] [PMC free article] [PubMed] [Google Scholar]
- Brauburger K, Boehmann Y, Tsuda Y, Hoenen T, Olejnik J, Schumann M, Ebihara H, Muhlberger E. Analysis of the highly diverse gene borders in Ebola virus reveals a distinct mechanism of transcriptional regulation. J Virol. 2014;88:12558–12571. doi: 10.1128/JVI.01863-14. [DOI] [PMC free article] [PubMed] [Google Scholar]
- Brauburger K, Deflubé LR, Mühlberger E. Filovirus Transcription and Replication. In: Pattnaik AK, Whitt MA, editors. Biology and Pathogenesis of Rhabdo-and Filoviruses. World Scientific Publishing Co Pte Ltd; Singapore: 2015b. pp. 515–5555. [Google Scholar]
- Buchholz UJ, Finke S, Conzelmann KK. Generation of bovine respiratory syncytial virus (BRSV) from cDNA: BRSV NS2 is not essential for virus replication in tissue culture, and the human RSV leader region acts as a functional BRSV genome promoter. J Virol. 1999;73:251–259. doi: 10.1128/jvi.73.1.251-259.1999. [DOI] [PMC free article] [PubMed] [Google Scholar]
- Butler JE, Kadonaga JT. The RNA polymerase II core promoter: a key component in the regulation of gene expression. Genes Dev. 2002;16:2583–2592. doi: 10.1101/gad.1026202. [DOI] [PubMed] [Google Scholar]
- Collins PL, Mink MA, Stec DS. Rescue of synthetic analogs of respiratory syncytial virus genomic RNA and effect of truncations and mutations on the expression of a foreign reporter gene. Proc Natl Acad Sci U S A. 1991;88:9663–9667. doi: 10.1073/pnas.88.21.9663. [DOI] [PMC free article] [PubMed] [Google Scholar]
- Conzelmann KK, Schnell M. Rescue of synthetic genomic RNA analogs of rabies virus by plasmid-encoded proteins. J Virol. 1994;68:713–719. doi: 10.1128/jvi.68.2.713-719.1994. [DOI] [PMC free article] [PubMed] [Google Scholar]
- Edwards MR, Pietzsch C, Vausselin T, Shaw ML, Bukreyev A, Basler CF. High-Throughput Minigenome System for Identifying Small-Molecule Inhibitors of Ebola Virus Replication. ACS infectious diseases. 2015;1:380–387. doi: 10.1021/acsinfecdis.5b00053. [DOI] [PMC free article] [PubMed] [Google Scholar]
- Enterlein S, Warfield KL, Swenson DL, Stein DA, Smith JL, Gamble CS, Kroeker AD, Iversen PL, Bavari S, Mühlberger E. VP35 knockdown inhibits Ebola virus amplification and protects against lethal infection in mice. Antimicrob Agents Chemother. 2006;50:984–993. doi: 10.1128/AAC.50.3.984-993.2006. [DOI] [PMC free article] [PubMed] [Google Scholar]
- Evans CG, Chang L, Gestwicki JE. Heat shock protein 70 (hsp70) as an emerging drug target. J Med Chem. 2010;53:4585–4602. doi: 10.1021/jm100054f. [DOI] [PMC free article] [PubMed] [Google Scholar]
- Feng Z, Cerveny M, Yan Z, He B. The VP35 protein of Ebola virus inhibits the antiviral effect mediated by double-stranded RNA-dependent protein kinase PKR. J Virol. 2007;81:182–192. doi: 10.1128/JVI.01006-06. [DOI] [PMC free article] [PubMed] [Google Scholar]
- Filone CM, Hodges EN, Honeyman B, Bushkin GG, Boyd K, Platt A, Ni F, Strom K, Hensley L, Snyder JK, Connor JH. Identification of a broad-spectrum inhibitor of viral RNA synthesis: validation of a prototype virus-based approach. Chem Biol. 2013;20:424–433. doi: 10.1016/j.chembiol.2013.02.011. [DOI] [PMC free article] [PubMed] [Google Scholar]
- Freiberg A, Dolores LK, Enterlein S, Flick R. Establishment and characterization of plasmid-driven minigenome rescue systems for Nipah virus: RNA polymerase I- and T7-catalyzed generation of functional paramyxoviral RNA. Virology. 2008;370:33–44. doi: 10.1016/j.virol.2007.08.008. [DOI] [PMC free article] [PubMed] [Google Scholar]
- Gantke T, Boussouf S, Janzen J, Morrice NA, Howell S, Muhlberger E, Ley SC. Ebola virus VP35 induces high-level production of recombinant TPL-2-ABIN-2-NF-kappaB1 p105 complex in co-transfected HEK-293 cells. Biochem J. 2013;452:359–365. doi: 10.1042/BJ20121873. [DOI] [PMC free article] [PubMed] [Google Scholar]
- Garcia-Dorival I, Wu W, Armstrong SD, Barr JN, Carroll MW, Hewson R, Hiscox JA. Elucidation of the Cellular Interactome of Ebola Virus Nucleoprotein and Identification of Therapeutic Targets. J Proteome Res. 2016;15:4290–4303. doi: 10.1021/acs.jproteome.6b00337. [DOI] [PubMed] [Google Scholar]
- Ghanem A, Kern A, Conzelmann KK. Significantly improved rescue of rabies virus from cDNA plasmids. Eur J Cell Biol. 2012;91:10–16. doi: 10.1016/j.ejcb.2011.01.008. [DOI] [PubMed] [Google Scholar]
- Goloudina AR, Demidov ON, Garrido C. Inhibition of HSP70: a challenging anti-cancer strategy. Cancer Lett. 2012;325:117–124. doi: 10.1016/j.canlet.2012.06.003. [DOI] [PubMed] [Google Scholar]
- Groseth A, Feldmann H, Theriault S, Mehmetoglu G, Flick R. RNA polymerase I-driven minigenome system for Ebola viruses. J Virol. 2005;79:4425–4433. doi: 10.1128/JVI.79.7.4425-4433.2005. [DOI] [PMC free article] [PubMed] [Google Scholar]
- Heix J, Grummt I. Species specificity of transcription by RNA polymerase I. Curr Opin Genet Dev. 1995;5:652–656. doi: 10.1016/0959-437x(95)80035-2. [DOI] [PubMed] [Google Scholar]
- Hoenen T, Groseth A, de Kok-Mercado F, Kuhn JH, Wahl-Jensen V. Minigenomes, transcription and replication competent virus-like particles and beyond: reverse genetics systems for filoviruses and other negative stranded hemorrhagic fever viruses. Antiviral Res. 2011;91:195–208. doi: 10.1016/j.antiviral.2011.06.003. [DOI] [PMC free article] [PubMed] [Google Scholar]
- Inoue K, Shoji Y, Kurane I, Iijima T, Sakai T, Morimoto K. An improved method for recovering rabies virus from cloned cDNA. J Virol Methods. 2003;107:229–236. doi: 10.1016/s0166-0934(02)00249-5. [DOI] [PubMed] [Google Scholar]
- Ito N, Takayama-Ito M, Yamada K, Hosokawa J, Sugiyama M, Minamoto N. Improved recovery of rabies virus from cloned cDNA using a vaccinia virus-free reverse genetics system. Microbiol Immunol. 2003;47:613–617. doi: 10.1111/j.1348-0421.2003.tb03424.x. [DOI] [PubMed] [Google Scholar]
- Jasenosky LD, Neumann G, Kawaoka Y. Minigenome-based reporter system suitable for high-throughput screening of compounds able to inhibit Ebolavirus replication and/or transcription. Antimicrob Agents Chemother. 2010;54:3007–3010. doi: 10.1128/AAC.00138-10. [DOI] [PMC free article] [PubMed] [Google Scholar]
- Jordan I, Horn D, Oehmke S, Leendertz FH, Sandig V. Cell lines from the Egyptian fruit bat are permissive for modified vaccinia Ankara. Virus Res. 2009;145:54–62. doi: 10.1016/j.virusres.2009.06.007. [DOI] [PMC free article] [PubMed] [Google Scholar]
- Kuhl A, Hoffmann M, Muller MA, Munster VJ, Gnirss K, Kiene M, Tsegaye TS, Behrens G, Herrler G, Feldmann H, Drosten C, Pohlmann S. Comparative analysis of Ebola virus glycoprotein interactions with human and bat cells. J Infect Dis. 2011;204(Suppl 3):S840–849. doi: 10.1093/infdis/jir306. [DOI] [PMC free article] [PubMed] [Google Scholar]
- Leroy EM, Kumulungui B, Pourrut X, Rouquet P, Hassanin A, Yaba P, Delicat A, Paweska JT, Gonzalez JP, Swanepoel R. Fruit bats as reservoirs of Ebola virus. Nature. 2005;438:575–576. doi: 10.1038/438575a. [DOI] [PubMed] [Google Scholar]
- Li X, Srinivasan SR, Connarn J, Ahmad A, Young ZT, Kabza AM, Zuiderweg ER, Sun D, Gestwicki JE. Analogs of the Allosteric Heat Shock Protein 70 (Hsp70) Inhibitor, MKT-077, as Anti-Cancer Agents. ACS Med Chem Lett. 2013;4 doi: 10.1021/ml400204n. [DOI] [PMC free article] [PubMed] [Google Scholar]
- Longo PA, Kavran JM, Kim MS, Leahy DJ. Transient mammalian cell transfection with polyethylenimine (PEI) Methods Enzymol. 2013;529:227–240. doi: 10.1016/B978-0-12-418687-3.00018-5. [DOI] [PMC free article] [PubMed] [Google Scholar]
- Martin A, Staeheli P, Schneider U. RNA polymerase II-controlled expression of antigenomic RNA enhances the rescue efficacies of two different members of the Mononegavirales independently of the site of viral genome replication. J Virol. 2006;80:5708–5715. doi: 10.1128/JVI.02389-05. [DOI] [PMC free article] [PubMed] [Google Scholar]
- Mühlberger E. Filovirus replication and transcription. Future Virol. 2007;2:205–215. doi: 10.2217/17460794.2.2.205. [DOI] [PMC free article] [PubMed] [Google Scholar]
- Mühlberger E, Lötfering B, Klenk HD, Becker S. Three of the four nucleocapsid proteins of Marburg virus, NP, VP35, and L, are sufficient to mediate replication and transcription of Marburg virus-specific monocistronic minigenomes. J Virol. 1998;72:8756–8764. doi: 10.1128/jvi.72.11.8756-8764.1998. [DOI] [PMC free article] [PubMed] [Google Scholar]
- Mühlberger E, Weik M, Volchkov VE, Klenk HD, Becker S. Comparison of the transcription and replication strategies of marburg virus and Ebola virus by using artificial replication systems. J Virol. 1999;73:2333–2342. doi: 10.1128/jvi.73.3.2333-2342.1999. [DOI] [PMC free article] [PubMed] [Google Scholar]
- Niwa H, Yamamura K, Miyazaki J. Efficient selection for high-expression transfectants with a novel eukaryotic vector. Gene. 1991;108:193–199. doi: 10.1016/0378-1119(91)90434-d. [DOI] [PubMed] [Google Scholar]
- Olsen ME, Filone CM, Rozelle D, Mire CE, Agans KN, Hensley L, Connor JH. Polyamines and Hypusination Are Required for Ebolavirus Gene Expression and Replication. MBio. 2016;7 doi: 10.1128/mBio.00882-16. [DOI] [PMC free article] [PubMed] [Google Scholar]
- Pattnaik AK, Ball LA, LeGrone AW, Wertz GW. Infectious defective interfering particles of VSV from transcripts of a cDNA clone. Cell. 1992;69:1011–1020. doi: 10.1016/0092-8674(92)90619-n. [DOI] [PubMed] [Google Scholar]
- Perez M, Sanchez A, Cubitt B, Rosario D, de la Torre JC. A reverse genetics system for Borna disease virus. J Gen Virol. 2003;84:3099–3104. doi: 10.1099/vir.0.19467-0. [DOI] [PubMed] [Google Scholar]
- Rougeron V, Feldmann H, Grard G, Becker S, Leroy EM. Ebola and Marburg haemorrhagic fever. Journal of clinical virology: the official publication of the Pan American Society for Clinical Virology. 2015;64:111–119. doi: 10.1016/j.jcv.2015.01.014. [DOI] [PMC free article] [PubMed] [Google Scholar]
- Schümann M, Gantke T, Mühlberger E. Ebola virus VP35 antagonizes PKR activity through its C-terminal interferon inhibitory domain. J Virol. 2009;83:8993–8997. doi: 10.1128/JVI.00523-09. [DOI] [PMC free article] [PubMed] [Google Scholar]
- Spurgers KB, Alefantis T, Peyser BD, Ruthel GT, Bergeron AA, Costantino JA, Enterlein S, Kota KP, Boltz RC, Aman MJ, Delvecchio VG, Bavari S. Identification of essential filovirion-associated host factors by serial proteomic analysis and RNAi screen. Mol Cell Proteomics. 2010;9:2690–2703. doi: 10.1074/mcp.M110.003418. [DOI] [PMC free article] [PubMed] [Google Scholar]
- Sutter G, Ohlmann M, Erfle V. Non-replicating vaccinia vector efficiently expresses bacteriophage T7 RNA polymerase. FEBS Lett. 1995;371:9–12. doi: 10.1016/0014-5793(95)00843-x. [DOI] [PubMed] [Google Scholar]
- Taguwa S, Maringer K, Li X, Bernal-Rubio D, Rauch JN, Gestwicki JE, Andino R, Fernandez-Sesma A, Frydman J. Defining Hsp70 Subnetworks in Dengue Virus Replication Reveals Key Vulnerability in Flavivirus Infection. Cell. 2015;163:1108–1123. doi: 10.1016/j.cell.2015.10.046. [DOI] [PMC free article] [PubMed] [Google Scholar]
- Trunschke M, Conrad D, Enterlein S, Olejnik J, Brauburger K, Mühlberger E. The L-VP35 and L-L interaction domains reside in the amino terminus of the Ebola virus L protein and are potential targets for antivirals. Virology. 2013;441:135–145. doi: 10.1016/j.virol.2013.03.013. [DOI] [PMC free article] [PubMed] [Google Scholar]
- Uebelhoer LS, Albarino CG, McMullan LK, Chakrabarti AK, Vincent JP, Nichol ST, Towner JS. High-throughput, luciferase-based reverse genetics systems for identifying inhibitors of Marburg and Ebola viruses. Antiviral Res. 2014;106:86–94. doi: 10.1016/j.antiviral.2014.03.018. [DOI] [PubMed] [Google Scholar]
- Watanabe S, Watanabe T, Noda T, Takada A, Feldmann H, Jasenosky LD, Kawaoka Y. Production of novel ebola virus-like particles from cDNAs: an alternative to ebola virus generation by reverse genetics. J Virol. 2004;78:999–1005. doi: 10.1128/JVI.78.2.999-1005.2004. [DOI] [PMC free article] [PubMed] [Google Scholar]
- Yanai H, Hayashi Y, Watanabe Y, Ohtaki N, Kobayashi T, Nozaki Y, Ikuta K, Tomonaga K. Development of a novel Borna disease virus reverse genetics system using RNA polymerase II promoter and SV40 nuclear import signal. Microbes Infect. 2006;8:1522–1529. doi: 10.1016/j.micinf.2006.01.010. [DOI] [PubMed] [Google Scholar]
- Zhang JH, Chung TD, Oldenburg KR. A Simple Statistical Parameter for Use in Evaluation and Validation of High Throughput Screening Assays. J Biomol Screen. 1999;4:67–73. doi: 10.1177/108705719900400206. [DOI] [PubMed] [Google Scholar]
Associated Data
This section collects any data citations, data availability statements, or supplementary materials included in this article.
Supplementary Materials
293T and RoNi/7.1 cells were infected with modified vaccinia Ankara expressing T7 (MVA-T7) at an MOI of 5 in three independent experiments. Representative 40x brightfield images of uninfected (mock) and MVA-T7-infected cells were taken at 24 h post infection, with magnified insets (2× magnification) to more clearly see cell morphology.