

Abstract
The tetraspanin CD151 is a marker of aggressive cell proliferation and invasiveness for a variety of cancer types. Given reports of CD151 expression on T cells, we explored whether CD151 would mark T cells in a hyper-activated state. Consistent with the idea that CD151 could mark a phenotypically distinct T cell subset, it was not uniformly expressed on T cells. CD151 expression frequency was a function of the T cell lineage (CD8 > CD4) and a function of the memory differentiation state (Tnaive < TCM < TEM < TEMRA). CD151 and CD57, a senescence marker, defined the same CD28− T cell populations. However, CD151 also marked a substantial CD28+ T cell population that was not marked by CD57. Kinome array analysis demonstrated that CD28+CD151+ T cells form a subpopulation with a distinct molecular baseline and activation phenotype. Network analysis of these data revealed that cell cycle control and cell death were the most altered process motifs in CD28+CD151+ T cells. We demonstrate that CD151 in T cells is not a passive marker, but actively changed the cell cycle control and cell death process motifs of T cells. Consistent with these data, long-term T cell culture experiments in the presence of only IL-2 demonstrated that independent of their CD28 expression status, CD151+ T cells, but not CD151− T cells, would exhibit an antigen-independent, hyper-responsive proliferation phenotype. Not unlike its reported function as a tumor aggressiveness marker, CD151 in humans thus marks and enables hyperproliferative T cells.
Keywords: Tetraspanin, CD151, T cells, unchecked proliferation, kinome analysis
INTRODUCTION
T cell homeostasis is essential to maintain the naïve T cell population as well as the T cell populations that constitute our immunological memory (1–4). In healthy individuals, T cell homeostasis is tightly controlled through the integration of a wide variety of mechanisms. Homeostatic T cell proliferation is driven by various combinations of cytokines and low affinity interactions with self-antigen (5–8). Accordingly, known receptors involved in T cell homeostasis include, but are certainly not limited to cytokine receptors such as IL-7R or IL-15R (9), the TCR, as well as co-stimulatory molecules such as CD28. At the cellular level, the involved signaling pathways that transduce these signals into the cells involve a plethora of different proteins, including kinases (10–15) and phosphatases (16–20). Misalignment of any of the components that form this highly complex network can result in increased T cell proliferation, a lowered threshold for antigen activation, or a loss of immune tolerance and the development of autoimmune phenotypes (8, 21, 22). A protein family that has a functional profile compatible with influencing the T cell activation state via their ability to mobilize intracellular T cell signaling molecules would be tetraspanins, but a potential role of tetraspanins in T cell homeostasis or misalignment thereof has not been explored.
In mammalians, tetraspanins are a family of 33 different small proteins with four transmembrane-spanning domains that are known to regulate cell morphology, motility, invasion, fusion and that are involved in cell proliferation and apoptosis in a variety of different cell types (for reviews see (23–28)). Tetraspanins have an exceptional ability to coordinate cell surface molecules laterally binding to other tetraspanins or to other membrane proteins (integrins, CD2, CD4, CD8, CD5, CD19, CD21, Fc receptors, MHC class I and class II) (reviewed in (26)) to form the highly specialized structure known as tetraspanin-enriched microdomains (TEMs) (29, 30) or tetraspanin-webs (31). Tetraspanin, likely as a function of the cell type, have been described to influence Rac, PKC and CDC42 activity (32, 33) or Ras, ERK/MAPK1/2 and protein kinase B (PKB)/Akt signaling (34, 35). Also, PKCα or phosphatidylinositol 4-kinase (PI4K) have been reported to associate closely with certain tetraspanins, including CD9 and CD81 (23, 36, 37).
Some tetraspanins (CD9, CD37, CD81, CD151) have been reported to be expressed on T cells, where their function has mostly been described using knockout mouse models. With only little experimental evidence having been accumulated using human T cells, it nevertheless seems clear that tetraspanins affect T cell activation in ways similar to co-stimulation (25, 38–42). We were particularly interested to detail the role of CD151 in T cell biology, as increased CD151 expression has been associated with aggressive cell proliferation and invasiveness for a variety of different tumor types, suggesting that its altered expression may be linked to a hyperactivated T cell state. For example, increased CD151 expression has been associated with tumor aggressiveness in breast cancer, endometrial cancer, esophageal squamous cell carcinoma, epithelial malignancies, non-small cell lung cancer, pancreatic ductal adenocarcinoma, colon cancer or prostate cancer (43–51). Genetic ablation of CD151 expression has been reported to reduce metastatic spread of cancer, providing functional evidence that increased CD151 expression may actively contribute to this aggressive phenotype (52). In immunology, CD151 has been reported as a negative regulator of FcεRI-mediated mast cell activation (53). On T cells, CD151 has been shown to stabilize the immunological synapse following T cell activation, and silencing of CD151 blunts IL-2 secretion and expression of the activation marker CD69 (54–56). Consistent with previous reports that CD151 interacts and signals in combination with integrins, silencing of CD151 expression also diminished the relocalization of α4β1 integrin to the immunologic synapse (IS), which resulted in reduced phosphorylation of the integrin targets FAK and ERK1/2 (54).
Here we demonstrate that CD151 is expressed on a subset of T cells and once expressed, actively alters the molecular signaling phenotype of these cells. Different from other tetraspanins, such as CD37 or CD81 that are ubiquitously expressed on all T cells, we demonstrate that CD151 on T cells differentially marks specific subpopulations within both CD4 and CD8 lineages and throughout all differentiation states. In line with the role of CD151 as a marker of tumor aggressiveness, we demonstrate that CD151 is involved in active outside-in signaling and that CD151+ T cells exhibit increased proliferative propensity in the absence of antigen-specific TCR activation even in CD28− cells, which are believed to be senescent. Consistent with its role in cancer, CD151 in humans thus marks and enables hyper-responsive T cells. Our data further suggest that in humans, expression of CD151 on selective T cell subsets provides a so far unrecognized component of the signaling network that influences T cell homeostasis.
MATERIALS AND METHODS
Cell culture and isolation of primary peripheral bloods cells
All cells were maintained in RPMI 1640 supplemented with 2 mM L-glutamine, 100 U/ml penicillin, 100 μg/ml streptomycin and 10% heat inactivated fetal bovine serum. Cryopreserved peripheral blood mononuclear cells (PBMC) from healthy adults were obtained through the UAB Clinical Sample Repository, after local institutional review board approval was obtained and all donors had consented to this study. For some of the studies, PBMCs derived from buffy coats were used (Research Blood Components, LLC; Brighton, MA, U.S.A.). PBMCs were isolated from peripheral blood using Ficoll−Paque Plus density gradient centrifugation (GE Healthcare Life Sciences, Uppsala, SE) and were cryopreserved. For the experiments, cryopreserved PBMCs were thawed, counted and assessed for viability with a Guava EasyCyte flow cytometer (EMD Millipore, Billerica, MA). Lymphocyte viability ranged from 85–95%.
Flow cytometric analysis and reagents
LIVE/DEAD™ Fixable Aqua Stain (Invitrogen, Carlsbad, CA) excited by violet 405nm laser and detected by 512nm emission channel, was used to exclude dead cells from analysis. The T cell phenotype was determined by staining with mAbs: CD3-APC efluor780 (UCHT1, eBiosciences, San Diego, CA), CD4-V500 (RPA-T4 or SK3, BD Biosciences, Franklin Lakes, NJ), CD151-phycoerythrin (14A2.H1, BD Biosciences), and CD25-FITC or -APC (M-A251, BD Biosciences). Antibodies recognizing CD45RA-APC ((HI100, BD Biosciences) and CCR7-Percpcy5.5 (150503; BD Biosciences) were used to define naïve T cells (TN: CD45RA+ CCR7+), central memory T cells (TCM: CD45RA− CCR7+), effector memory T cells (TEM: CD45RA− CCR7−) and T effector memory RA−positive cells (TEMRA: CD45RA+ CCR7−). Intracellular staining of the proliferation antigen Ki-67-FITC (B56, BD Biosciences) was performed using the BD Cytofix/Cytoperm kit according to the manufacturer’s protocols. Ki-67 is an intracellular protein that is exclusively expressed in cycling cells in the late G1, G2, S and M-phases, and accordingly, it is absent in resting cells (G0) (57) and is therefore frequently used to detect actively cycling cells. Flow cytometric analysis and cell sorting experiments were performed using an LSR II flow cytometer and FACS ARIA II instrument, respectively (Becton Dickinson). Gates for flow cytometric acquisition and analyses were based on “fluorescence-minus-one” (FMO) controls and single stain compensation controls. Data were analyzed using FlowJo software (Treestar, Ashland, OR).
T cell proliferation assays
For proliferation assays the T cells were labeled with 1 μM carboxyfluorescein succinimidyl ester (CFSE) (Invitrogen). Cells were plated at 5 × 10⁵ cells/well in 96-well flat-bottom plates and incubated for 5 days following addition of IL-2. The extent of T cell proliferation is proportional to the decrease in CFSE-fluorescence, with every cell division decreasing the CFSE fluorescence intensity of the daughter cells by 50%. The frequency of CFSElow T cells was used as a measurement of total T cell proliferation, and flow cytometry gates were set using untreated control conditions as the baseline. For long-term IL-2 culture experiments IL-2 (30 U/mL) was added every 2–3 days and samples were harvested at the indicated time-points of the 31 days experimental period. Upon harvesting, cells were washed, labeled with specific mAbs (CD3, CD4, CD8, CD28 and CD151), and subjected to flow cytometric analysis.
Generation of CD151-overexpressing T cells
The expression plasmid pMSCV-CD151 was constructed by cloning the cDNA sequence coding for human CD151 into a murine stem cell virus-derived retroviral vector (pMSCVpuro; Clontech) using standard PCR techniques (5′Xho1-GAAACTCGAGatgggtgagttcaacgagaagaag; 3′EcoR1-ATTCGAATTCtcagtag-tgctccagcttgagac). pMSCV-CD151 was co-transfected with pHIT60 (gag/pol) and pVSV-G into HEK-293T cells using FuGENE® 6 Transfection Reagent (Promega) to produce retroviral vector particles. Culture supernatants containing retroviral CD151-vector particles were harvested 2 – 4 days post transfection and used to transduce Jurkat CD4+ T cells. Sorted CD151high Jurkat-cells and mock-transduced Jurkat cells were used for subsequent kinome analysis.
Kinex™ Antibody Microarray Analysis
To perform kinome analysis using Kinex™ microarrays, 50 μg of lysate protein from each sample were labeled with a proprietary fluorescent dye according to the manufacturer’s instructions (Kinexus, Canada). The utilized KAM-850 chips were spotted in duplicates with over 850 antibodies: 510 pan-specific antibodies used in the chip allows for the detection of 189 protein kinases, 31 protein phosphatases and 142 regulatory subunits of these enzymes and other cell signaling proteins. 340 phospho-specific antibodies tracked the unique phosphorylation of 128 sites in protein kinases, 4 sites in protein phosphatases and 155 sites in other cell signaling proteins. The background-corrected raw intensity data were logarithmically transformed with base 2. Z scores were calculated by subtracting the overall average intensity of all spots within a sample from the raw intensity for each spot, and Z score ratios were calculated by dividing Z scores by the standard deviations (SD) of all of the measured intensities within each sample. To minimize unspecific background signals, three lysates from Jurkat and three lysates from J-CD151 cells were harvested at different growth stages and were pooled to provide one sample for Jurkat and one sample for J-CD151 cells prior to loading on the Kinexus antibody microarray. The ArrayExpress accession number for the dataset is E-MTAB-5978 (https://www.ebi.ac.uk/arrayexpress/). To minimize unspecific background signals in the kinome analysis of primary T cells, CD4+CD151− and CD4+CD151+ T cells from 5 different healthy donors were each sorted and the lysates from all CD4+CD151− T cells and from all CD4+CD151+ T cells were pooled prior to loading on the Kinexus antibody microarray. The ArrayExpress accession number for the dataset is E-MTAB-5977 (https://www.ebi.ac.uk/arrayexpress/).
All kinome data that were used for GO-motif analysis or to generate protein-protein interaction networks are available in the Supplemental Tables file. GO-motif analysis and protein-protein Interaction Networks (PINs) were generated using MetaCore software (Thomson Reuters). In the presented studies, we exclusively used the MetaCore direct interaction algorithm to link the proteins that were found altered in our kinome array analysis experiments into a network. This algorithm only uses proteins that are uploaded to generate a protein-protein interaction network and does not allow for the computational inclusion of additional proteins during the network generation process. Detailed procedures have been previously described by our group (58).
Of note, to demonstrate that the MetaCore direct interaction algorithm that was used for the analysis of our kinome data cannot produce a network from a list of random genes we attempted to build a network from a list of genes that served as HIV-1 integration sites in patients (59). HIV-1 is known to integrate into actively expressed genes, however, no strong integration site bias has been reported and as such this gene list can be considered random. As seen in Figure 3A, the direct interaction algorithm (or for that matter more complex 1-step or 2-step algorithms) was not able to link this random list of genes into a network.
Figure 3. Protein-protein interaction network describing the altered baseline phenotype of CD151+ T cells.
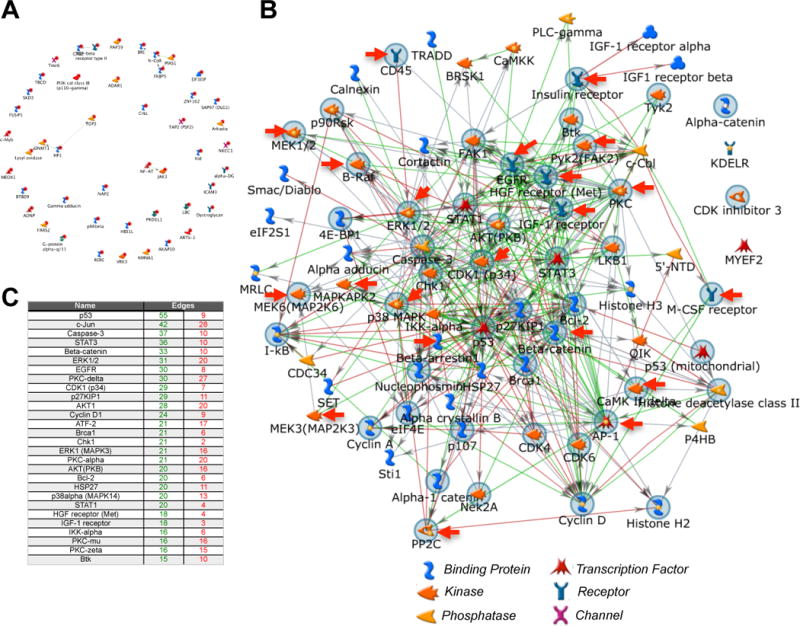
(A) Negative control reference data set for direct interaction algorithm generated networks. HIV-1 is known to integrate into actively expressed genes, however, no strong integration site bias has been reported and as such this gene list can be considered random. The MetaCore direct interaction algorithm that was used for the analysis of our kinome data cannot produce a network from a list of genes that were described as HIV-1 integration sites by Han et al., J Virol. 2004. (B) CD4+ T cells from a total of 5 donors were sorted to obtain CD4+CD151− and CD4+CD151+ T cell populations. To reduce unspecific background signals lysates from the CD151− T cell populations or the CD151+ T cell populations, respectively, were pooled prior to loading the lysate mixes on Kinexus antibody arrays. The proteins that were found differentially expressed or phosphorylated in CD151+ T cells when compared to CD151− T cells were then used as seed nodes to generate a protein-protein interaction network using a direct interaction algorithm in MetaCore. The seed nodes marked by a gray circle indicate altered protein signals associated with a GO enrichment cell proliferation motif. Red arrows indicate seed nodes associated with the MAPK cascade. (C) The table insert lists the key hubs of the network. Edges refer to the number of connections that an individual hub has in the network (green: numbers of outgoing (controlling) connections; red: numbers of incoming (controlled by) connections).
Statistical analysis
Statistical analyses to determine all differences (e.g. CD151 or Ki-67 expression frequency) were performed using a Student’s t-test. Enrichment of CD151 cell surface expression across memory subsets was assessed by repeated measures ANOVA with Bonferroni’s multiple comparisons post-test correction. Correlation analyses for normally distributed CD151 induction data were performed using Pearson’s correlation coefficient. The statistical software used was GraphPad Prism v5.0d (Graphpad Software, La Jolla, CA, USA). p-values for all statistical analyses are depicted as follows: *p<0.05, **p<0.01, ***p<0.001.
RESULTS
CD151 expression patterns as a function of T cell lineage and differentiation state
CD151 has been reported to be uniformly expressed on a variety of cell types. Increased expression levels of CD151 have been associated with a series of cancers and higher CD151 expression levels have been associated with tumor aggressiveness (43–51). As a marker for functionally distinct T cell populations, CD151 would have to be either expressed at different expression levels on distinct populations (high/low) or CD151 would have to be present on distinct T cell subpopulations, independent of the expression level. Given reports that CD151 expression contributes to the stability of the IS (54, 55), we had expected CD151 to be expressed on all T cells, but surprisingly, CD151 marked distinct subpopulations. CD151 was expressed in a lineage dependent manner, with a higher percentage of CD8+ T cells being CD151+ at baseline (~60%; range: 26–82%) than CD4+ T cells (~25%; range: 6–43%) (Figure 1A). To assess CD151 expression frequency as a function of the T cell differentiation state, antibodies recognizing CD45RA and CCR7 were used to define naïve T cells (TN), central memory T cells (TCM), effector memory T cells (TEM) and T effector memory RA-positive cells (TEMRA). As seen in Figure 1B, within each of the two T cell lineages, the CD151 expression frequency increased with the T cell differentiation state. Naïve T cells populations held the lowest number of CD151+ T cells and TEMRA populations were highly CD151+. Given the contribution of the various memory T cell populations to the total CD4+ or CD8+ T cell populations (data not shown) this means that the majority of CD4+CD151+ T cells are either TCM or TEM cells, whereas the majority of CD8+CD151+ T cells are found in the TEM and TEMRA population (Figure 1C). This differential expression of CD151 would allow for the possibility that CD151 marks a particular T cell phenotype that would emerge in the CD4+ and CD8+ T cell lineages and in all memory differentiation states.
Figure 1. CD151 marks T cell populations independent of lineage commitment and memory differentiation state.
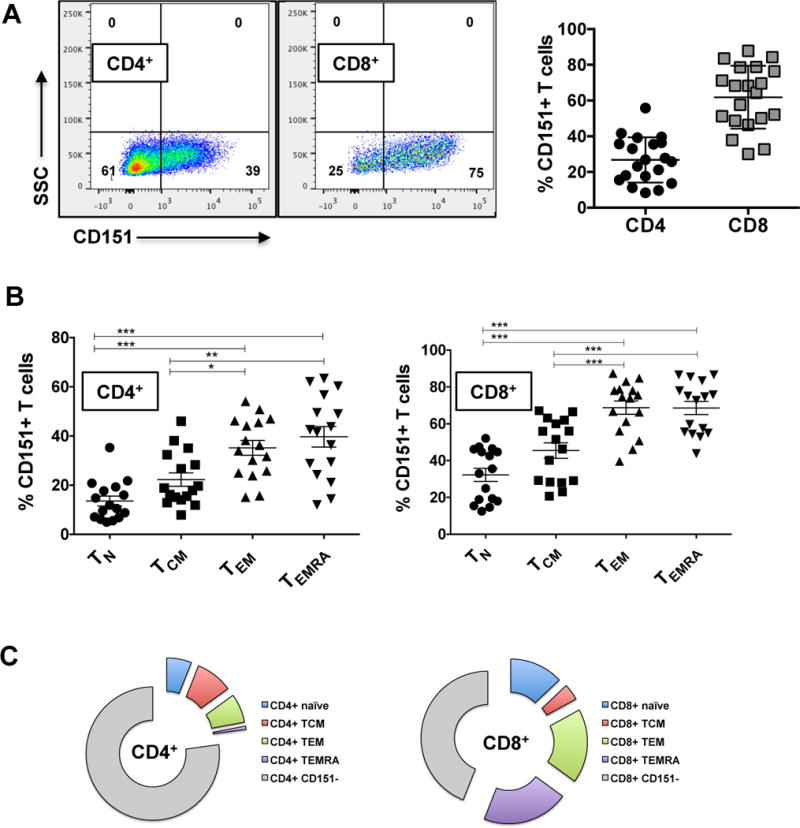
(A) Lineage dependent expression of CD151 was determined by quantifying the percentage of CD4+CD151+ and CD8+CD151+ T cells for a total of 28 healthy human donors. (B) The frequency of CD151+ T cells as a function of the memory differentiation state was determined for a total of 16 healthy donors are shown. T cell subsets are defined by patterns of CD45RA and CCR7 expression: Naïve T cells (TN: CD45RA+ CCR7+), central memory T cells (TCM: CD45RA− CCR7+), effector memory T cells (TEM: CD45RA− CCR7−) and T effector memory RA-positive cells (TEMRA: CD45RA+ CCR7−). A possible association of the percentage of CD151+ T cells with the different memory T cell populations was analyzed using repeated measures ANOVA statistical analysis with a Bonferroni’s multiple comparisons post−test correction. (*p<0.05, **p<0.01, ***p<0.001). (C) Pie charts showing the absolute contributions of the T cell memory subsets to the total CD151+ T cell population.
CD151 expression as a function of CD28 or CD57 expression
To further our contextual understanding of CD151 expression, we next determined CD151 expression on T cells in relation to other key T cell markers that have been associated with defined functional states. Given the increased frequency of CD151 in more differentiated T cell populations, we were particularly interested in the relationship of CD151 with senescence markers. Loss of CD28 expression is considered a hallmark of T cell senescence. We found that CD4+CD28− T cells and CD8+CD28− T cells were mostly CD151+ (Figure 2A) with some variations among donors (Figure 2B). CD151 expression in both CD4+ and CD8+ T cells was also linked to CD57 expression, a positive marker of senescent T cells (60) and CD4+CD57+ and CD8+CD57+ T cell populations were generally found to be CD151+. However, other than CD57, which was mostly expressed on CD28− T cells, CD151 also marked a CD28+ T cell subpopulation, suggesting that CD151 has a unique ability to mark not only “senescent” CD28-CD57+ T cells, but also to resolve the CD28+ T cell population into two, previously unrecognized subpopulations.
Figure 2. CD151 expression marks a unique CD28+ T cell population.
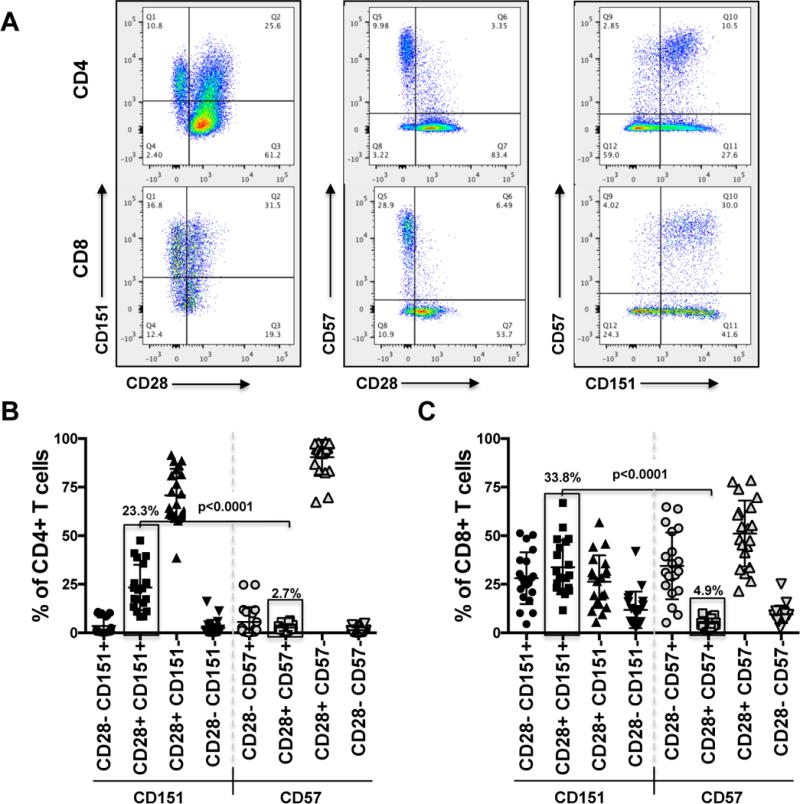
With loss of CD28 and increase in CD57 expression being the classic markers of T cell senescence we detailed the association of these markers with CD151 on CD4+ or CD8+ T cells. (A) Dot plot analysis shows the representative paired cell surface expression patterns of CD28/CD151, CD28/CD57 and CD57/CD151 on CD4+ and CD8+ T cells from a representative donor. (B) CD151 and CD57 expression frequencies on T cells from 20 donors are compared as a function of CD28 expression demonstrating that CD151 marks a CD28+ T cell population that is not recognized by CD57. (C) A similar analysis as in (B) was performed for CD8+ T cells.
The association of CD151 expression with CD28 expression status and CD57 expression with CD28 expression status for a total of 20 donors for CD4+ T cells and CD8+ T cells is shown in Figures 2B and 2C, respectively. The data clearly demonstrate that CD151 also marks a phenotypically non-senescent subpopulation of CD28+CD57− T cells. The size of the CD4+CD28+CD151+ T cell population was on average 23.3% (range: 8–48%), whereas the size of the CD8+CD28+CD151+ T cell population was on average 33.8% (range: 12–67%). The corresponding CD4+CD28+CD57+ and CD8+CD28+CD57+ T cell populations were 2.7% and 4.9% in size, respectively (p<0.0001). These findings imply that while CD151 expression can also be expressed on senescent CD28−CD57+ T cells, rather than being a senescence or exhaustion marker, CD151 seems to provide a unique phenotype or functionality that is shared between senescent and non-senescent T cells.
Kinome array analysis reveals massive differences in the molecular networks controlling CD151+ and CD151− T cells
The T cell population that is resolved only by CD151 and not by the previously described senescence marker CD57 is the CD28+CD151+ population. Therefore, to develop an initial understanding of the molecular biology of T cells that exhibit a CD28+CD151+ phenotype, we used kinome array analysis to describe the system-wide differences in the molecular signaling networks of CD151− and CD151+ T cells. As kinome array analysis requires a high amount of cell material and our data suggested a similar role of CD151 for CD4+ and CD8+ T cells, we opted to sort for CD4+CD151+ and CD4+CD151− T cell populations, which are more abundant than the equivalent CD8+ T cell populations. Cells from 5 healthy donors were obtained, sorted and subjected to kinome array analysis.
To understand baseline differences in the protein networks, we compared the kinomes of CD4+CD151− and CD4+CD151+ T cells (Supplemental Table I). A total of 104 signals were found altered between CD4+CD151− and CD4+CD151+ T cells either at the level of protein expression or phosphorylation. Note that some signals pertain to the same protein as for some proteins several antibody spots are found on the chip. Network analysis using the MetaCore direct interaction algorithm that creates a network using only the objects in the list of altered proteins confirmed the quality of the kinome data. A random list of proteins would not connect or may connect in small groups, but not a network (Figure 3A). In the protein-protein interaction network using the direct interaction algorithm that describes the difference between CD151− and CD151+ T cells, all but 4 of 104 different seed nodes linked up into a single network (Figure 3B). Overall, in CD151+ T cells more kinases, transcription factors or phosphatases were found expressed at a lower level or less phosphorylated (62) rather than increased (42) in the absence of any stimulus, possibly indicative of a resting phenotype (Figure 4A). This would be consistent with the findings that CD151 is more likely expressed on differentiated memory T cells or is somewhat associated with a senescent phenotype. Network analysis identified the Btk/ß-catenin/PKC/FAK2-pathway (associated with Positive regulation of response to stimulus (p= 1.378e–32)) and the ATF-2/QIK/CaMKII/ß-catenin/ATF-2/c-Jun-pathway (associated with Positive regulation of cellular metabolic process (p= 1.380e–27)) as the highest ranked curated pathways associated with the list of identified altered proteins. Consistent with these pathway motifs, the highest ranked network hubs were p53, c-Jun, STAT3 and ß-catenin (Figure 3C). Gene Ontology (GO) enrichment analysis ranked (i) regulation of programmed cell death, (ii) regulation of cell cycle as the highest ranked specific motif changes, and positive regulation of MAPK cascade as the highest specific biological process that would be associated with the observed protein changes between CD151− and CD151+ T cells. 64% of the proteins found altered in their expression or phosphorylation state were involved in programmed cell death (p= 5.660e–24), 46% of the altered proteins were associated with cell proliferation (p= 19.630e–18) and 27% of the altered proteins were involved in the MAPK signaling (p= 1.115e–10).
Figure 4. CD151 expression associated protein regulation profiles.
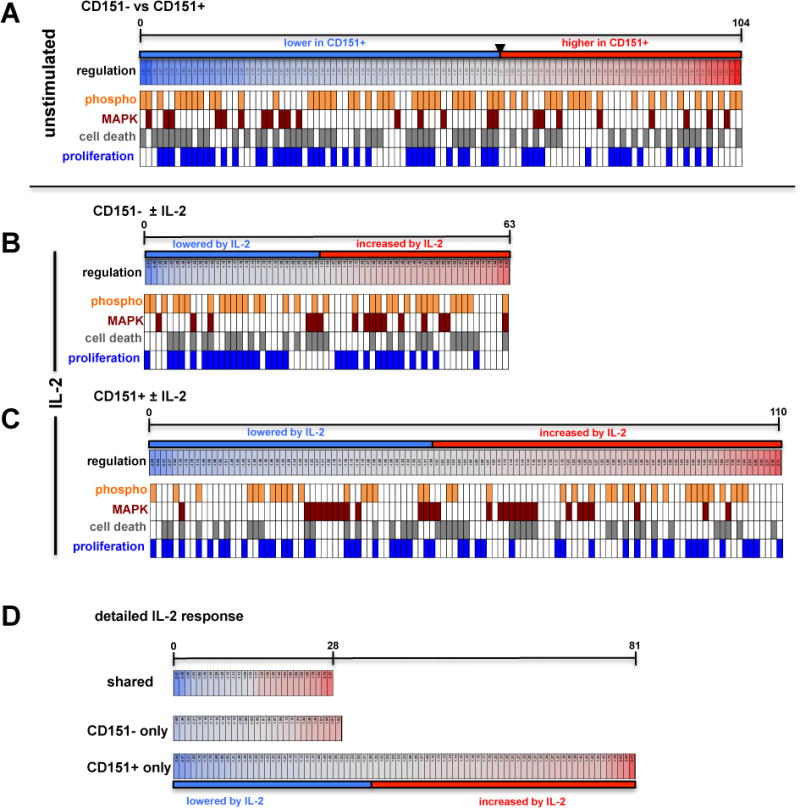
Graphic depiction of the differential regulation of protein expression and protein phosphorylation states for the various experimental conditions describing differences in the absence or presence of IL-2 stimulation for CD151− and CD151+ T cells. Lowered Z-ratios (−4.0 to −1.0) derived from the respective kinome array analysis experiment, which represent protein states that are downregulated in CD151+ T cells relative to CD151− T cells, are assigned a blue color, with the lowest z-ratio = −4.0 being represented by the dark blue bar under the map. Similarly, protein states with an increased Z-ratio (1.0–4.0) (42 proteins) are assigned a red color with the highest z-ratio = 4.0 being represented by the dark orange bar under the map. Barcode representations indicate phosphorylation signals in orange and assign each altered protein signal to the MAPK pathway (crimson), cell death/apoptosis (gray) or cell proliferation/cell cycle (blue). (A) At baseline, in the absence of stimulation, 104 proteins that were found altered in primary CD151+ T cells when compared to CD151− T cells (see Supplemental Table I) of which 42 proteins provided an increased and 62 proteins a decreased signal. (B) 63 protein signals were found altered in primary CD151− T cells following stimulation with IL-2 of which 33 proteins provided an increased and 30 proteins a decreased signal (see Supplemental Table II). (C) 110 protein states were altered in CD151+ T cells in response to IL-2 treatment, of which 60 proteins provided an increased and 50 proteins a decreased signal (see Supplemental Table III). (D) Detailed graphic depiction of the parts of the IL-2 response of primary T cells that were shared between CD151− and CD151+ T cells (see Supplemental Table IV), that were unique to CD151− T cells (see Supplemental Table V) and that were unique to CD151+ T cells (see Supplemental Table VI).
Since the network analysis of the kinome studies demonstrated that CD151+ cells were associated with a positive regulation of response to stimulus, we next compared the response of CD151− T cells and CD151+ T cells to IL-2 stimulation. IL-2 is considered signal #3 in the T cell activation process, and is thought to mostly sustain proliferation of T cells that have been activated by TCR recognition of their cognate antigen, followed by proper co-stimulation through CD28 receptor engagement by CD80 or CD86 on the antigen presenting cell. Resting T cells have no or only low levels of the high-affinity IL-2 receptor CD25, but express the low-affinity IL-2 receptor CD122. IL-2 exposure was intended to investigate possible response differences to immunologically relevant non-antigen stimuli that would be expected to be present at elevated concentrations in lymph nodes, but would be mostly absent in the peripheral blood, and would not be considered a cytokine typically associated with homeostatic proliferation (61–63).
The analysis was done using the same, sorted donor T cell material (5 donors) that was used for the analysis of phenotypic molecular differences between CD151− and CD151+ T cells. The CD151− or CD151+ T cells from each donor were exposed to IL-2 (30 U/ml) for 24 hours, harvested and subjected to kinome analysis.
As IL-2 responsiveness in vivo is thought to depend on the previous recognition of cognate antigen, IL-2 exposure by itself should only cause a limited amount of changes in the signal transduction network. This was indeed the case for CD151− T cells where 63 low-amplitude differences between untreated and IL-2 treated cells were recorded (Figure 4B; upper graph; Supplemental Table II). However, consistent with the baseline kinome motifs of CD151+ T cells (positive regulation of response to stimulus), addition of IL-2 resulted in an exaggerated response (Figure 4B). For CD151+ T cells a total of 110 differential signals with a larger signal amplitude-range were recorded than observed for CD151− T cells, (104/110 linked; Supplemental Table III), suggesting that CD151+ T cells are hyper-responsive to IL-2 without a requirement for cognate antigen recognition (Figure 4B; lower panel). The top 3 GO motifs that were associated with the IL-2 induced changes in CD151+ T cells were regulation of cell death (p = 3.108e–22), MAPK cascade (p = 2.720e–22) and regulation of cell proliferation (p = 3.660e–20). When we detailed the IL-2 response (Figure 4C), we found that CD151− and CD151+ T cells actually shared a total of 28 proteins that were dynamically altered by IL-2 (Supplemental Table IV). In addition, 29 regulated proteins were unique to the CD151− T cell response, but the changes were all in the low dynamic range (Supplemental Table V). In contrast, a total of 81 proteins were found uniquely altered in CD151+ T cells in response to IL-2 and the observed changes were more dynamic than those observed in CD151− T cells (Figure 4C lower panel; Supplemental Table VI).
These system-wide data provided first evidence that CD151+ T cells, which are found throughout all T cell differentiation states, are phenotypically different from CD151− T cells. At baseline, consistent with the higher frequency of CD151+ T cells in resting or senescent memory T cell populations, CD151+ T cells seemed to be less activated, however, in the presence of IL-2, CD151+ T cells exhibited a hyperresponsive molecular phenotype.
CD151 expression actively changes the host cell phenotype
While the transcription factor signature that drives CD151 expression could alter the baseline and response phenotype of CD151+ T cells, we wanted to investigate whether CD151 would just be a passive marker or an actively signaling molecule on T cells. Reports describing CD151 interaction with PIK4 or PKC signaling make the latter idea a distinct possibility (23, 36, 37), however, none of these findings came from experiments using T cells. To determine a possible impact of CD151 expression on the signaling network of T cells, we generated CD151 overexpressing Jurkat T cells (J-CD151; Figure 5A).
Figure 5. Protein-protein interaction network describing the effect of CD151 on the phenotype of T cells.
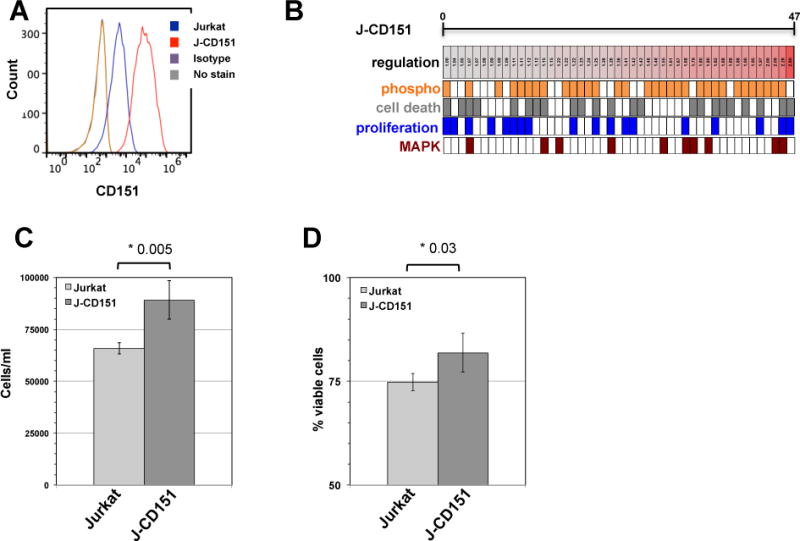
(A) Jurkat T cells were retrovirally transduced to overexpress CD151. (B) Graphic depiction of the differential regulation of protein expression and protein phosphorylation states for the 61 proteins that were found altered by the expression of CD151. Lowered Z-ratios (−4.0 to −1.0) derived from the respective kinome array analysis experiment, which represent protein states that are downregulated in J-CD151 T cells relative to Jurkat T cells, are assigned a blue color, with the lowest z-ratio = −4.0 being represented by the dark blue. Protein states with an increased Z-ratio (1.0–4.0) are assigned a red color. Barcode representations indicate phosphorylation signals in orange and assign each altered protein signal to the MAPK pathway (crimson), cell death/apoptosis (gray) or cell proliferation/cell cycle (blue). (C) Jurkat and J-CD151 cells were seeded at 1×10³ cells/ml and cell numbers after 6 days of culture were determined using a GUAVA EasyCyte flow cytometer. The results represent the mean ± standard deviation of 4 independent experiments. (D) Jurkat and J-CD151 cells were seeded at 1×10³ cells/ml and cell viability was determined after 6 days of culture using a GUAVA EasyCyte flow cytometer. The results represent the mean ± standard deviation of 4 independent experiments.
Relative to the parental Jurkat T cells and a Jurkat T cell population that was transduced with an empty retroviral vector, forced expression of CD151 caused a total of 47 changes to the signaling network of J-CD151 cells (Figure 5B; only proteins that remained unaltered in mock-transduced cells relative to Jurkat cells, but were altered in J-CD151 cells were considered; Supplemental Table 7). There were two striking observations. CD151 overexpression resulted in an unprecedented relative level of changes in the phosphorylation state of the altered proteins, rather than in the regulation of protein expression when we compared these data with previously published kinome analysis experiments from our group or the other kinomic data presented in this study (58, 64, 65). Out of the 47 altered signals, 33 signals indicated differences in the phosphorylation state, all of which showed increased phosphorylation. Similarly, all of the 14 signals that indicated changes in protein expression were upregulated signals. In line with the idea that CD151 would provide an activating signal, CD151 overexpression exclusively resulted in signal increases.
Also in line with the data we obtained when we compared primary CD151+ and CD151− T cells, analysis of the direct interaction network that was altered in J-CD151 when compared to the parental control cells (45 out of 47 seed nodes connected), the highest ranked specific GO process motifs were regulation of programmed cell death (52.50% of altered proteins; p-value: 4.111e–12) and regulation of cell proliferation (50% of altered proteins; p-value: 1.843e–10). The MAPK cascade GO motif phenotype observed in primary CD151+ T cells was also reproduced (27.50% of altered proteins; p-value: 7.170e–10). As seen in Figure 5C and 5D, the phenotypic changes predicted by network analysis based on the signal changes detected by kinome analysis were indeed predictive of functional changes. Consistent with the GO motif analysis, J-CD151 cells had (i) a higher proliferative capacity and (ii) exhibited increased viability. When we compared cell proliferation capacity, starting at low input cell numbers (1×10³ cells/ml) that allowed the T cells to remain in exponential growth phase during the experimental period, J-CD151 T cells proliferated at a significantly higher rate (Figure 5C). Also, when compared to the parental Jurkat T cells, J-CD151 cells exhibited an overall increased viability (Figure 5D).
These data clearly demonstrate that CD151 is not only a passive marker, but that CD151 in this system actively signaled to alter T cells in a manner similar to the differences observed between primary CD151− and CD151+ T cells, with phenotypic changes mostly pertaining to a cell proliferation and a cell survival phenotype. The data also validated the predictive analytical capacity of kinome analysis based pathway motif analysis.
CD151 marks hyper-responsive, unchecked T cells
To challenge the kinome analysis derived prediction that primary CD151+ T cells differ from CD151− T cells either in their ability to proliferate or in their ability to survive, we initiated long-term cultures using primary T cells from four donors. In these experiments, the T cells were not stimulated by polyclonal activators such as PHA-L or anti-CD3/CD28 mAb combinations, but cultured in the presence of only IL-2 (30 U/ml), which is a known survival factor for T cells. IL-2 was the first reported mitogenic lymphokine known that was shown to stimulate T cells to undergo cell cycle progression. However, other than IL-7 or IL-15, which have been reported to drive antigen-independent homeostatic T cell proliferation, IL-2 would not stimulate growth of T cells that were not previously antigen experienced (or PHA-L/anti-CD3/CD28 mAb activated), but would continuously drive T cell cycling over several months after the T cells were activated by cognate antigen (61–63).
CFSE experiments over 5 days using T cells derived from 4 healthy donors did not show significant induction of CD151 expression by IL-2 alone but consistent with the kinome data, demonstrated that IL-2 induced T cells underwent at least one round of cell proliferation during this experimental period (Figure 6A). As similar cultures were extended to day 31, we followed the relative contribution of the CD151+ and the CD151− T cell subpopulations to the total T cell population. To obtain information on the senescence status of the respective T cell populations, we further resolved the T cell populations for their CD28 status (Figures 6B and 6E) and to determine whether changes in the size of the 4 different CD28±CD151± populations would be associated with proliferative capacity, we stained for the proliferation marker Ki67 on day 14 of the experiments (Figures 6C and 6F).
Figure 6. CD151 expression on T cells is associated with an increased proliferative capacity in the absence of TCR-activation.
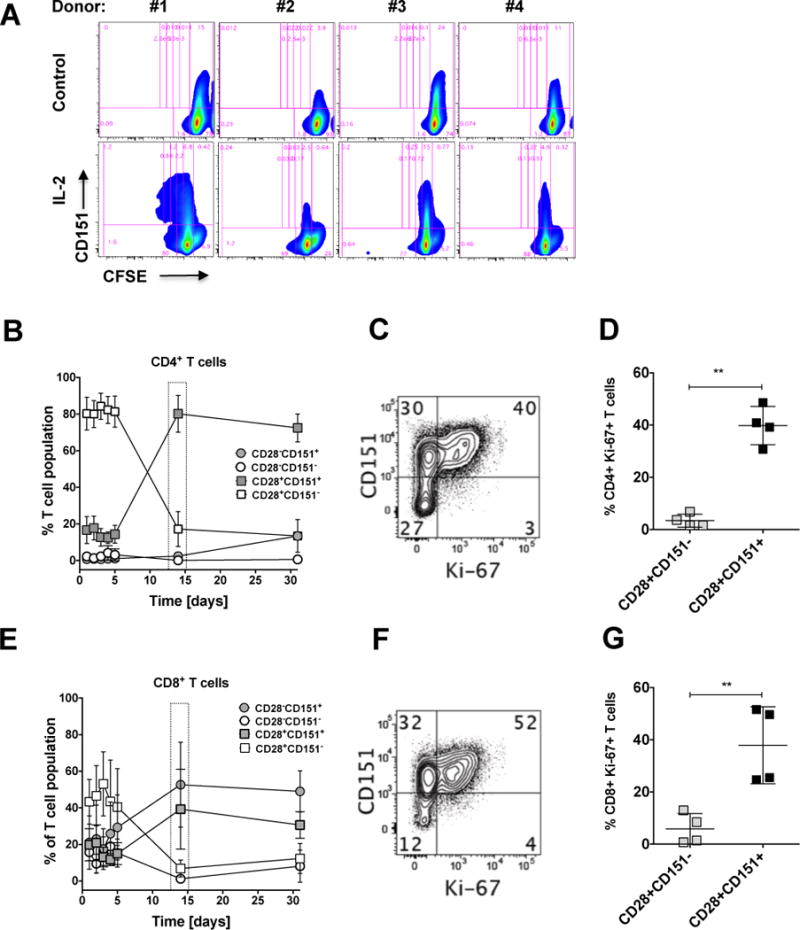
(A) PBMCs from 4 donors were CFSE-stained and then cultured for 5 days in the absence or presence of IL-2. Proliferation was then measured as a reduction of CFSE fluorescence intensity using flow cytometric analysis. The baseline gate was adjusted based on the majority population in untreated cell cultures, while the proliferation gates were adjusted using anti-CD3/CD28 mAb stimulated PBMCs (data not shown). PBMCs from another 4 donors were cultured in the presence of IL-2 (30 U/mL), which was replenished every 2–3 days for a total of 31 days. At the indicated time points, the contribution of the four possible CD28+/− CD151+/− T cell populations to the total T cell population was assessed using flow cytometric analysis. (B) Kinetic changes in the CD28+/− CD151+/− T cell composition of the CD4+ T cell populations are depicted as mean population percentage ± standard deviation and show an enrichment of the CD28+CD151+ T cell population over time. (C) On day 14, cells were stained for the expression of the proliferation marker Ki67 as a function of CD151 expression to address whether the enrichment of the CD28+/−CD151+ T cell population was driven by proliferation effects. (D) The percentage of CD4+Ki67 expressing cells for the 4 donors on day 14 expressed as a function of the CD28+ CD151+/− expression status. (E) Kinetic changes in the CD28+/− CD151+/− T cell composition of the CD8+ T cell populations are depicted as mean population percentage ± standard deviation and show an enrichment of the CD28+/−CD151+ T cell populations over time. (F) To address whether the observed enrichment of the CD28+/−CD151+ T cell populations was driven by proliferation effects, on day 14 cells were stained for the expression of the proliferation marker Ki67 as a function of CD151 expression. (G) The percentage of CD8+Ki67+ expressing cells for the 4 donors on day 14 expressed as a function of the CD28+/− CD151+/− expression status.
For the first 5 days of this experiment, within the CD4+ T cell population, CD4+CD28+CD151− T cells constituted the dominant T cell population (~80%; range: 26–82%), then their frequency dropped to contribute <17% (range 3–24%) by day 14. Conversely, CD4+CD28+CD151+ T cells, which initially constituted ~17% (range: 8–23%) of the total CD4+ T cell population, had increased to ~80% (range: 74–95%) by day 14, and remained at this level until day 31 of the experiment. Somewhat surprisingly, the size of the CD4+CD28−CD151+ T cell population, which constituted 0.1–2.4% of the initial T cell population increased to contribute ~13% of the total CD4+ T cell population on day 31 (range: 12–15%). The small CD4+CD28−CD151− T cell population (1.3–3.7%) further decreased in size (all Figure 6B). These data would suggest that CD4+ T cells in this experiment would proliferate upon IL-2 exposure as a function of their positive CD151 status and not as a function of their CD28 status.
These observations were confirmed in the CD8+ T cell population. Here the CD28/CD151 baseline composition differed from CD4+ T cells, as the CD28− T cell populations significantly contributed to the overall population (CD8+CD28−CD151−: 16%; range: 9–20%; CD8+CD28−CD151+: 16%; range: 8–37%).
Independent of these baseline differences, as in CD4+ T cells, both CD8+CD151+ T cell populations (CD28±/CD151+) expanded, whereas both CD8+CD151− T cell populations (CD28±CD151−) contracted (Figure 6E) over time in the presence of IL-2, similar to the population dynamics observed in CD4+ T cells.
Thus, surprisingly, the ability to proliferate in response to IL-2, in the CD4+ or in the CD8+ T cell population, was not associated with the CD28 expression status (CD28+/−), but was rather was associated with the CD151 expression status. In either T cell lineage, even CD28− T cells, which are considered to be in a state of replicative senescence by some, had proliferative capacity in the presence of IL-2, if they expressed CD151. CD28+CD151− T cells, for neither T cell lineage exhibited a relevant propensity to proliferate. CD28−CD151− T cell populations, while being measurable at the beginning of the experiment, in particular in the CD8+ T cell population, were eliminated from these cultures, suggesting that CD151 may even provide a survival signal for CD28− T cells, which would be consistent with the kinome data that network changes observed in CD151+ T cells were associated with cell survival or proliferative capacity.
While selective cell death in some of the populations cannot be excluded as a factor contributing to the shifts in population size, Figures 6C–D for CD4+ T cells and Figures 6F–G for CD8+ T cells demonstrate that the changes in the T cell composition were associated with a superior capacity of CD151+ T cells to respond to IL-2 with entry into active cell cycle. At baseline (ex vivo) donors on average have less than 2% of CD4+Ki-67+ or CD8+Ki-67+ T cells (see Figure 7). In contrast, 14 days into the IL-2 long-term culture, 40% (range: 32–48%) of the CD4+CD28+CD151+ T cells and 38% (range: 25–56%) of the CD8+CD28+CD151+ T cells were Ki-67-positive and therefore actively cycling. Only 3% of CD4+CD28+CD151− T cells (range: 1–6%) and 6 % of CD8+CD28+CD151− T cells (range: 1–16%) expressed Ki-67. A statistically meaningful analysis of the CD4+CD28− population on day 14 was not possible, as we could not acquire a sufficient number of events. Nevertheless, these data clearly suggest that CD151+ T cells in comparison to CD151− T cells have increased cycling capacity in the absence of TCR engagement. Of note, while knockdown of CD151 has been reported to decrease the ability of T cells to produce IL-2, the differences in proliferative capacity between CD151+ and CD151− T cells in our experimental system would not be based on increased production of IL-2 by CD151+ T cells following external IL-2 stimulation, as extrinsic addition of IL-2 did not stimulate IL-2 production (data not shown).
Figure 7. Association of Ki-67 and CD151 on peripheral T cells.
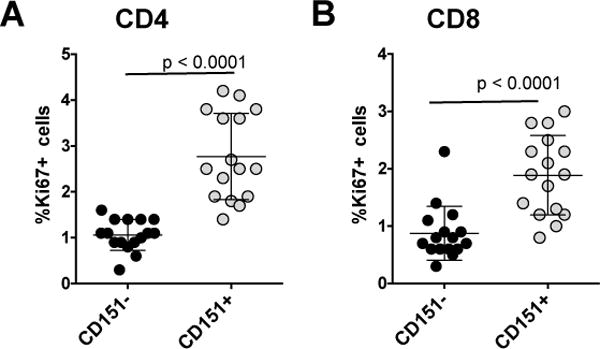
Peripheral blood cells from 16 healthy donors was obtained, stained for expression of CD3, CD4, CD8, CD151 and Ki-67 and analyzed by flow cytometry. (A) The percentage of CD4+Ki67+ T cells as a function of their CD151 expression status for all donors. (B) The percentage of CD8+Ki67+ T cells as a function of their CD151 expression status for all donors.
Given that T cells are not known to efficiently proliferate in the absence of cognate antigen, and that IL-2 is not a signal that has been associated with homeostatic T cell proliferation, we conclude that CD28+CD151− T cells undergo normal controlled responses to TCR-independent stimuli, whereas CD151+ T cells, independent of their CD28 status are hyperresponsive to at least IL-2 and exhibit a somewhat unchecked proliferation phenotype in the absence of TCR/CD3 stimulation.
CD151 expression on actively cycling T cells
If CD151, as indicated by our experiments, is a marker that predicts the propensity of T cells to proliferate in the absence of antigen, we would expect to see that ex vivo CD151+ T cell populations are more likely to harbor cycling Ki-67+ T cells than CD151− T cells. While we would postulate that CD151+ T cells are more likely to cycle in a cytokine-rich environment such as a lymph node, we would still expect to see a certain level of Ki-67 enrichment in peripheral blood. To test this idea, we obtained PBMCs from 15 donors and compared the number of Ki-67+ T cells in the CD151+ T cell populations with the number of Ki-67+ T cells in the CD151− T cell population (Figure 7). Of note, CD4+ T cells from healthy donors are largely CD28+, which precluded us from detailing a possible effect additional effect of the CD28 status on Ki67 expression. In this analysis, we found 0.8% of the CD4+CD151− T cell population to be Ki67+ (range: 0.1–1.7%), whereas 3.7% of the CD4+CD151+ population was Ki67+ (range: 2.2–7.3%). A similar comparison was performed for the CD8+ T cell population. Here we found 0.9% of the CD8+CD151− T cell population to be Ki67+ (range: 0.3–2.3%), whereas 1.9% of the CD8+CD151+ population was also Ki67+ (range: 0.8–2.8%). Overall, these data suggest that even in the peripheral blood CD151+ T cells have an increased propensity to proliferate.
DISCUSSION
Impaired T cell homeostasis can result in increased T cell proliferation, a lowered threshold for antigen activation, or even in the loss of immune tolerance and the development of autoimmune phenotypes (8, 21, 22). A marker that identifies T cells with an increased capacity to spontaneously proliferate in the absence of antigen stimulation would allow us to more specifically study these T cells and possibly devise strategies to correct this type of immune misalignment. In here we provide data that the tetraspanin CD151 not only serves as a marker of hyper-responsive T cells with an increased propensity to proliferate in the absence of antigen recognition (Figure 6), but also demonstrate that CD151 expression actively contributes to this state (Figure 5).
Consistent with the requirements of a marker, we found CD151 to be expressed on subpopulations of the CD4 or CD8 T cell lineages (Figure 1). In either lineage CD151 was expressed on subpopulations of T cells representing all different differentiation states (Tnaïve, TCM, TEM, TEMRA), albeit at significantly different frequencies (Figure 1). The differentiation-state- and lineage-independent expression of CD151 suggests that the specific transcriptional program that drives CD151 expression must be independent of transcriptional programs that govern lineage differentiation, or transcription signatures that govern memory T cell differentiation. This would be an important criteria for a marker of hyperresponsive T cells, as T cell misalignment has been reported to occur at all T cells differentiation states, including naïve T cells (3, 4, 66).
We found CD151 to be expressed on parts of a T cell population that has been described as senescent (CD28−CD57+), but primarily we found CD151 to mark a significant part of the CD28+CD57− T cell population that so far has been considered as uniform and fully functional. Analysis of CD151+ and CD151− T cells at the signal transduction level using kinome analysis provided evidence that CD151 expressing T cells at baseline form a population with a distinct molecular phenotype (Figure 4A) that exhibited an exceedingly strong molecular activation response following IL-2 exposure (Figure 4B). At baseline and following IL-2 stimulation, network analysis suggested changes to the cell proliferation and survival capacity of CD151+ T cells. This molecular response phenotype was functionally confirmed in IL-2 stimulated long-term T cell cultures in which CD151+ T cells proliferated in the absence of stimulation by cognate antigen (Figure 6). Most importantly, under these culture conditions it was not the CD28 expression status, which has been linked to T cell senescence or exhaustion, but the capacity of T cells to proliferate in the absence of antigen that was associated with the CD151 expression status. Both, CD28+CD151+ and CD28−CD151+ T cells proliferated, a phenomenon that is more clearly visible in CD8+ T cells than in the CD4+ T cell population, which mostly lacks CD28− T cells. Conversely, neither in CD4+ nor in CD8+ T cell populations did we observe IL-2 induced proliferation of CD151− T cells, independent of their CD28 expression status.
The differential molecular baseline state and stimulation response behavior, based on CD151 expression, could have two explanations. First, the transcriptional signature that drives CD151 expression could alter the baseline phenotype and the response phenotype of CD151+ T cells. While this is a distinct possibility, it is difficult to experimentally test. The challenge would be to distinguish between the phenotypic contributions of a multitude of other transcription factor signatures that drive the differential expression of markers of T cell differentiation (e.g. CCR7, CD45RA) or T cell markers that have been associated with senescence (e.g. loss of CD28 or CD57) and the specific contributions of the transcription factor signature that drives CD151 expression.
We thus directly tested whether CD151 expression actively alters the signal transduction network once it is overexpressed in an uniform and experimentally controlled T cell system. These experiments demonstrated that CD151 expression, in the absence of differences in the transcriptional signature, actively influences the T cell phonotype and is more than a passive marker. CD151 overexpressing Jurkat T cells (J-CD151)showed extensive differences in their kinome signature when compared to control cells that were marked by a pronounced hyper-phosphorylation phenotype (Figure 5C). Consistent with the pathway motif results that suggested alterations in cell cycle control, J-CD151 cells, indeed proliferated by 30% faster during exponential growth, which is rather surprising given that Jurkat cells are a highly aggressive tumor cell line with a doubling time of <24 hours. As such, the observed hyperproliferative, unchecked phenotype of primary CD151+ T cell observed in response to IL-2 treatment in long-term cultures and the differential kinome profile of CD151 expressing T cells may in part originate from an altered transcription factor signature (inside-out signaling), but certainly the active outside-in signal associated with CD151 expression should contribute to the increased proliferative baseline capacity of CD151+ T cells.
An interesting question is how a molecule like CD151 that has not been described to have significant direct signaling capacity, but has been reported to signal in complex with mostly integrin partners could cause an altered baseline signal transduction network once expressed. CD151 function has been detailed in a series of publications that describe the interaction of the extracellular part of CD151 with the extracellular domain of integrins (67). These CD151/integrin complexes have been found associated with phosphoinositide 4-kinase (37) and with protein kinase C signaling (36, 68). Hemler and colleagues have suggested that tetraspanin proteins such as CD151 have a transmembrane linker function, where the extracellular portion of CD151 would associate with the integrin, and the cytoplasmic tail determines the specific consequences of integrin outside-in signaling (36, 68, 69). We would thus propose that the observed changes caused by the presence of CD151 on T cells are the result of lateral CD151/integrin interactions that optimize the signaling capacity of the integrin network.
In extension, our findings obviously imply that not only CD151, but likely also other tetraspanins could have the ability to fine-tune T cell phenotypes. Notably, CD81 has already been shown to act as a co-stimulatory molecule (70, 71). Similarly to CD151, the tetraspanin CD81 is also recruited to the IS during TCR stimulation (72), but there are no studies yet on how CD81 expression is regulated as a function of T cell lineage or memory differentiation state, such as the one we present here. The tetraspanin CD9 is another possible modulator of T cell phenotype as CD9 in complex with integrins has also a role in IS formation (54). Our findings suggest that beyond their reported role in IS formation, the tetraspanin/integrin composition on T cells likely plays a mostly unrecognized role in fine-tuning T cell responsiveness and T cell homeostasis.
Supplementary Material
Acknowledgments
This work was funded in part by NIH grants F32 HL121924 to LS, and R01-AI104499, R56-AI122842 and R21-AI116188 to OK. Parts of the work were performed in the UAB CFAR BSL-3 facilities and by the UAB CFAR Flow Cytometry Core/Joint UAB Flow Cytometry Core, which are funded by NIH/NIAID P30 AI027767 and by NIH 5P30 AR048311.
References
- 1.Cho JH, Kim HO, Surh CD, Sprent J. T cell receptor-dependent regulation of lipid rafts controls naive CD8+ T cell homeostasis. Immunity. 2010;32:214–226. doi: 10.1016/j.immuni.2009.11.014. [DOI] [PMC free article] [PubMed] [Google Scholar]
- 2.Purton JF, Sprent J, Surh CD. Staying alive–naive CD4(+) T cell homeostasis. Eur J Immunol. 2007;37:2367–2369. doi: 10.1002/eji.200737721. [DOI] [PubMed] [Google Scholar]
- 3.Sprent J, Surh CD. Normal T cell homeostasis: the conversion of naive cells into memory-phenotype cells. Nat Immunol. 2011;12:478–484. doi: 10.1038/ni.2018. [DOI] [PMC free article] [PubMed] [Google Scholar]
- 4.Surh CD, Sprent J. Homeostasis of naive and memory T cells. Immunity. 2008;29:848–862. doi: 10.1016/j.immuni.2008.11.002. [DOI] [PubMed] [Google Scholar]
- 5.Boyman O, Purton JF, Surh CD, Sprent J. Cytokines and T-cell homeostasis. Curr Opin Immunol. 2007;19:320–326. doi: 10.1016/j.coi.2007.04.015. [DOI] [PubMed] [Google Scholar]
- 6.Cho BK, Rao VP, Ge Q, Eisen HN, Chen J. Homeostasis-stimulated proliferation drives naive T cells to differentiate directly into memory T cells. J Exp Med. 2000;192:549–556. doi: 10.1084/jem.192.4.549. [DOI] [PMC free article] [PubMed] [Google Scholar]
- 7.Goldrath AW, Bogatzki LY, Bevan MJ. Naive T cells transiently acquire a memory-like phenotype during homeostasis-driven proliferation. J Exp Med. 2000;192:557–564. doi: 10.1084/jem.192.4.557. [DOI] [PMC free article] [PubMed] [Google Scholar]
- 8.Kovalev GI, Franklin DS, Coffield VM, Xiong Y, Su L. An important role of CDK inhibitor p18(INK4c) in modulating antigen receptor-mediated T cell proliferation. J Immunol. 2001;167:3285–3292. doi: 10.4049/jimmunol.167.6.3285. [DOI] [PMC free article] [PubMed] [Google Scholar]
- 9.Ouyang W, Oh SA, Ma Q, Bivona MR, Zhu J, Li MO. TGF-beta cytokine signaling promotes CD8+ T cell development and low-affinity CD4+ T cell homeostasis by regulation of interleukin-7 receptor alpha expression. Immunity. 2013;39:335–346. doi: 10.1016/j.immuni.2013.07.016. [DOI] [PMC free article] [PubMed] [Google Scholar]
- 10.Crawley AM, Vranjkovic A, Faller E, McGuinty M, Busca A, Burke SC, Cousineau S, Kumar A, Macpherson PA, Angel JB. Jak/STAT and PI3K signaling pathways have both common and distinct roles in IL-7-mediated activities in human CD8+ T cells. J Leukoc Biol. 2014;95:117–127. doi: 10.1189/jlb.0313122. [DOI] [PubMed] [Google Scholar]
- 11.Ishihara S, Nishikimi A, Umemoto E, Miyasaka M, Saegusa M, Katagiri K. Dual functions of Rap1 are crucial for T-cell homeostasis and prevention of spontaneous colitis. Nat Commun. 2015;6:8982. doi: 10.1038/ncomms9982. [DOI] [PMC free article] [PubMed] [Google Scholar]
- 12.Jatzek A, Tejera MM, Singh A, Sullivan JA, Plisch EH, Suresh M. p27(Kip1) negatively regulates the magnitude and persistence of CD4 T cell memory. J Immunol. 2012;189:5119–5128. doi: 10.4049/jimmunol.1201482. [DOI] [PMC free article] [PubMed] [Google Scholar]
- 13.Niss O, Sholl A, Bleesing JJ, Hildeman DA. IL-10/Janus kinase/signal transducer and activator of transcription 3 signaling dysregulates Bim expression in autoimmune lymphoproliferative syndrome. J Allergy Clin Immunol. 2015;135:762–770. doi: 10.1016/j.jaci.2014.07.020. [DOI] [PMC free article] [PubMed] [Google Scholar]
- 14.Tuettenberg A, Hahn SA, Mazur J, Gerhold-Ay A, Scholma J, Marg I, Ulges A, Satoh K, Bopp T, Joore J, Jonuleit H. Kinome Profiling of Regulatory T Cells: A Closer Look into a Complex Intracellular Network. PLoS One. 2016;11:e0149193. doi: 10.1371/journal.pone.0149193. [DOI] [PMC free article] [PubMed] [Google Scholar]
- 15.Willinger T, Flavell RA. Canonical autophagy dependent on the class III phosphoinositide-3 kinase Vps34 is required for naive T-cell homeostasis. Proc Natl Acad Sci U S A. 2012;109:8670–8675. doi: 10.1073/pnas.1205305109. [DOI] [PMC free article] [PubMed] [Google Scholar]
- 16.Huynh A, Turka LA. Control of T cell tolerance by phosphatase and tensin homolog. Ann N Y Acad Sci. 2013;1280:27–29. doi: 10.1111/nyas.12015. [DOI] [PubMed] [Google Scholar]
- 17.Johnson DJ, Pao LI, Dhanji S, Murakami K, Ohashi PS, Neel BG. Shp1 regulates T cell homeostasis by limiting IL-4 signals. J Exp Med. 2013;210:1419–1431. doi: 10.1084/jem.20122239. [DOI] [PMC free article] [PubMed] [Google Scholar]
- 18.Kamimura D, Katsunuma K, Arima Y, Atsumi T, Jiang JJ, Bando H, Meng J, Sabharwal L, Stofkova A, Nishikawa N, Suzuki H, Ogura H, Ueda N, Tsuruoka M, Harada M, Kobayashi J, Hasegawa T, Yoshida H, Koseki H, Miura I, Wakana S, Nishida K, Kitamura H, Fukada T, Hirano T, Murakami M. KDEL receptor 1 regulates T-cell homeostasis via PP1 that is a key phosphatase for ISR. Nat Commun. 2015;6:7474. doi: 10.1038/ncomms8474. [DOI] [PMC free article] [PubMed] [Google Scholar]
- 19.Nowakowska DJ, Kissler S. Ptpn22 Modifies Regulatory T Cell Homeostasis via GITR Upregulation. J Immunol. 2016;196:2145–2152. doi: 10.4049/jimmunol.1501877. [DOI] [PMC free article] [PubMed] [Google Scholar]
- 20.Salmond RJ, Brownlie RJ, Zamoyska R. Multifunctional roles of the autoimmune disease-associated tyrosine phosphatase PTPN22 in regulating T cell homeostasis. Cell Cycle. 2015;14:705–711. doi: 10.1080/15384101.2015.1007018. [DOI] [PMC free article] [PubMed] [Google Scholar]
- 21.Murga M, Fernandez-Capetillo O, Field SJ, Moreno B, Borlado LR, Fujiwara Y, Balomenos D, Vicario A, Carrera AC, Orkin SH, Greenberg ME, Zubiaga AM. Mutation of E2F2 in mice causes enhanced T lymphocyte proliferation, leading to the development of autoimmunity. Immunity. 2001;15:959–970. doi: 10.1016/s1074-7613(01)00254-0. [DOI] [PubMed] [Google Scholar]
- 22.Sun H, Lu B, Li RQ, Flavell RA, Taneja R. Defective T cell activation and autoimmune disorder in Stra13-deficient mice. Nat Immunol. 2001;2:1040–1047. doi: 10.1038/ni721. [DOI] [PubMed] [Google Scholar]
- 23.Berditchevski F. Complexes of tetraspanins with integrins: more than meets the eye. J Cell Sci. 2001;114:4143–4151. doi: 10.1242/jcs.114.23.4143. [DOI] [PubMed] [Google Scholar]
- 24.Berditchevski F, Odintsova E. Tetraspanins as regulators of protein trafficking. Traffic. 2007;8:89–96. doi: 10.1111/j.1600-0854.2006.00515.x. [DOI] [PubMed] [Google Scholar]
- 25.Hemler ME. Tetraspanin functions and associated microdomains. Nat Rev Mol Cell Biol. 2005;6:801–811. doi: 10.1038/nrm1736. [DOI] [PubMed] [Google Scholar]
- 26.Tarrant JM, Robb L, van Spriel AB, Wright MD. Tetraspanins: molecular organisers of the leukocyte surface. Trends Immunol. 2003;24:610–617. doi: 10.1016/j.it.2003.09.011. [DOI] [PubMed] [Google Scholar]
- 27.Wright MD, Moseley GW, van Spriel AB. Tetraspanin microdomains in immune cell signalling and malignant disease. Tissue Antigens. 2004;64:533–542. doi: 10.1111/j.1399-0039.2004.00321.x. [DOI] [PubMed] [Google Scholar]
- 28.Yunta M, Lazo PA. Tetraspanin proteins as organisers of membrane microdomains and signalling complexes. Cell Signal. 2003;15:559–564. doi: 10.1016/s0898-6568(02)00147-x. [DOI] [PubMed] [Google Scholar]
- 29.Hemler ME. Tetraspanin proteins mediate cellular penetration, invasion, and fusion events and define a novel type of membrane microdomain. Annu Rev Cell Dev Biol. 2003;19:397–422. doi: 10.1146/annurev.cellbio.19.111301.153609. [DOI] [PubMed] [Google Scholar]
- 30.Kropshofer H, Spindeldreher S, Rohn TA, Platania N, Grygar C, Daniel N, Wolpl A, Langen H, Horejsi V, Vogt AB. Tetraspan microdomains distinct from lipid rafts enrich select peptide-MHC class II complexes. Nat Immunol. 2002;3:61–68. doi: 10.1038/ni750. [DOI] [PubMed] [Google Scholar]
- 31.Levy S, Shoham T. The tetraspanin web modulates immune-signalling complexes. Nat Rev Immunol. 2005;5:136–148. doi: 10.1038/nri1548. [DOI] [PubMed] [Google Scholar]
- 32.Carloni V, Mazzocca A, Ravichandran KS. Tetraspanin CD81 is linked to ERK/MAPKinase signaling by Shc in liver tumor cells. Oncogene. 2004;23:1566–1574. doi: 10.1038/sj.onc.1207287. [DOI] [PubMed] [Google Scholar]
- 33.Hong IK, Jeoung DI, Ha KS, Kim YM, Lee H. Tetraspanin CD151 stimulates adhesion-dependent activation of Ras, Rac, and Cdc42 by facilitating molecular association between beta1 integrins and small GTPases. J Biol Chem. 2012;287:32027–32039. doi: 10.1074/jbc.M111.314443. [DOI] [PMC free article] [PubMed] [Google Scholar]
- 34.Sawada S, Yoshimoto M, Odintsova E, Hotchin NA, Berditchevski F. The tetraspanin CD151 functions as a negative regulator in the adhesion-dependent activation of Ras. J Biol Chem. 2003;278:26323–26326. doi: 10.1074/jbc.C300210200. [DOI] [PubMed] [Google Scholar]
- 35.Shigeta M, Sanzen N, Ozawa M, Gu J, Hasegawa H, Sekiguchi K. CD151 regulates epithelial cell-cell adhesion through PKC- and Cdc42-dependent actin cytoskeletal reorganization. J Cell Biol. 2003;163:165–176. doi: 10.1083/jcb.200301075. [DOI] [PMC free article] [PubMed] [Google Scholar]
- 36.Zhang XA, Bontrager AL, Hemler ME. Transmembrane-4 superfamily proteins associate with activated protein kinase C (PKC) and link PKC to specific beta(1) integrins. J Biol Chem. 2001;276:25005–25013. doi: 10.1074/jbc.M102156200. [DOI] [PubMed] [Google Scholar]
- 37.Yauch RL, Hemler ME. Specific interactions among transmembrane 4 superfamily (TM4SF) proteins and phosphoinositide 4-kinase. Biochem J. 2000;351(Pt 3):629–637. [PMC free article] [PubMed] [Google Scholar]
- 38.Kobayashi H, Hosono O, Iwata S, Kawasaki H, Kuwana M, Tanaka H, Dang NH, Morimoto C. The tetraspanin CD9 is preferentially expressed on the human CD4(+)CD45RA+ naive T cell population and is involved in T cell activation. Clin Exp Immunol. 2004;137:101–108. doi: 10.1111/j.1365-2249.2004.02494.x. [DOI] [PMC free article] [PubMed] [Google Scholar]
- 39.Levy S, Todd SC, Maecker HT. CD81 (TAPA-1): a molecule involved in signal transduction and cell adhesion in the immune system. Annu Rev Immunol. 1998;16:89–109. doi: 10.1146/annurev.immunol.16.1.89. [DOI] [PubMed] [Google Scholar]
- 40.Sagi Y, Landrigan A, Levy R, Levy S. Complementary costimulation of human T-cell subpopulations by cluster of differentiation 28 (CD28) and CD81. Proc Natl Acad Sci U S A. 2012;109:1613–1618. doi: 10.1073/pnas.1121307109. [DOI] [PMC free article] [PubMed] [Google Scholar]
- 41.Witherden DA, Boismenu R, Havran WL. CD81 and CD28 costimulate T cells through distinct pathways. J Immunol. 2000;165:1902–1909. doi: 10.4049/jimmunol.165.4.1902. [DOI] [PubMed] [Google Scholar]
- 42.Yashiro-Ohtani Y, Zhou XY, Toyo-Oka K, Tai XG, Park CS, Hamaoka T, Abe R, Miyake K, Fujiwara H. Non-CD28 costimulatory molecules present in T cell rafts induce T cell costimulation by enhancing the association of TCR with rafts. J Immunol. 2000;164:1251–1259. doi: 10.4049/jimmunol.164.3.1251. [DOI] [PubMed] [Google Scholar]
- 43.Ang J, Lijovic M, Ashman LK, Kan K, Frauman AG. CD151 protein expression predicts the clinical outcome of low-grade primary prostate cancer better than histologic grading: a new prognostic indicator? Cancer Epidemiol Biomarkers Prev. 2004;13:1717–1721. [PubMed] [Google Scholar]
- 44.Detchokul S, Newell B, Williams ED, Frauman AG. CD151 is associated with prostate cancer cell invasion and lymphangiogenesis in vivo. Oncol Rep. 2014;31:241–247. doi: 10.3892/or.2013.2823. [DOI] [PubMed] [Google Scholar]
- 45.Hashida H, Takabayashi A, Tokuhara T, Hattori N, Taki T, Hasegawa H, Satoh S, Kobayashi N, Yamaoka Y, Miyake M. Clinical significance of transmembrane 4 superfamily in colon cancer. Br J Cancer. 2003;89:158–167. doi: 10.1038/sj.bjc.6601015. [DOI] [PMC free article] [PubMed] [Google Scholar]
- 46.Romanska HM, Berditchevski F. Tetraspanins in human epithelial malignancies. J Pathol. 2011;223:4–14. doi: 10.1002/path.2779. [DOI] [PubMed] [Google Scholar]
- 47.Suzuki S, Miyazaki T, Tanaka N, Sakai M, Sano A, Inose T, Sohda M, Nakajima M, Kato H, Kuwano H. Prognostic significance of CD151 expression in esophageal squamous cell carcinoma with aggressive cell proliferation and invasiveness. Ann Surg Oncol. 2011;18:888–893. doi: 10.1245/s10434-010-1387-3. [DOI] [PubMed] [Google Scholar]
- 48.Tokuhara T, Hasegawa H, Hattori N, Ishida H, Taki T, Tachibana S, Sasaki S, Miyake M. Clinical significance of CD151 gene expression in non-small cell lung cancer. Clin Cancer Res. 2001;7:4109–4114. [PubMed] [Google Scholar]
- 49.Voss MA, Gordon N, Maloney S, Ganesan R, Ludeman L, McCarthy K, Gornall R, Schaller G, Wei W, Berditchevski F, Sundar S. Tetraspanin CD151 is a novel prognostic marker in poor outcome endometrial cancer. Br J Cancer. 2011;104:1611–1618. doi: 10.1038/bjc.2011.80. [DOI] [PMC free article] [PubMed] [Google Scholar]
- 50.Yang XH, Richardson AL, Torres-Arzayus MI, Zhou P, Sharma C, Kazarov AR, Andzelm MM, Strominger JL, Brown M, Hemler ME. CD151 accelerates breast cancer by regulating alpha 6 integrin function, signaling, and molecular organization. Cancer Res. 2008;68:3204–3213. doi: 10.1158/0008-5472.CAN-07-2949. [DOI] [PMC free article] [PubMed] [Google Scholar]
- 51.Zhu GH, Huang C, Qiu ZJ, Liu J, Zhang ZH, Zhao N, Feng ZZ, Lv XH. Expression and prognostic significance of CD151, c-Met, and integrin alpha3/alpha6 in pancreatic ductal adenocarcinoma. Dig Dis Sci. 2011;56:1090–1098. doi: 10.1007/s10620-010-1416-x. [DOI] [PubMed] [Google Scholar]
- 52.Copeland BT, Bowman MJ, Ashman LK. Genetic ablation of the tetraspanin CD151 reduces spontaneous metastatic spread of prostate cancer in the TRAMP model. Mol Cancer Res. 2013;11:95–105. doi: 10.1158/1541-7786.MCR-12-0468. [DOI] [PubMed] [Google Scholar]
- 53.Abdala-Valencia H, Bryce PJ, Schleimer RP, Wechsler JB, Loffredo LF, Cook-Mills JM, Hsu CL, Berdnikovs S. Tetraspanin CD151 Is a Negative Regulator of FcepsilonRI-Mediated Mast Cell Activation. J Immunol. 2015;195:1377–1387. doi: 10.4049/jimmunol.1302874. [DOI] [PMC free article] [PubMed] [Google Scholar]
- 54.Rocha-Perugini V, Gonzalez-Granado JM, Tejera E, Lopez-Martin S, Yanez-Mo M, Sanchez-Madrid F. Tetraspanins CD9 and CD151 at the immune synapse support T-cell integrin signaling. Eur J Immunol. 2014;44:1967–1975. doi: 10.1002/eji.201344235. [DOI] [PMC free article] [PubMed] [Google Scholar]
- 55.Zelman-Toister E, Bakos E, Cohen S, Zigmond E, Shezen E, Grabovsky V, Sagiv A, Hart G, Kaushansky N, Ben-Nun A, Maharshak N, Sonnenberg A, Alon R, Becker-Herman S, Shachar I. CD151 Regulates T-Cell Migration in Health and Inflammatory Bowel Disease. Inflamm Bowel Dis. 2016;22:257–267. doi: 10.1097/MIB.0000000000000621. [DOI] [PubMed] [Google Scholar]
- 56.Mittelbrunn M, Yanez-Mo M, Sancho D, Ursa A, Sanchez-Madrid F. Cutting edge: dynamic redistribution of tetraspanin CD81 at the central zone of the immune synapse in both T lymphocytes and APC. J Immunol. 2002;169:6691–6695. doi: 10.4049/jimmunol.169.12.6691. [DOI] [PubMed] [Google Scholar]
- 57.Gerdes J, Schwab U, Lemke H, Stein H. Production of a mouse monoclonal antibody reactive with a human nuclear antigen associated with cell proliferation. Int J Cancer. 1983;31:13–20. doi: 10.1002/ijc.2910310104. [DOI] [PubMed] [Google Scholar]
- 58.Seu L, Sabbaj S, Duverger A, Wagner F, Anderson JC, Davies E, Wolschendorf F, Willey CD, Saag MS, Goepfert P, Kutsch O. Stable Phenotypic Changes of the Host T Cells Are Essential to the Long-Term Stability of Latent HIV-1 Infection. J Virol. 2015;89:6656–6672. doi: 10.1128/JVI.00571-15. [DOI] [PMC free article] [PubMed] [Google Scholar]
- 59.Han Y, Lassen K, Monie D, Sedaghat AR, Shimoji S, Liu X, Pierson TC, Margolick JB, Siliciano RF, Siliciano JD. Resting CD4+ T cells from human immunodeficiency virus type 1 (HIV-1)-infected individuals carry integrated HIV-1 genomes within actively transcribed host genes. J Virol. 2004;78:6122–6133. doi: 10.1128/JVI.78.12.6122-6133.2004. [DOI] [PMC free article] [PubMed] [Google Scholar]
- 60.Brenchley JM, Karandikar NJ, Betts MR, Ambrozak DR, Hill BJ, Crotty LE, Casazza JP, Kuruppu J, Migueles SA, Connors M, Roederer M, Douek DC, Koup RA. Expression of CD57 defines replicative senescence and antigen-induced apoptotic death of CD8+ T cells. Blood. 2003;101:2711–2720. doi: 10.1182/blood-2002-07-2103. [DOI] [PubMed] [Google Scholar]
- 61.Morgan DA, Ruscetti FW, Gallo R. Selective in vitro growth of T lymphocytes from normal human bone marrows. Science. 1976;193:1007–1008. doi: 10.1126/science.181845. [DOI] [PubMed] [Google Scholar]
- 62.Ruscetti FW, Morgan DA, Gallo RC. Functional and morphologic characterization of human T cells continuously grown in vitro. J Immunol. 1977;119:131–138. [PubMed] [Google Scholar]
- 63.Smith KA. Interleukin-2: inception, impact, and implications. Science. 1988;240:1169–1176. doi: 10.1126/science.3131876. [DOI] [PubMed] [Google Scholar]
- 64.Sun J, Schaaf K, Duverger A, Wolschendorf F, Speer A, Wagner F, Niederweis M, Kutsch O. Protein phosphatase, Mg2+/Mn2+-dependent 1A controls the innate antiviral and antibacterial response of macrophages during HIV-1 and Mycobacterium tuberculosis infection. Oncotarget. 2016;7:15394–15409. doi: 10.18632/oncotarget.8190. [DOI] [PMC free article] [PubMed] [Google Scholar]
- 65.Duverger A, Wolschendorf F, Anderson JC, Wagner F, Bosque A, Shishido T, Jones J, Planelles V, Willey C, Cron RQ, Kutsch O. Kinase control of latent HIV-1 infection: PIM-1 kinase as a major contributor to HIV-1 reactivation. J Virol. 2014;88:364–376. doi: 10.1128/JVI.02682-13. [DOI] [PMC free article] [PubMed] [Google Scholar]
- 66.Takada K, Jameson SC. Naive T cell homeostasis: from awareness of space to a sense of place. Nat Rev Immunol. 2009;9:823–832. doi: 10.1038/nri2657. [DOI] [PubMed] [Google Scholar]
- 67.Yauch RL, Berditchevski F, Harler MB, Reichner J, Hemler ME. Highly stoichiometric, stable, and specific association of integrin alpha3beta1 with CD151 provides a major link to phosphatidylinositol 4-kinase, and may regulate cell migration. Mol Biol Cell. 1998;9:2751–2765. doi: 10.1091/mbc.9.10.2751. [DOI] [PMC free article] [PubMed] [Google Scholar]
- 68.Zhang XA, Kazarov AR, Yang X, Bontrager AL, Stipp CS, Hemler ME. Function of the tetraspanin CD151-alpha6beta1 integrin complex during cellular morphogenesis. Mol Biol Cell. 2002;13:1–11. doi: 10.1091/mbc.01-10-0481. [DOI] [PMC free article] [PubMed] [Google Scholar]
- 69.Kazarov AR, Yang X, Stipp CS, Sehgal B, Hemler ME. An extracellular site on tetraspanin CD151 determines alpha 3 and alpha 6 integrin-dependent cellular morphology. J Cell Biol. 2002;158:1299–1309. doi: 10.1083/jcb.200204056. [DOI] [PMC free article] [PubMed] [Google Scholar]
- 70.Maecker HT. Human CD81 directly enhances Th1 and Th2 cell activation, but preferentially induces proliferation of Th2 cells upon long-term stimulation. BMC Immunol. 2003;4:1. doi: 10.1186/1471-2172-4-1. [DOI] [PMC free article] [PubMed] [Google Scholar]
- 71.Tardif MR, Tremblay MJ. Tetraspanin CD81 provides a costimulatory signal resulting in increased human immunodeficiency virus type 1 gene expression in primary CD4+ T lymphocytes through NF-kappaB, NFAT, and AP-1 transduction pathways. J Virol. 2005;79:4316–4328. doi: 10.1128/JVI.79.7.4316-4328.2005. [DOI] [PMC free article] [PubMed] [Google Scholar]
- 72.Pata S, Otahal P, Brdicka T, Laopajon W, Mahasongkram K, Kasinrerk W. Association of CD99 short and long forms with MHC class I, MHC class II and tetraspanin CD81 and recruitment into immunological synapses. BMC Res Notes. 2011;4:293. doi: 10.1186/1756-0500-4-293. [DOI] [PMC free article] [PubMed] [Google Scholar]
Associated Data
This section collects any data citations, data availability statements, or supplementary materials included in this article.