Abstract
In this paper, we present two models for automatically extracting red blood cells (RBCs) from RBCs holographic images based on a deep learning fully convolutional neural network (FCN) algorithm. The first model, called FCN-1, only uses the FCN algorithm to carry out RBCs prediction, whereas the second model, called FCN-2, combines the FCN approach with the marker-controlled watershed transform segmentation scheme to achieve RBCs extraction. Both models achieve good segmentation accuracy. In addition, the second model has much better performance in terms of cell separation than traditional segmentation methods. In the proposed methods, the RBCs phase images are first numerically reconstructed from RBCs holograms recorded with off-axis digital holographic microscopy. Then, some RBCs phase images are manually segmented and used as training data to fine-tune the FCN. Finally, each pixel in new input RBCs phase images is predicted into either foreground or background using the trained FCN models. The RBCs prediction result from the first model is the final segmentation result, whereas the result from the second model is used as the internal markers of the marker-controlled transform algorithm for further segmentation. Experimental results show that the given schemes can automatically extract RBCs from RBCs phase images and much better RBCs separation results are obtained when the FCN technique is combined with the marker-controlled watershed segmentation algorithm.
OCIS codes: (090.1995) Digital holography, (100.6890) Three-dimensional image processing, (170.3880) Medical and biological imaging, (150.0150) Machine vision, (150.1135) Algorithms
1. Introduction
Because the limitations inherent in traditional two-dimensional (2D) imaging techniques when used with transparent or semitransparent biological organisms, three-dimensional (3D) imaging systems have been developed and are widely used for transparent or semitransparent biological specimen imaging and visualization [1–6]. Among these 3D imaging methods, digital holographic microscopy (DHM), a low-cost, noninvasive, and rapid visualization approach, is being extensively researched and has been successfully applied to specimen, such as cardiomyocytes and red blood cells (RBCs) measurement [6–20].
In this study, the hologram of RBCs was recorded using DHM and RBCs phase images reconstructed from their holograms using a numerical reconstruction algorithm [21-22]. The RBCs obtained from DHM can provide cell thickness and 3D morphology information that is helpful in RBC quantitative analysis and beneficial to medical diagnosis. In order to conduct further RBCs analysis, determination of specific RBCs in RBCs phase images is essential. Therefore, analyzing RBC-based properties from extracted RBCs would be much more accurate and beneficial to patients. For instance, the number of RBCs is related to patient’s health and can be used to investigate hypotheses about pathological processes in clinical pathology, while the cell concentration is very important in molecular biology for adjusting the amount of chemicals applied in experiments. Moreover, it is much easier to identify any abnormality and analyze RBC-related diseases from segmented RBCs images.
However, the task is tedious and time-consuming if the RBCs are segmented and counted manually. Consequently, many automated algorithms have been proposed for RBCs segmentation. Three main kinds of cells segmentation approaches have been presented: region-based, edge-based, and energy-based [23–32]. The RBCs segmentation methods presented in [23-24] are region-based algorithms, whereas those presented in [25-26] and [27-28] are edge-based and energy-based, respectively. However, most of the segmentation methods applied to RBCs images are based on 2D imaging systems, with only a few being based on RBCs phase images obtained via DHM imaging. In addition, most of these techniques cannot segment the RBCs images when multiple RBCs are connected. In our previous work, we combined the marker-controlled watershed algorithm with morphological operations and segmented RBCs phase images obtained using the DHM technique with good results [26]. Nevertheless, the approach proposed in [26] cannot properly segment heavily overlapped and multiple touched RBCs as well. Therefore, developing a more robust algorithm for RBC phase image segmentation is essential for further RBC analysis.
Deep learning is a promising technique that is able to achieve results superior to those obtainable using traditional methods. Consequently, it is extensively studied in the computer vision community [33–40]. Krizhevsky et al. [35] used convolutional neural networks for image classification to very good effect. Mikolov et al. [36] and Liu et al. [37] obtained good performance from recurrent neural networks in text classification and translation. Long et al. [38] proposed a fully convolutional neural network (FCN) for semantic segmentation and obtained surprising outcomes. FCNs have the advantage of end-to-end training and produce pixel-wise prediction. Moreover, the size of the image inputted to an FCN algorithm can be arbitrary, which differs from other image segmentation deep learning algorithms, such as convolutional neural networks [35]. Some other kinds of FCN algorithms such as U-net [33] and SegNet [34] are also proposed for semantic segmentation and applied to biological images. In this study, we apply the FCN technique to RBCs phase images for RBCs segmentation. We develop two RBCs segmentation schemes. In the first scheme, FCN-1, the RBCs phase images and their manually segmented RBCs are used as a true label to train the FCN model. The trained model is then applied to predict RBCs phase image pixels as either foreground (RBCs) or background for RBCs segmentation. In the second scheme named as FCN-2, we combine the FCN model with the marker-controlled watershed transform algorithm to segment the RBCs. In FCN-2, we only use the fully convolutional neural network to predict the inner part of each red blood cell and then regard the predicted results as internal markers of marker-controlled watershed algorithm so as to further segment the RBCs. In the second scheme, the training label image is not the mask of all the segmented cells; it is erosion results of that mask, which represents the inner area of each RBC.
Consequently, we first use a 3D imaging technique called off-axis DHM to record these RBCs and then apply the numerical reconstruction algorithm to reconstruct RBCs phase images from their holograms. Next, two kinds of training images are prepared from RBCs phase images and the FCNs trained for the two different schemes. One of the FCNs is used to predict all of the cells, whereas the other is only used to predict the inside part of each RBC and the predicted results further combine with the marker-controlled watershed method to segment the RBCs. We then compare the segmentation results from the two methods with those obtained using other methods in terms of segmentation accuracy and cell separation ability. Our experimental results indicate that our methods achieve good segmentation results overall, with the FCN-2 model giving the best performance in terms of separation of overlapped RBCs. The remainder of this paper is organized as follows. Section 2 describes the principle underlying off-axis DHM. Section 3 discusses FCNs. Section 4 outlines the RBCs segmentation procedure. Section 5 presents and discusses the experimental results obtained. Section 6 presents concluding remarks.
2. Off-axis digital holographic microscopy
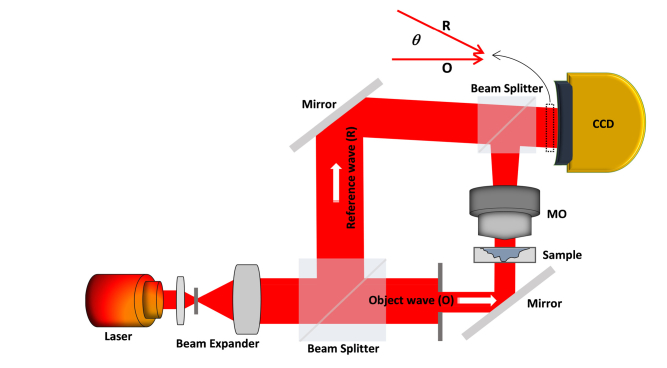
Off-Axis DHM is a three-dimensional imaging technique that has been researched for application in the area of cell biology, including 3D cell visualization, classification, recognition, and tracking [6–17, 41–44]. Off-axis DHM, which is also a noninvasive interferometric microscopy technique, provides a quantitative measure of the optical path length. Figure 1 shows the schematic of an off-axis DHM system used to capture the hologram of an imaging target sample. As shown in Fig. 1, off-axis DHM is a modified Mach-Zehnder configuration in which a laser diode source is used in off-axis geometry [45]. Usually, a low intensity laser is used as the light source for target sample illumination in the DHM imaging system (a λ = 682nm laser diode source is utilized in this experiment). In off-axis DHM, the laser beam from the laser diode source is split into object wave and reference wave. Then, the object wave passing through the imaging target sample is diffracted and further magnified by a 40 × /0.75 numerical aperture microscopy objective. Subsequently, a hologram consisting of interference patterns between reference beam and diffracted and magnified object beam in the off-axis geometry is recorded via a charge-coupled device (CCD) camera. As a result, the quantitative phase images are numerically reconstructed from the recorded hologram using a specific numerical algorithm, as described in [21,22]. Thanks to current computing power, the phase images can be reconstructed from the hologram at a speed of 100 images per second, which achieves real-time processing.
Fig. 1.
Schematic of an off-axis digital holographic microscopy (DHM).
3. Fully convolutional neural networks
Fully convolutional neural networks (FCNs), an extension of convolutional neural networks [35], have become the mainstream algorithm in the field of semantic segmentation since the amazing performance achieved by Long et al. [38]. FCNs have the advantage of training and inferring on images with arbitrary sizes and making pixel-wise prediction for semantic segmentation. They have been attracting increasing attention and have been successfully applied to biomedical images, such as cardiac segmentation in MRI and liver and lesion segmentation in CT, with good results [46,47].
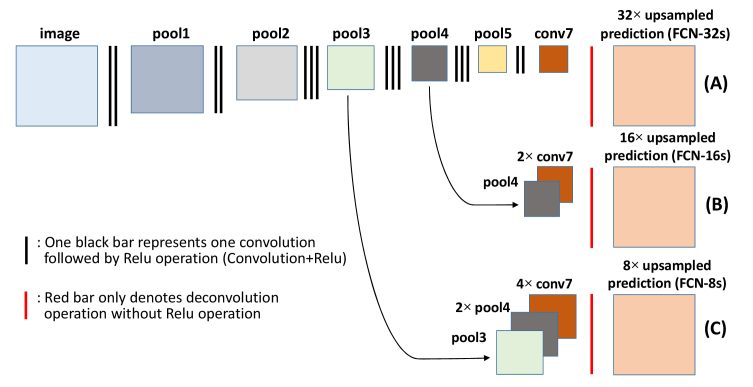
Different from convolutional neural networks, there are no fully connected layers in the FCNs [38]. Figure 2 (Row A) shows the general network architecture of an FCN. The network is constructed with some basic layers, which consist of convolution (conv), pooling (pool), activation, and deconvolution (deConv) [35, 38]. Convolution layer which is the convolution operation between image or feature map and a kernel refers to the feature extraction; pooling mainly refers to max pooling in the FCN that results in shrinkage of feature maps in spatial dimension, max pooling has the advantage of leading to faster convergence rate by selecting superior invariant features that can enhance the performance of generalization; activation layer in FCN algorithm mainly refers to the rectified linear units (Relu) [38], which is defined as f(x) = max(0, x), where x is the input value to a neuron. Because an FCN is an end-to-end and pixel-to-pixel training/prediction technique, the FCN output must be the same size as the ground truth image, i.e., the same size as the input image. Consequently, the deconvolutional (deConv) layer is used to map the feature resolution into the same size of input image. The deconvolutional operation is achieved by upsampling the previous coarse output maps followed by convolutional manipulation. Therefore, the FCN can consume an image of arbitrary size and output a dense prediction map of the same size. The local connectivity property of the convolutional, pooling, Relu, and deconvolutional layers also result in FCN having a translation invariant feature [38]. A loss layer is included in the FCN training phase so that the network parameters are learned by minimizing the cost value [38]. Some other layers such as batch normalization, dropout, and softmax are also widely used in FCNs [33,34,38]. Specifically, each layer of data in the FCN is a three-dimensional array in size of h × w × d, where h and w are spatial dimensions, and d is the dimension of feature. The basic units in FCN (convolution, pooling, and activation functions) only operate on local input regions and depend on relative spatial coordinates. Assigning xij for data vector at location (i, j) in a particular layer, and yij represents the output of this layer or the input of next layer, the yij is derived by following expression [38]:
| (1) |
where k is the kernel size, s is the stride, fks is the function determined by the layer type that a matrix multiplication for convolutional layer, a spatial max for max pooling layer, or an elementwise nonlinear function such as Relu for an activation layer, an interpolation function followed by matrix multiplication for deconvolutional layer, and so on for other types of layers. The functional form in Eq. (1) is maintained by kernel size and stride satisfying with the following transformation rule [38]:
| (2) |
where represents function composition.
Fig. 2.
Fully convolutional neural networks [38]. Row A: Single-stream net, upsamples stride 32 predictions back to pixels in a single step (FCN-32s); Row B: Fusing predictions from both the final convolutional layer and the pool4 layer for additional prediction (FCN-16s); Row C: Fusing predictions from the final convolutional layer, pool4, and pool3 for additional prediction (FCN-8s).
The parameters of an FCN model only exist in the kernel used in the convolutional and deconvolutional layer. Thus, the total number of parameters required for an FCN is much smaller than that for a fully connected deep neural network when the same number of hidden units is utilized. Further, the number of parameters is even smaller than that in convolutional neural networks. The relatively small number of parameters required by an FCN is beneficial in network training. In an FCN, the feed-forward passing through the network provides a dense prediction map and the loss function defined as a sum over the spatial dimensions of the final layer combined with information from the ground truth label image is minimized by the backpropagation algorithm in order to learn the network [48]. That is, the forward direction in an FCN is for inference, whereas the backward direction is for learning.
Following a series of successful application of FCN to semantic segmentation, many new algorithms based on the FCN technique and specific scenarios have been proposed. They are widely studied in the image segmentation, classification, and tracking fields [38, 49,50]. Long et al. [38] proposed two other FCN architectures with different upsampling scale to compensate the shortcoming of the main FCN architecture, which requires a total of 32 × upsampling. The other two FCN architectures (FCN-16s and FCN-8s in [38]) fuse the pooling information at different layers and reportedly give significantly better semantic segmentation results than the original. The network architectures of FCN-16s and FCN-8s are also shown in Fig. 2 (Row B is FCN-16s and Row C is FCN-8s). For example, in FCN-8s, the coarse output from the FCN model is first 4 × upsampled and the pool4 image is 2 × upsampled. Then, these upsampled images are fused with the image at the pool3 layer and the fused images are finally 8 × upsampled to obtain the prediction image with the same size as the input image.
4. RBCs segmentation
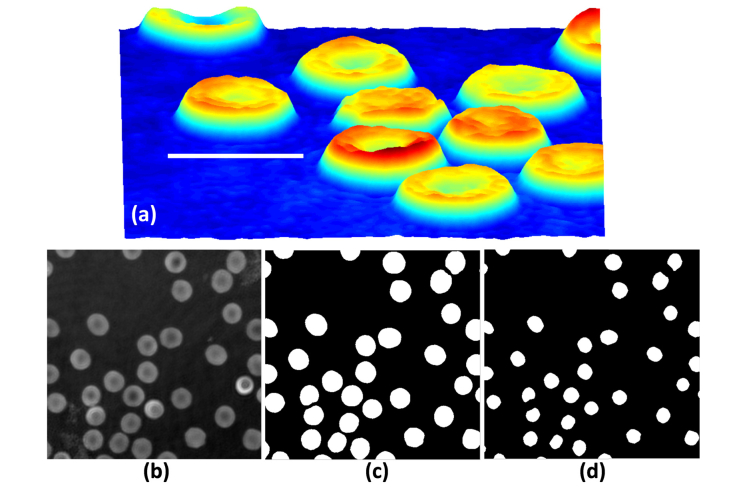
In this section, the RBCs phase image segmentation procedure is presented. The RBC hologram is first recorded using off-axis DHM and the corresponding RBCs phase image numerically reconstructed using the numerical algorithm in [21-22]. Training data sets were prepared in order to use the FCNs for RBCs phase image segmentation. We designed two kinds of training data sets for RBCs segmentation using the FCN model. In the first scheme (FCN-1), we manually segmented the RBCs in the RBCs phase image and used the mask of the segmented RBCs phase image as the ground truth label image, in which ones denote the RBCs target and zeros the background. One of the RBCs phase images obtained by off-axis DHM is shown along with the corresponding prepared ground truth label images in Fig. 3. The FCN was trained by minimizing the error defined between the ground truth label image and the prediction image resulting from the FCN inference process. Then, the trained FCN was used to predict the class (0: background, 1: RBCs target) of each pixel in the RBCs phase image. In this approach, the segmented results are viewed as the final RBCs segmentation results because the training data set expresses the entire segmented RBCs. In the second scheme (FCN-2), the ground truth label image only denotes the center part of each RBC in the RBCs phase image. These ground truth label images were obtained conducting morphological erosion [51] on the ground truth label image from the first scheme (FCN-1) with a structuring elements of size seven. One of the ground truth label images used with the FCN-2 model is given in Fig. 3. Consequently, the FCN-2 scheme was trained and used to predict the center part of each RBC. Because this method cannot segment RBCs directly, we combined the FCN model with the marker-controlled watershed transform method for RBCs phase image segmentation. The predicted center part of RBCs from FCN is perfectly viewed as the internal markers of the marker-controlled watershed transform algorithm. Thus, the RBCs phase images were finally segmented using the marker-controlled watershed segmentation algorithm. Flowcharts for the two schemes are presented in Fig. 4.
Fig. 3.
RBC’s phase images and ground truth label images. (a) RBC’s 3D profile obtained by off-axis DHM, (b) A reconstructed RBCs phase image, (c) A ground truth label image for the FCN-1 model, (d) A ground truth label image for the FCN-2 model. Bar is 10μm.
Fig. 4.
Flowchart for (a) FCN-1 model, (b) FCN-2 model.
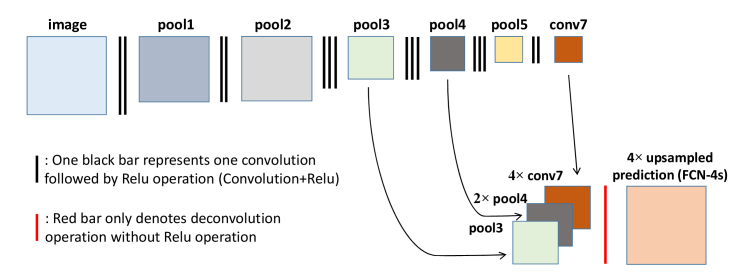
The original FCN model in [38], which performs max pooling layer five times, is not very robust to small object segmentation [40] due to the large upsampling scale value. In this study, we only used the max pooling layer four times. The proposed FCN structure is given in Fig. 5. As can be seen in the figure, there is no max pooling operation at the second layer and the image size in the pool2 layer is the same as that of the previous layer. Further, the image in the pool5 layer is 4 × upsampled and fused with the 2 × upsampling image at the pool4 layer and the image at the pool3 layer. The final layer is 4 × upsampled from the fused image. The relative small upsampling scale value in the last layer can help to get fine segmentation results. For FCN training, the pre-trained VGG-16 Caffe model [52] was used to initialize the parameters in the two schemes. Here, these parameters within layers that are also existed in the VGG-16 network are initialized with corresponding weight values in pre-trained VGG-16 Caffe model [52] while other parameters are randomly initialized [33–35]. Training a deep learning model with pre-trained model is a good strategy to help converge the network while training a network from scratch usually needs more training image and times [38].
Fig. 5.
FCN structure used for RBCs phase image segmentation.
5. Experimental results
All the RBCs analyzed in our experiment were taken from healthy laboratory personnel in the Laboratoire Suisse d’ Analyse Du Dopage, CHUV and their holograms recorded with off-axis DHM. The RBCs phase images were reconstructed from these RBCs off-axis holograms using a computational numerical algorithm. One of the reconstructed RBCs phase images is given in Figs. 3(a) and 3(b). We manually segmented 50 RBCs phase images for the training and testing data sets. The size of each RBCs phase image was 700 × 700. To increase the size of the training and testing images, we randomly cropped five images with size 384 × 384 from each 700 × 700 RBCs phase image. The ratio of the training data set to the testing data set was set to 7:3. The corresponding ground truth label images for Fig. 3(b) RBCs phase image in the FCN-1 and FCN-2 models are also shown in Fig. 3. For the FCN training, stochastic gradient descent [53] was used to optimize the loss function in order to fine-tune the FCN model. The momentum value was set to 0.99 and the weight decay, which is used to regularize the loss function, was 0.0005. Further, the learning rate was set to 0.01 and decreased by a factor of 10 every 1000 iterations. The weights for the shared layers were initialized with trained VGG-16 neural networks and those for the varied layers with values randomly extracted from normal distribution. The iteration number is set to be 4000. Our FCN models were trained on a computer equipped with an NVIDIA Tesla K20 GPU and running Ubuntu 15.04. The training time for the FCN models with the given specification was 58 minutes on the Caffe deep learning framework [54].
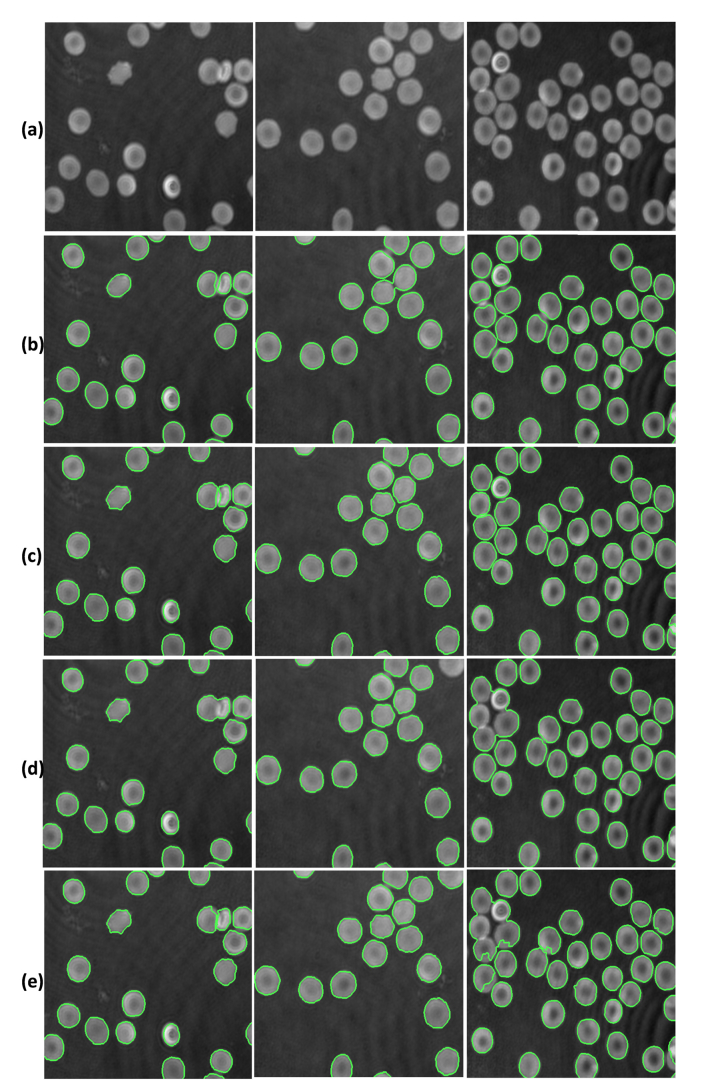
In order to show the feasibility of our two proposed schemes for RBCs phase image segmentation, they were compared to two other methods, one by Yi et al. [26] and the other by Yang et al. [55]. Three of the RBCs phase images segmentation results from these methods are given in Fig. 6. Visually, it is clear from Fig. 6 that all the algorithms perform well for RBCs phase images in which there are no overlapped RBCs. On the other hand, our proposed methods, especially the FCN-2 model, appear to perform better on those RBCs phase images with touched and overlapped RBCs. Here, the segmentation accuracy (SA) is used for quantitative analysis of the segmentation results. The SA is defined as follows:
| (3) |
where Sseg and Sgt are the segmented region and the “ground truth” region, which are manually extracted as the gold standard, andsignifies the number of pixel points in a certain region, Sseg or Sgt. The segmentation accuracy tends to be one when the segmentation results are very similar to the ground truth. The higher the SA is, the better the performance of a segmentation algorithm. In this study, 20 RBCs phase images, each consisting of approximately 70 RBCs, were used to calculate the segmentation accuracy among these methods. The quantitative evaluation of the segmentation results for our proposed methods and the methods by Yi et al. [26] and Yang et al. [55] are given in Table 1. As stated above, FCN-1 is the first scheme in our proposed RBCs phase image segmentation method and FCN-2 is the second one.
Fig. 6.
Segmentation results for the four segmentation algorithms. (a) Original RBC phase images, (b) Segmentation results using FCN-1, (c) Segmentation results using FCN-2, (d) Segmentation results using Yi et al.’s method [26], (e) Segmentation results using Yang et al.’s method [55]).
Table 1. Segmentation Accuracy on RBCs Phase Image.
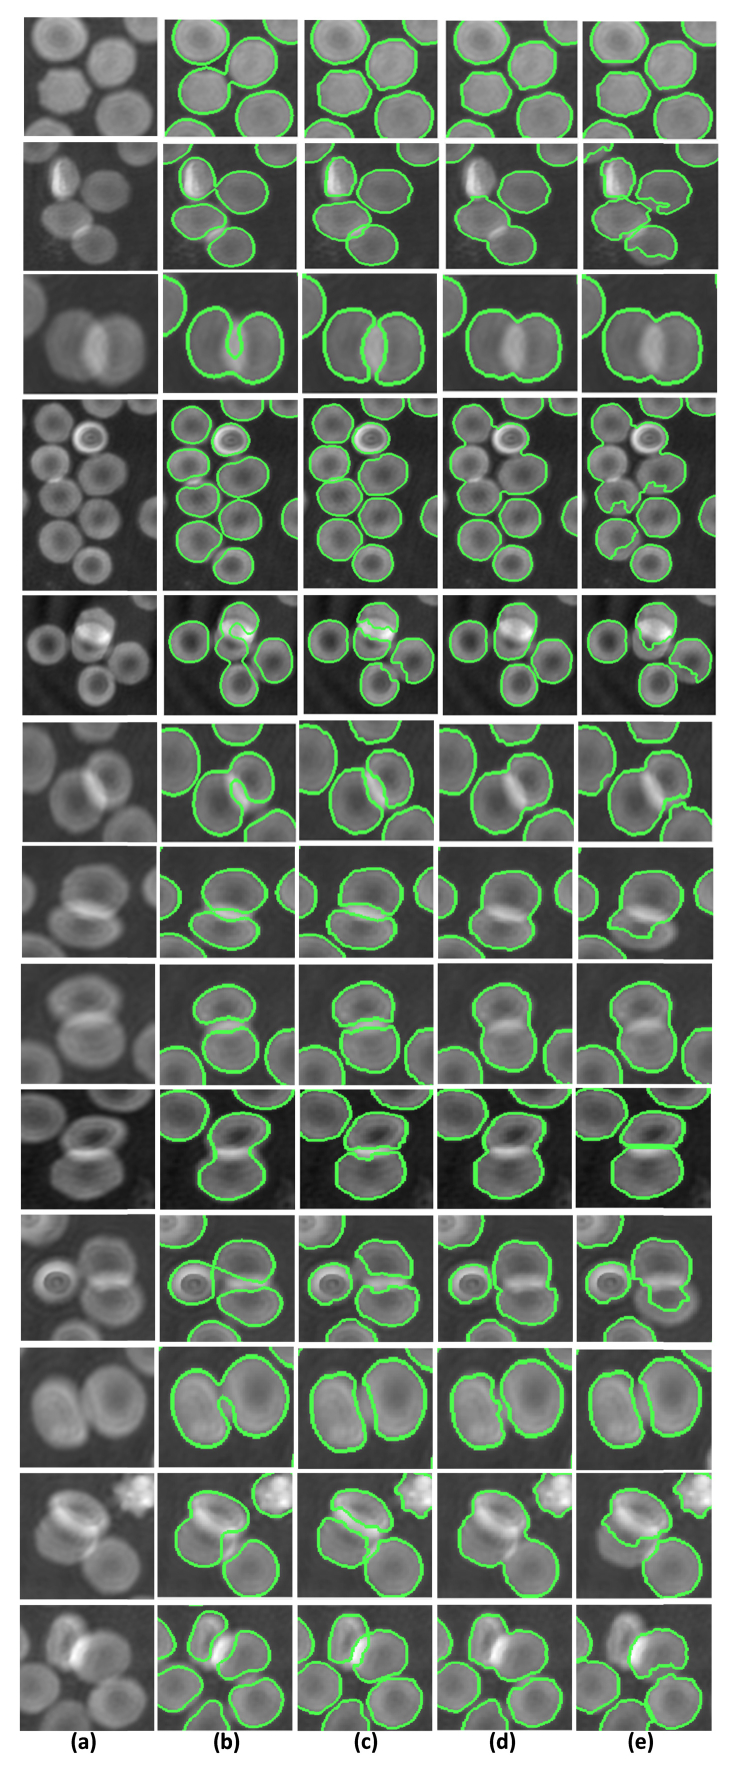
It is clear from Table 1 that the FCN-2 method achieved the best segmentation results in terms of segmentation accuracy. This is because it can appropriately handle the RBCs touching and overlap problem in RBCs phase images, whereas the methods by Yi et al. [26] and Yang et al. [55] cannot separate multiple connected RBCs or heavily overlapped RBCs. To demonstrate the RBCs separation ability of the connected or overlapped RBCs of these segmentation algorithms, some segmentation results for regions with connected or overlapped RBCs are given in Fig. 7. It is clear from the figure that the proposed FCN-2 scheme separates the RBCs well in the RBCs phase images. Yang et al.’s method [55] uses two structuring elements with different sizes to separate the connected target. The method can only divide two connected cells; furthermore, defining the size of the structuring element is difficult. Yi et al.’s method [26] separates the connected RBCs using morphological operations, and has difficulty defining the size of the structuring element used because the size of each RBC and connected area is different. The FCN-1 model would achieve better performance in terms of RBCs separation if more data containing connected RBCs were used for training.
Fig. 7.
RBCs separation. (a) Connected RBCs region in original RBCs phase images, (b) RBCs separation results using FCN-1, (c) RBCs separation results using FCN-2, (d) RBCs separation results using Yi et al.’s method [26], (e) RBCs separation results using Yang et al.’s method [55].
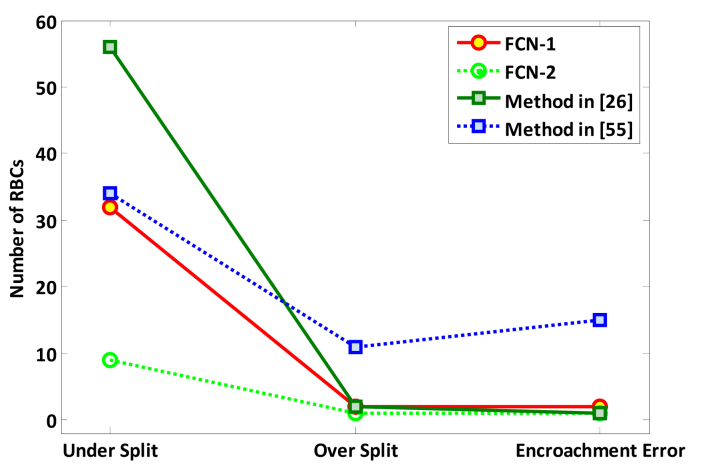
In this study, the metrics under-separating, over-separating, and encroachment errors were adopted to quantitatively measure the RBCs separation ability of these RBCs phase image segmentation methods. Under-separating is defined as the number of non-separated RBCs for the connected or overlapped RBCs and over-separating signifies the number of RBC divisions within a single non-touching RBC. The encroachment error refers to the number of incorrect RBC separations. The measured values for under-separating, over-separating, and encroachment error for 33 RBCs phase images with 150 overlapped RBC regions and approximately 1000 RBCs are given in Table 2. RBCs separation evaluation curves for the four methods are also shown in Fig. 8. It is clear that the methods proposed in this paper have better separation ability that those by Yi et al. [26] and Yang et al. [55]. Moreover, the FCN-2 method produced the best result in terms of RBC separation ability. This means that combining FCN with the marker-controlled watershed transform algorithm can further improve the segmentation performance.
Table 2. RBCs Separation Evaluation.
Fig. 8.
RBCs separation evaluation results.
The time consumed by the FCN fine-tuning process based on the Caffe deep learning framework was 58 minutes. The average computing time for RBC phase image prediction/segmentation was 11.36 seconds for FCN-1 and 12.96 seconds for FCN-2 on the 20 RBCs phase images with size 700 × 700. In contrast, the average computing times on 700 × 700 images using Yi et al.’s method [26] and Yang et al.’s method [55] were 4.67 seconds and 7.83 seconds, respectively. Thus, it is to be noted that our methods achieve superior segmentation accuracy and RBCs separation performance but sacrifice efficiency in terms of computing time. However, as computing power will continue to increase into the foreseeable future, this is not a major problem.
6. Conclusions
In this study, two models based on FCNs were developed and used for automated RBCs extraction in RBCs phase images numerically reconstructed from digital holograms obtained using off-axis DHM. In the first model, only fully convolutional networks are utilized for the semantic segmentation of RBCs phase images, whereas the second model combines fully convolutional networks with the marker-controlled watershed transform algorithm for RBCs segmentation. The parameters of the FCNs were initialized using a VGG 16-layer net and fine-tuned by manually labeled RBCs phase images in the two models separately. Experimental results show that the two proposed approaches can automatically segment the red blood cells in RBCs phase images. However, connected and overlapped RBCs in RBCs phase images are better handled by the second proposed model. Comparison results reveal that our methods achieve better performance than two other proposed algorithms in terms of RBCs segmentation accuracy and RBCs separation ability for overlapped RBCs. All the individual methods in this paper are already existed whereas it is a total new idea to combine FCNs with marker-controlled watershed transform approach to separate connected RBCs. To the best of our knowledge, it is also the first work to apply deep learning algorithm to the digital holographic RBCs images. The proposed methods are useful for quantitatively analyzing red blood morphology and other features that enable diagnosis of RBC-related diseases, and can be used in a variety of cell identification approaches [56].
Conflicts of Interests
The authors declare that there are no conflicts of interest related to this article.
Funding
Basic Science Research Program through the National Research Foundation of Korea (NRF) funded by the Ministry of Science, ICT & Future Planning (NRF-2015K1A1A2029224 and NRF-2015R1A2A1A10052566). B. Javidi acknowledges support under National Science Foundation (NSF) under Grant NSF ECCS 1545687.
References and links
- 1.Roma P., Siman L., Amaral F., Agero U., Mesquita O., “Total three-dimensional imaging of phase objects using defocusing microscopy: Application to red blood cells,” Appl. Phys. Lett. 104(25), 251107 (2014). 10.1063/1.4884420 [DOI] [Google Scholar]
- 2.Nehmetallah G., Banerjee P., “Applications of digital and analog holography in three-dimensional imaging,” Adv. Opt. Photonics 4(4), 472–553 (2012). 10.1364/AOP.4.000472 [DOI] [Google Scholar]
- 3.Javidi B., Moon I., Yeom S., Carapezza E., “Three-dimensional imaging and recognition of microorganism using single-exposure on-line (SEOL) digital holography,” Opt. Express 13(12), 4492–4506 (2005). 10.1364/OPEX.13.004492 [DOI] [PubMed] [Google Scholar]
- 4.Moon I., Daneshpanah M., Javidi B., Stern A., “Automated three-dimensional identification and tracking of micro/nanobiological organisms by computational holographic microscopy,” Proc. IEEE 97(6), 990–1010 (2009). 10.1109/JPROC.2009.2017563 [DOI] [Google Scholar]
- 5.Yi F., Moon I., Lee Y. H., “Extraction of target specimens from bioholographic images using interactive graph cuts,” J. Biomed. Opt. 18(12), 126015 (2013). 10.1117/1.JBO.18.12.126015 [DOI] [PMC free article] [PubMed] [Google Scholar]
- 6.Memmolo P., Miccio L., Merola F., Gennari O., Netti P. A., Ferraro P., “3D morphometry of red blood cells by digital holography,” Cytometry A 85(12), 1030–1036 (2014). 10.1002/cyto.a.22570 [DOI] [PubMed] [Google Scholar]
- 7.Marquet P., Rappaz B., Magistretti P. J., Cuche E., Emery Y., Colomb T., Depeursinge C., “Digital holographic microscopy: a noninvasive contrast imaging technique allowing quantitative visualization of living cells with subwavelength axial accuracy,” Opt. Lett. 30(5), 468–470 (2005). 10.1364/OL.30.000468 [DOI] [PubMed] [Google Scholar]
- 8.Yi F., Moon I., Lee Y. H., “Three-dimensional counting of morphologically normal human red blood cells via digital holographic microscopy,” J. Biomed. Opt. 20(1), 016005 (2015). 10.1117/1.JBO.20.1.016005 [DOI] [PubMed] [Google Scholar]
- 9.Rappaz B., Moon I., Yi F., Javidi B., Marquet P., Turcatti G., “Automated multi-parameter measurement of cardiomyocytes dynamics with digital holographic microscopy,” Opt. Express 23(10), 13333–13347 (2015). 10.1364/OE.23.013333 [DOI] [PubMed] [Google Scholar]
- 10.Moon I., Javidi B., “3-D visualization and identification of biological microorganisms using partially temporal incoherent light in-line computational holographic imaging,” IEEE Trans. Med. Imaging 27(12), 1782–1790 (2008). 10.1109/TMI.2008.927339 [DOI] [PubMed] [Google Scholar]
- 11.Anand A., Chhaniwal V., Patel N., Javidi B., “Automatic identification of malaria infected RBC with digital holographic microscopy using correlation algorithms,” IEEE Photonics J. 4(5), 1456–1464 (2012). 10.1109/JPHOT.2012.2210199 [DOI] [Google Scholar]
- 12.Moon I., Javidi B., “3D identification of stem cells by computational holographic imaging,” J. R. Soc. Interface 4(13), 305–313 (2007). 10.1098/rsif.2006.0175 [DOI] [PMC free article] [PubMed] [Google Scholar]
- 13.Moon I., Javidi B., “Volumetric three-dimensional recognition of biological microorganisms using multivariate statistical method and digital holography,” J. Biomed. Opt. 11(6), 064004 (2006). 10.1117/1.2397576 [DOI] [PubMed] [Google Scholar]
- 14.Moon I., Anand A., Cruz M., Javidi B., “Identification of malaria-infected red blood cells via digital shearing interferometry and statistical inference,” IEEE Photonics J. 5(5), 6900207 (2013). 10.1109/JPHOT.2013.2278522 [DOI] [Google Scholar]
- 15.Kemper B., Bauwens A., Vollmer A., Ketelhut S., Langehanenberg P., Müthing J., Karch H., von Bally G., “Label-free quantitative cell division monitoring of endothelial cells by digital holographic microscopy,” J. Biomed. Opt. 15(3), 036009 (2010). 10.1117/1.3431712 [DOI] [PubMed] [Google Scholar]
- 16.Shaked N. T., Satterwhite L. L., Bursac N., Wax A., “Whole-cell-analysis of live cardiomyocytes using wide-field interferometric phase microscopy,” Biomed. Opt. Express 1(2), 706–719 (2010). 10.1364/BOE.1.000706 [DOI] [PMC free article] [PubMed] [Google Scholar]
- 17.Dubois F., Yourassowsky C., Monnom O., Legros J. C., Debeir O., Van Ham P., Kiss R., Decaestecker C., “Digital holographic microscopy for the three-dimensional dynamic analysis of in vitro cancer cell migration,” J. Biomed. Opt. 11(5), 054032 (2006). 10.1117/1.2357174 [DOI] [PubMed] [Google Scholar]
- 18.Choi W., Fang-Yen C., Badizadegan K., Oh S., Lue N., Dasari R. R., Feld M. S., “Tomographic phase microscopy,” Nat. Methods 4(9), 717–719 (2007). 10.1038/nmeth1078 [DOI] [PubMed] [Google Scholar]
- 19.Merola F., Memmolo P., Miccio L., Savoia R., Mugnano M., Fontana A., D’Ippolito G., Sardo A., Iolascon A., Gambale A., Ferraro P., “Tomographic flow cytometry by digital holography,” Light Sci. Appl. 6(4), e16241 (2016). 10.1038/lsa.2016.241 [DOI] [PMC free article] [PubMed] [Google Scholar]
- 20.Liu P. Y., Chin L. K., Ser W., Chen H. F., Hsieh C. M., Lee C. H., Sung K. B., Ayi T. C., Yap P. H., Liedberg B., Wang K., Bourouina T., Leprince-Wang Y., “Cell refractive index for cell biology and disease diagnosis: past, present and future,” Lab Chip 16(4), 634–644 (2016). 10.1039/C5LC01445J [DOI] [PubMed] [Google Scholar]
- 21.Cuche E., Marquet P., Depeursinge C., “Simultaneous amplitude-contrast and quantitative phase-contrast microscopy by numerical reconstruction of Fresnel off-axis holograms,” Appl. Opt. 38(34), 6994–7001 (1999). 10.1364/AO.38.006994 [DOI] [PubMed] [Google Scholar]
- 22.Colomb T., Cuche E., Charrière F., Kühn J., Aspert N., Montfort F., Marquet P., Depeursinge C., “Automatic procedure for aberration compensation in digital holographic microscopy and applications to specimen shape compensation,” Appl. Opt. 45(5), 851–863 (2006). 10.1364/AO.45.000851 [DOI] [PubMed] [Google Scholar]
- 23.Ruberto C., Dempster A., Khan S., Jarra B., “Analysis of infected blood cell images using morphological operators,” Image Vis. Comput. 20(2), 133–146 (2002). 10.1016/S0262-8856(01)00092-0 [DOI] [Google Scholar]
- 24.Poon S. S., Ward R. K., Palcic B., “Automated image detection and segmentation in blood smears,” Cytometry 13(7), 766–774 (1992). 10.1002/cyto.990130713 [DOI] [PubMed] [Google Scholar]
- 25.Choi Y. S., Lee S. J., “Three-dimensional volumetric measurement of red blood cell motion using digital holographic microscopy,” Appl. Opt. 48(16), 2983–2990 (2009). 10.1364/AO.48.002983 [DOI] [PubMed] [Google Scholar]
- 26.Yi F., Moon I., Javidi B., Boss D., Marquet P., “Automated segmentation of multiple red blood cells with digital holographic microscopy,” J. Biomed. Opt. 18(2), 026006 (2013). 10.1117/1.JBO.18.2.026006 [DOI] [PubMed] [Google Scholar]
- 27.Nilsson B., Heyden A., “Model-based segmentation of leukocytes clusters,” in Proceedings of Pattern Recognition, (2002), pp. 727–730. [Google Scholar]
- 28.Ongun G., Halici U., Leblebicioğlu K., Atalay V., Beksaç S., Beksaç M., “Automated contour detection in blood cell images by an efficient snake algorithm,” Nonlinear Anal Theory Methods Appl. 47(9), 5839–5847 (2001). 10.1016/S0362-546X(01)00707-6 [DOI] [Google Scholar]
- 29.Song Y., Tan E. L., Jiang X., Cheng J. Z., Ni D., Chen S., Lei B., Wang T., “Accurate Cervical Cell Segmentation from Overlapping Clumps in Pap Smear Images,” IEEE Trans. Med. Imaging 36(1), 288–300 (2017). 10.1109/TMI.2016.2606380 [DOI] [PubMed] [Google Scholar]
- 30.Su H., Yin Z., Huh S., Kanade T., Zhu J., “Interactive cell segmentation based on active and semi-supervised learning,” IEEE Trans. Med. Imaging 35(3), 762–777 (2016). 10.1109/TMI.2015.2494582 [DOI] [PubMed] [Google Scholar]
- 31.Dorini L. B., Minetto R., Leite N. J., “Semiautomatic white blood cell segmentation based on multiscale analysis,” IEEE J. Biomed. Health Inform. 17(1), 250–256 (2013). 10.1109/TITB.2012.2207398 [DOI] [PubMed] [Google Scholar]
- 32.Lu C., Mandal M., “Toward automatic mitotic cell detection and segmentation in multispectral histopathological images,” IEEE J. Biomed. Health Inform. 18(2), 594–605 (2014). 10.1109/JBHI.2013.2277837 [DOI] [PubMed] [Google Scholar]
- 33.Ronneberger O., Fischer P., Brox T., “U-net: Convolutional networks for biomedical image segmentation,” In Proceedings of International Conference on Medical Image Computing and Computer-Assisted Intervention, (Springer International Publishing, 2015), pp. 234–241. 10.1007/978-3-319-24574-4_28 [DOI] [Google Scholar]
- 34.V. Badrinarayanan, A. Kendall, and R. Cipolla, “Segnet: A deep convolutional encoder-decoder architecture for image segmentation,” Machine Intelligence Lab, Department of Engineering, University of Cambridge, Tech. Rep. (2016). [DOI] [PubMed]
- 35.Krizhevsky A., Sutskever I., Hinton G., “Imagenet classification with deep convolutional neural networks,” in Proceedings of Advances in neural information processing systems, (2012), pp. 1097–1105. [Google Scholar]
- 36.Mikolov T., Karafiát M., Burget L., Cernocký J., Khudanpur S., “Recurrent neural network based language model,” in Proceedings of Interspeech, (2010), pp. 3. [Google Scholar]
- 37.Liu S., Yang N., Li M., Zhou M., “A Recursive Recurrent Neural Network for Statistical Machine Translation,” in Proceedings of ACL, (2014), pp. 1491–1500. 10.3115/v1/P14-1140 [DOI] [Google Scholar]
- 38.Long J., Shelhamer E., Darrell T., “Fully convolutional networks for semantic segmentation,” in Proceedings of IEEE CVPR, (IEEE, 2015), pp. 3431–3440. [DOI] [PubMed] [Google Scholar]
- 39.Gu B., Sun X., Sheng V., “Structural minimax probability machine,” IEEE Trans. Neural Netw. Learn. Syst. 99, 1–11 (2016). [DOI] [PubMed] [Google Scholar]
- 40.Takeki A., Trinh T., Yoshihashi R., Kawakami R., Iida M., Naemura T., “Combining deep features for object detection at various scales: finding small birds in landscape images,” IPSJ Transactions on Computer Vision and Applications 8(1), 5 (2016). 10.1186/s41074-016-0006-z [DOI] [Google Scholar]
- 41.Yu X., Hong J., Liu C., Cross M., Haynie D. T., Kim M. K., “Four-dimensional motility tracking of biological cells by digital holographic microscopy,” J. Biomed. Opt. 19(4), 045001 (2014). 10.1117/1.JBO.19.4.045001 [DOI] [PMC free article] [PubMed] [Google Scholar]
- 42.He X., Nguyen C. V., Pratap M., Zheng Y., Wang Y., Nisbet D. R., Williams R. J., Rug M., Maier A. G., Lee W. M., “Automated Fourier space region-recognition filtering for off-axis digital holographic microscopy,” Biomed. Opt. Express 7(8), 3111–3123 (2016). 10.1364/BOE.7.003111 [DOI] [PMC free article] [PubMed] [Google Scholar]
- 43.Yu X., Hong J., Liu C., Kim M., “Review of digital holographic microscopy for three-dimensional profiling and tracking,” Opt. Eng. 53(11), 112306 (2014). 10.1117/1.OE.53.11.112306 [DOI] [Google Scholar]
- 44.Merola F., Miccio L., Memmolo P., Paturzo M., Grilli S., Ferraro P., “Simultaneous optical manipulation, 3-D tracking, and imaging of micro-objects by digital holography in microfluidics,” IEEE Photonics J. 4(2), 451–454 (2012). 10.1109/JPHOT.2012.2190980 [DOI] [Google Scholar]
- 45.Moon I., Javidi B., Yi F., Boss D., Marquet P., “Automated statistical quantification of three-dimensional morphology and mean corpuscular hemoglobin of multiple red blood cells,” Opt. Express 20(9), 10295–10309 (2012). 10.1364/OE.20.010295 [DOI] [PubMed] [Google Scholar]
- 46.Tran P., “A Fully Convolutional Neural Network for Cardiac Segmentation in Short-Axis MRI,” Strategic Innovation Group, VA, Tech. Rep. (2016). [Google Scholar]
- 47.Christ P., Elshaer M., Ettlinger F., Tatavarty S., Bickel M., Bilic P., Rempfler M., Armbruster M., Hofmann F., D’Anastasi M., Sommer W., Ahmadi S., Menze B., “Automatic Liver and Lesion Segmentation in CT Using Cascaded Fully Convolutional Neural Networks and 3D Conditional Random Fields,” In Proceedings of MICCAI, (2016), pp. 415–423. 10.1007/978-3-319-46723-8_48 [DOI] [Google Scholar]
- 48.Schmidhuber J., “Deep learning in neural networks: An overview,” Neural Netw. 61, 85–117 (2015). 10.1016/j.neunet.2014.09.003 [DOI] [PubMed] [Google Scholar]
- 49.Wang L., Ouyang W., Wang X., Lu H., “Visual tracking with fully convolutional networks,” in Proceedings of IEEE ICCV, (IEEE, 2015), pp. 3119–3127. [Google Scholar]
- 50.Maggiori E., Tarabalka Y., Charpiat G., Alliez P., “Fully convolutional neural networks for remote sensing image classification,” In Proceedings of IGARSS, (2016), pp. 5071–5074. 10.1109/IGARSS.2016.7730322 [DOI] [Google Scholar]
- 51.Ingle V., Proakis J., Digital Signal Processing using MATLAB (Boston, USA: Cengage Learning, 2016). [Google Scholar]
- 52.K. Simonyan and A. Zisserman, “Very deep convolutional networks for large-scale image recognition,” Visual Geometry Group, Department of Engineering Science, University of Oxford, Tech. Rep. (2014).
- 53.Meuleau N., Dorigo M., “Ant colony optimization and stochastic gradient descent,” Artif. Life 8(2), 103–121 (2002). 10.1162/106454602320184202 [DOI] [PubMed] [Google Scholar]
- 54.Jia Y., Shelhamer E., Donahue J., Karayev S., Long J., Girshick R., Guadarrama S., Darrell T., “Caffe: Convolutional architecture for fast feature embedding,” In Proceedings of ACM Multimedia, (2014), pp. 675–678. 10.1145/2647868.2654889 [DOI] [Google Scholar]
- 55.Yang X., Li H., Zhou X., “Nuclei segmentation using marker-controlled watershed, tracking using mean-shift, and Kalman filter in time-lapse microscopy,” IEEE Trans. Circ. Syst. 53(11), 2405–2414 (2006). 10.1109/TCSI.2006.884469 [DOI] [Google Scholar]
- 56.Anand A., Moon I., Javidi B., “Automated Disease Identification With 3-D Optical Imaging: A Medical Diagnostic Tool,” Proc. IEEE 105(5), 924–946 (2017). 10.1109/JPROC.2016.2636238 [DOI] [Google Scholar]


