Abstract
We propose a novel suite of algorithms for automatically segmenting the airway lumen and mucus in endobronchial optical coherence tomography (OCT) data sets, as well as a novel approach for quantifying the contents of the mucus. Mucus and lumen were segmented using a robust, multi-stage algorithm that requires only minimal input regarding sheath geometry. The algorithm performance was highly accurate in a wide range of airway and noise conditions. Mucus was classified using mean backscattering intensity and grey level co-occurrence matrix (GLCM) statistics. We evaluated our techniques in vivo in asthmatic and non-asthmatic volunteers.
OCIS codes: (170.4500) Optical coherence tomography, (100.6950) Tomographic image processing, (170.1610) Clinical applications, (170.2150) Endoscopic imaging
1. Introduction
Optical Coherence Tomography (OCT) is an interferometric imaging modality that can be thought of as the optical analog to ultrasound [1, 2]. The integration of fiber optics has enabled the development of OCT catheters capable of volumetric imaging of luminal organs such as the heart [3, 4], esophagus [5, 6], and lung [7–9]. Some significant clinical applications for endoscopic OCT have been identified and are seeing increasing usage, such as in percutaneous coronary intervention for the treatment of stenosis [10]. For many potential endoscopic applications, however, work is still underway in establishing diagnostic criteria or in streamlining the technology to facilitate the transition into widespread clinic use.
One important aspect with the potential for improving the clinical viability of the technology is the development of robust automated segmentation and analysis algorithms to speed data analysis and alleviate the burden of image interpretation. Such algorithms are routinely used in clinically established imaging technology such as CT, MRI, and ultrasound [11]. Effort has also been devoted to the development of such algorithms for use in OCT, primarily for retinal layer segmentation [12], though algorithms have also been proposed for use in endoscopic OCT data sets [13–16]. One factor that, to our knowledge, has not been explicitly addressed in previously proposed algorithms, is the impact of the presence of fluid and particulate matter within the lumen on algorithm performance. These factors are also important to consider when measuring the physical dimensions of the system due to their influence on optical path length [17]. This becomes even more relevant if the organ system is diseased, as for example with asthma or chronic obstructive pulmonary disease (COPD) in the lung, where mucus production has been reported to correlate with disease severity [18].
To address these issues, we have developed a suite of algorithms designed to segment both airway lumen and mucus in OCT images. The segmentation of the lumen in the presence of dense mucus is achieved using a novel cost matrix approach. We have validated the algorithm performance against manually traced airway lumens by 2 blinded readers using in vivo human data. In addition to segmentation of the lumen and mucus, we also propose an approach to characterizing the mucus content using gray level co-occurrence matrix (GLCM) analysis. Correlation between GLCM metric data and mucin content obtained from bronchoalveolar lavage (BAL) fluid demonstrates the potential utility of this approach for the assessment of mucus.
2. Materials and methods
2.1 OCT system specifications
The OCT system we used in acquiring all of the data presented in this manuscript has been previously described [2]. Briefly, the system was a swept-source OCT system built in-house with 120 nm bandwidth centered at 1310 nm. The effective axial resolution of the system was approximately 10 µm, and the ranging depth approximately 10 mm. The fiber optic imaging catheter used a monolithic side-viewing ball lens design with a beam spot size of approximately 30 µm at the focal distance (1.5 mm from catheter sheath). Cross-sectional images were acquired at a rate of 33 frames per second, and longitudinal scanning performed at 1 mm per second, resulting in an image-to-image pitch of ~33 µm. The inner diameter of the catheter sheath was 0.82 mm and the outer diameter 1.65 mm.
2.2 Algorithm overview
Initially, raw volumetric OCT data sets were processed and converted to a logarithmic intensity scale using standard processing procedures [19]. All cross-sectional images were processed as 2048x2048 TIFF files in polar coordinates, though the algorithm can easily be adapted to other image resolutions. All image processing was performed in Matlab.
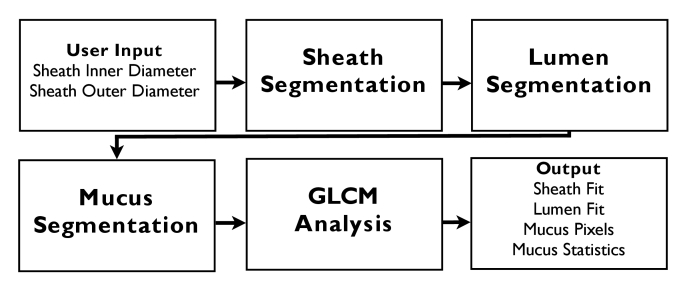
A flow chart outlining the main steps of the algorithm is shown in Fig. 1. The input parameters include the ranging depth of the OCT system, needed to accurately convert images from polar to Cartesian coordinates, and the inner and outer diameters of the catheter sheath. An outline of the algorithm is as follows: first the sheath was identified, then the lumen surface. After these were obtained, the mucus could be accurately identified. The pixels identified as being mucus were then analyzed using both intensity and GLCM second-order statistics. Each step of the algorithm was performed sequentially on individual cross-sectional images, except for the analysis of the mucus, which was performed volumetrically.
Fig. 1.
Flow diagram illustrating the main steps of the segmentation and analysis algorithms.
2.3 Sheath segmentation
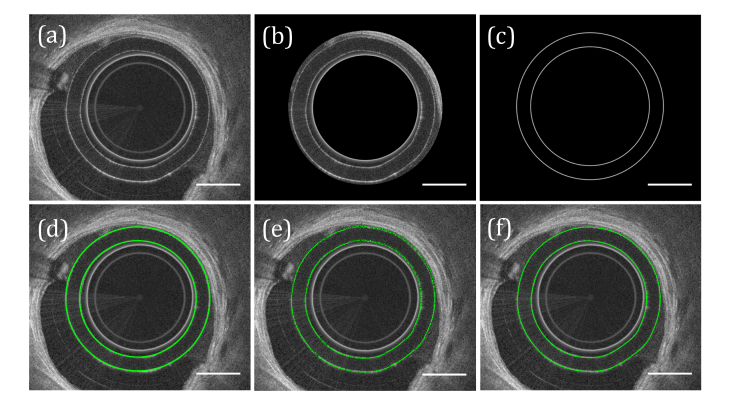
In order to accurately identify the tissue and mucus in the most general case possible, the catheter sheath must first be identified. This was achieved by working with the image in the Cartesian coordinate system, as the polar coordinate system was less suitable for this step given the use of a cross-correlation function and the geometry of the sheath (Fig. 2). Using the sheath dimensions as input we reduced our search window to the region of the frame in which the sheath was contained (Fig. 2(b)), and then generated a simulated sheath signal, represented as a pair of concentric circles of the same diameters as the sheath on a black background. The pixel values of the simulated sheath surfaces were determined by a Gaussian function with a full width at half maximum of 5 pixels and amplitude matched to typical values obtained from the real sheath image (Fig. 2(c)). A two-dimensional cross-correlation of the two images was then performed:
| (1) |
where x,y are the pixel coordinates of the real image I and the complex conjugate of the simulated sheath image. We note that since the image is real-valued the complex conjugate operation does not affect the image. The coordinates of the function maximum were taken as the approximate fit of the sheath (Fig. 2(d)). Since the sheath rarely appears perfectly circular, the location was then fine-tuned by searching for the brightest pixel in a narrow (10 pixel) radius, on a pixel-by-pixel basis (Fig. 2(e)). The resultant fit of the sheath surface was converted to polar coordinates and smoothed along the angular dimension using a one-dimensional mean filter with a 5-pixel window (Fig. 2(f)).
Fig. 2.
Segmentation of catheter sheath. (a) Input image. (b) Approximate location of sheath segmented based on known sheath dimensions. (c) Artificial sheath signal. (d) Position of maximum cross-correlation of artificial sheath signal with segmented image from (b). (e) Sheath fit after minor adjustments made based on image intensity. (f) Final sheath fit, after applying a smoothing filter to (e). In this figure the circularization offset has been artificially increased and the images cropped to make the figure clearer, and the scale bar was determined relative to the outer surface of the sheath. Scale bars, 0.5 mm.
2.4 Lumen segmentation
2.4.1 Pre-processing
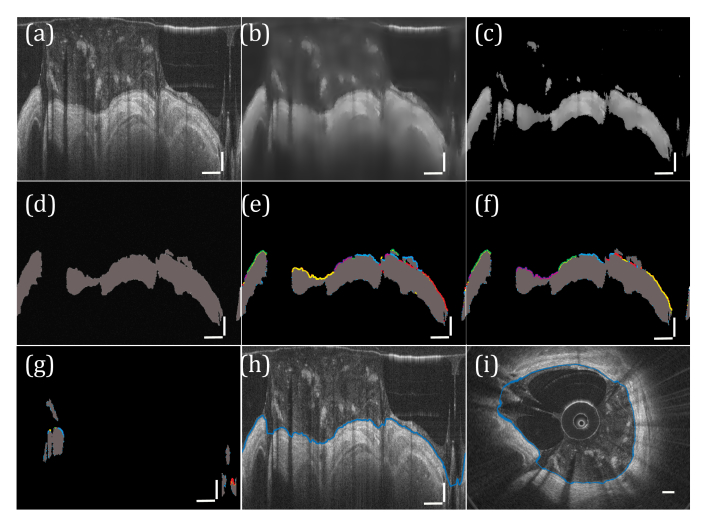
The segmentation of the tissue lumen was performed in polar coordinates (Fig. 3). In the text that follows we adhere to the convention of referring to the angular component of this coordinate system as x and the radial component as y. The first step of the algorithm involved employing an aggressive Wiener Filter [20]. The Wiener Filter is an adaptive filter in which pixel filtering is applied according to the mean and variance of the pixels in a local neighborhood:
| (2) |
where and are the local mean and variance, respectively, and is the global noise variance, estimated from the mean of all local variances. This filter has the advantage of preserving boundaries while reducing noise. In this step of the algorithm a neighborhood of 50x50 pixels was selected in order to generate a rough impression of the tissue surface while mitigating the appearance of mucus (Fig. 3(b)). After removing the sheath from the image, the image was then thresholded based on the global statistics of the image (Fig. 3(c)):
| (3) |
where the unsubscripted mean and variance refer to the global values. A binary image was then obtained and the binary objects, identified as 8-way connected groups of non-zero pixels, were enumerated. In order to begin the segmentation with the binary objects most likely to belong to tissue, objects less than 10,000 pixels in size were eliminated. Likewise, binary holes in the tissue objects that arise from signal void regions such as alveolar spaces were removed so that each object was solid (Fig. 3(d)).
Fig. 3.
Segmentation of airway lumen. (a) Input image. (b) Input image after Wiener Filter is applied. (c) Thresholding and (d) binarization. (e) Surface segments are identified and (f) cost matrix analysis is used to identify the best path. (g) The process is repeated in regions where no lumen surface was found by reapplying a threshold to the filtered image calculated from the mean pixel intensity within the region. The lumen fit is then obtained and represented in (h) polar and (i) Cartesian coordinates. (a-h) vertical scale bars, 0.5 mm; horizontal scale bars, 30°. (i) scale bar, 0.5 mm.
2.4.2 Finding the optimal surface
All of the surface pixels in the binary image were identified by evaluation of the expression:
| (4) |
which identifies all non-zero pixels that are preceded by a pixel with a value of zero. Pixels adjacent in the x-direction and separated by a discontinuity of less than 10 pixels in the y-direction were grouped together into single surface segments (Fig. 3(e)). Each segment was then treated as a vertex in a graph, and the cost associated with the edges joining each vertex was calculated according to the equation:
| (5) |
| (6) |
where , are the horizontal and vertical distances between the end point of the ith segment and the start of the jth segment, mi,j the slope of the line joining the two segments, the number of nonzero pixels in the line joining the two segments, and min(a,b) the smaller value of [a,b]. Using a binary-object approach and pre-segmenting groups of connected pixels to form single vertices differentiates our approach from other graph-theory based approaches [21, 22], and, we believe, improves the overall robustness of the algorithm while simultaneously reducing the computation time. In this approach, it is important that a reliable starting vertex is selected, and for this purpose we selected the longest segment obtained from the largest object in the binary image. Since the image is circular in nature, the end vertex was the same as the starting vertex following 360 degrees of travel. To then solve the minimum cost path, we employed Dijkstra’s algorithm [23] (Fig. 3(f)).
At this point in the algorithm, the regions between objects that were previously segmented out and in which no surface had been defined had to be addressed. We defined regions between pairs of valid surface segments that were bounded in the x-direction by the positions of these segments and in the y-direction by +/− 200 pixels from the vertical (y) midpoint of the segments. The Wiener filtered image (Fig. 3(b)) was then again thresholded in each of these regions based on the mean pixel value in that region, and the thresholded image was again converted to binary. Using the same graph theory-based approach described above, the minimal cost path along these regions were calculated using the two valid segments as the start and end vertices (Fig. 3(g)). The final lumen fit was taken as the combined positions of all valid surface segments, and interpolated where there was no surface found (Fig. 3(h)).
2.5 Mucus segmentation
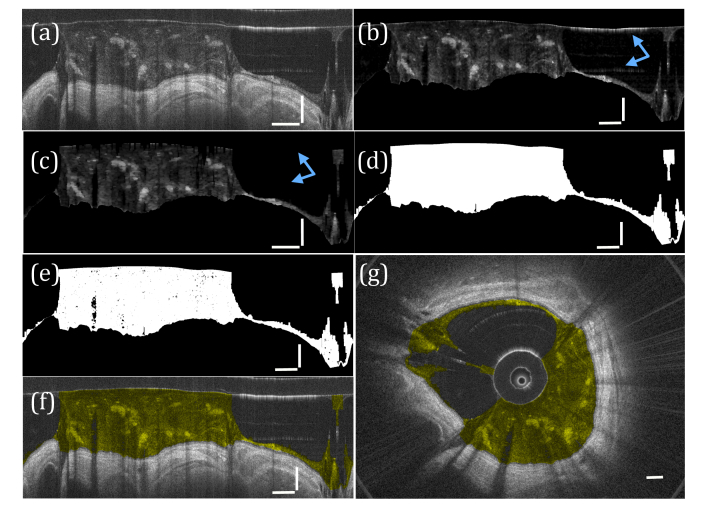
The mucus segmentation process is depicted in Fig. 4. First the regions in the image belonging to the sheath and the tissue were removed. The filtering and thresholding steps for the mucus segmentation involved again applying a Wiener filter with a 10x10 pixel neighborhood, and then thresholding the image based on the mean sheath intensity. This thresholding approach provided a stable means of accounting for variations in the SNR associated with a given data set. (Fig. 4(b)).
Fig. 4.
Segmentation of airway mucus. (a) The input image. (b) The image after filtering and thresholding are performed. (c) Morphological operations are performed to remove artifacts (blue arrows). (d) The resulting binary mask, (e) applied to image (b). The segmented mucus is color coded yellow in (f) polar and (g) Cartesian coordinates. a-f) vertical scale bars, 0.5 mm; horizontal scale bars, 30°. (g) scale bar, 0.5 mm.
To eliminate artifacts arising from detector saturation, morphological opening operations [24] using a horizontal and vertical line structuring element 10 and 45 pixels long, respectively, were employed (Fig. 4(c)). To account for the fact that these operations often eliminated mucus, the sheath and tissue were replaced in the image, and the image was converted to binary and all binary holes closed (Fig. 4(d)). The resultant binary mask was applied to the filtered, thresholded image (Fig. 4(e)). The final results for the segmented mucus were color coded in yellow in polar and Cartesian coordinates (Fig. 4(f), 4(g)).
2.6 Mucus GLCM
The attenuation of signal as light travels through a scattering medium renders the use of signal intensity as a means for characterizing fluid particulate non-ideal. To compensate for this, we employed the use of a gray level co-occurrence matrix. The advantage of the GLCM approach is that by calculating second-order statistics based on pixel pairs in the same neighborhood of an image texture, the effect of local variations in image quality is reduced [25]. These statistics are derived from analysis of the GLCM matrix, the elements of which are a count of the number of times a given pixel value pair occur in the texture being analyzed. The statistics included in our analysis are given by:
| (7) |
| (8) |
| (9) |
| (10) |
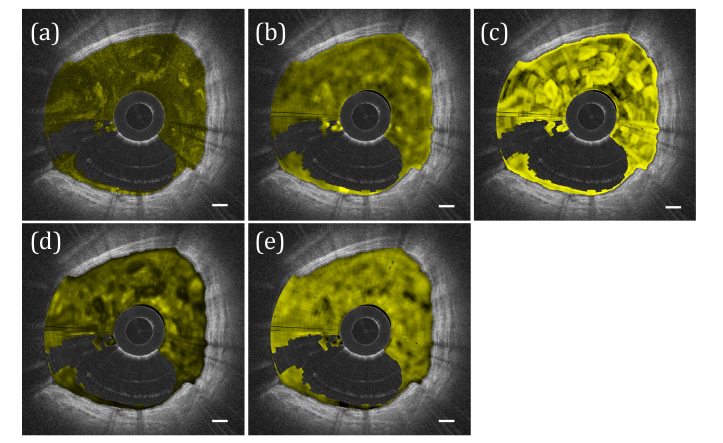
where p(i,j) is the occurrence of pixel value pair (i,j) in the GLCM. In all of our GLCM analyses, the 8-bit mucus pixel value data was divided into 8 gray levels. Examples of the statistics calculated with a 20x20 pixel sliding window applied to segmented mucus are depicted in Fig. 5. Due to the nature of the calculations a degree of similarity exists between them; however, we found that GLCM Contrast correlated best with experimental data (see Results) as well as the visual appearance of dense and heterogeneous mucus fluid particulate, and propose the use of this statistic as a primary indicator of such.
Fig. 5.
Mucus GLCM statistics comparison. (a) Intensity image with mucus color coded in yellow. (b-e) GLCM statistic values using a 20x20 sliding window for (b) Contrast, (c) Correlation, (d) Entropy, and (e) Homogeneity. Scale bars, 0.5 mm.
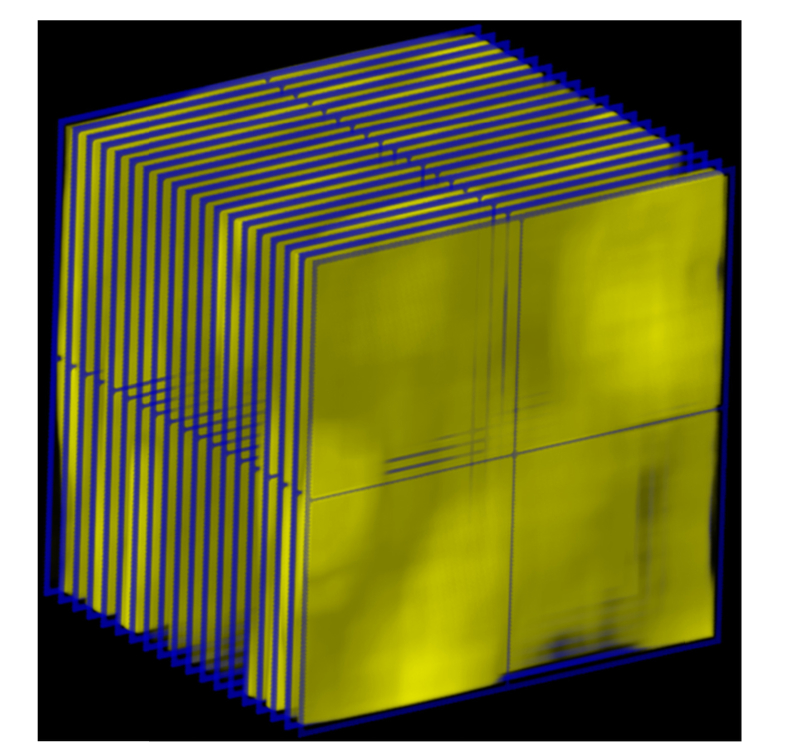
In applying the GLCM approach to our analysis of mucus heterogeneity, the segmented mucus data was analyzed volumetrically (Fig. 6). The region between the sheath and lumen was divided into 3D slices 50x50 pixels in area and 5 frames thick. Slices occupied with less than 50% mucus content were excluded from the analysis. This approach was used in order to ensure that the only data analyzed was actually mucus content, since any false signals arising from detector saturation that were occasionally misidentified as mucus were less consistent across frames. Each slice was filtered using a 6x6x2 mean kernel to eliminate the influence of speckle. GLCM contrast was obtained using pixel pairs from each of the three axes and a pixel separation of 1. The mean GLCM contrast per 3D slice was then averaged from the values obtained from each of the three directions, and each slice was averaged over the entire data set to produce a single value.
Fig. 6.
Representation of how mucus analysis is performed volumetrically. The mucus was divided into 3D slices 50x50 pixels in area and 5 frames thick (Represented by blue wireframe), and a mean filter 6x6x2 in size was used to reduce the effect of speckle. Each 3d slice was then analyzed along each of the 3 orthogonal directions using a GLCM with a pixel separation of 1.
3. Results
3.1 Clinical data analysis
To evaluate our segmentation and mucus classification algorithms in human in vivo data sets, we analyzed data sets that had previously been obtained in a clinical study involving 18 allergic asthmatic and 22 allergic non-asthmatic subjects [26]. The clinical characteristics of the subjects and the details of this study, which involved a titrated allergen challenge, have been described elsewhere [26–29]. By analyzing data sets obtained before and after the delivery of allergen, we were able to assess our image segmentation and mucus characterization both under normal conditions and 24 hours after allergen exposure, which can have a dramatic effect on the airways in terms of mucus production, airway closure, and inflammation and edema.
3.2 Image segmentation
To evaluate how the automated segmentation algorithm compared to manual segmentation, two expert OCT image readers were assigned to perform manual segmentation of a subset of 100 images from the human in vivo study. For the segmentation of mucus, the readers were instructed to segment any regions within the lumen that had the appearance of fluid or tissue matter that was not apparently part of the airway wall. Images were assigned for manual segmentation by randomly selecting 5 asthmatic and 5 non-asthmatic data sets, and taking 10 cross-sectional images from each data set at fixed intervals along the pullback. The readers were instructed to segment both the airway lumen and any mucus that was in the image. Manual segmentation was performed in ImageJ. The results of the manual segmentations from each of the two readers were then averaged for comparison with the segmentation algorithm.
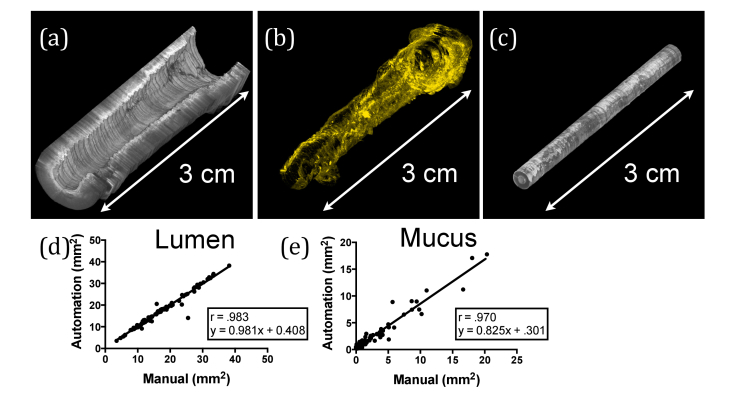
Segmentation results are shown in Fig. 7. Figure 7(a)-7(c) provides a volumetric representation of the three segmented components obtained from a representative data set. Comparative metrics for the automated versus manual segmentation results were derived by performing a linear regression on the data and obtaining Pearson’s correlation coefficient (Fig. 7(d), 7(e)) of segmented areas (mm2). Both lumen and mucus automated segmentation show excellent agreement with manual segmentation (r = 0.983, slope = 0.981, y-intercept = 0.41, for lumen; r = 0.970, slope = 0.825, y-intercept = 0.301, for mucus). The mean standard deviation between the two readers was 0.652 mm2 for lumen and 0.461 mm2 for mucus.
Fig. 7.
Results from manual segmentation. (a-c) Volumetric representations from a representative airway segmented using the automated methods are shown for (a) lumen, (b) mucus, and (c) sheath. (d,e) Comparison between manual and automated segmentation for (d) lumen and (e) mucus.
3.3 Mucus analysis
Assessment of the different metrics calculated using the GLCM approach, as well as the direct metric of mucus pixel value, was accomplished using airway mucin content estimated from analysis of the BAL fluid obtained in the study from which our test data sets were derived. There were 30 mucin data points in total, eight of which came from four asthmatic subjects both before and after allergen challenge, and twenty-two of which came from eleven non-asthmatics before and after allergen challenge.
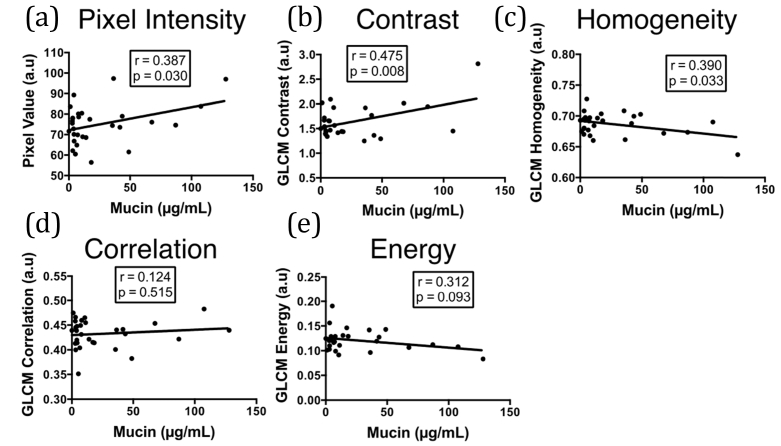
The correlations of the OCT mucus metrics with mucin content are depicted in Fig. 8. The metrics that were correlated with mucin were GLCM Contrast (p = 0.008, r = 0.473), mean mucus pixel value (p = 0.03, r = 0.387), and GLCM Homogeneity (p = 0.03, r = 0.390). The similarity between Contrast and Homogeneity is evident on inspection of Eqs. (7) and (10), with Contrast appearing to offer slightly better overall results in this application. GLCM Energy and GLCM Correlation were not found to correlate with mucin content in the data we analyzed.
Fig. 8.
Comparison of various OCT mucus assessment approaches with mucin content obtained from BAL. (a) Mean pixel intensity. (b-e) GLCM statistics corresponding to (b) Contrast, (c) Homogeneity, (d) Correlation, and (e) Energy. Mean pixel intensity, GLCM Contrast, and GLCM Homogeneity were found to be correlated with mucin, with GLCM Contrast presenting the best correlation.
4. Discussion
The endoscopic OCT segmentation algorithms we have developed were specifically designed to be effective in conditions of both excessive fluid and particulate matter and common imaging artifacts present in endoscopic OCT images. By identifying mucus separately from the lumen, we also enable the potential for correcting for the increase in optical path length as light travels through mucus versus air, which can otherwise give rise to an overestimation of lumen dimensions. Using OCT data sets obtained in vivo from the airways of asthmatic and non-asthmatic subjects, we tested the algorithms in the presence of a wide range of mucus conditions in the airway, and found that the algorithms produced excellent agreement with the results of manual segmentation produced by two expert OCT readers.
A few outliers may be noted in the plot comparing the manual segmentation of the lumen to the automatic segmentation. We observed that these outliers occurred at branch points in the airway, where the separation between the airway being segmented and the adjoining airway was ambiguous. We additionally observed that the correlation for the lumen segmentation was higher than the correlation for the mucus segmentation. The underestimation of mucus by the segmentation algorithm compared to that of manual segmentation is likely due in part to the fact that in cases where the mucus was most thin and watery, both inner and outer boundaries for the mucus became ill defined. Adding to this, denser components within the mucus occasionally caused shadowing effects that made it difficult to discern features beyond. As a result, mucus segmentation was overall more subjective.
The primary limitation of these algorithms is that in current implementation the speed of the algorithms is prohibitive for real-time use. Elapsed-time measurements resulted in an average processing time per frame of 8.4 seconds for the lumen segmentation, and 3.1 seconds for the mucus segmentation, with benchmark data obtained on a personal computer running Windows 7, using an Intel Xeon quad-core CPU clocked at 3.7 GHz and 64 GB of DDR4 RAM. Algorithms were implemented in Matlab R2015a (Mathworks, Natick, MA). The primary bottleneck in the segmentation algorithms was the minimum cost path search for finding the optimal lumen surface. It is conceivable that a combination of code optimization and faster hardware could allow the algorithms to be used for real-time segmentation and intra-procedural analysis of clinical data.
Previously [26], as in this work, we reported on the correlation between mucus pixel intensity in OCT and mucin content, and found them to be reasonably well correlated (p = 0.03 for the 30 subjects included in this analysis). Although pixel intensity has been used to characterize fluid particulate in other OCT applications [30], it is nevertheless not ideal in analyzing mucus due to the fact that dense and heterogeneous distributions of mucus can cause strong scattering effects that can impact the accuracy of the measurements. To compensate for this, we calculate a second-order statistic based on the occurrences of relationships between local pixel pairs using GLCM Contrast. This estimation of the local gray-level variation between pixels reduces the effect of global intensity variations.
Since GLCM Contrast increases with increasing difference between adjacent pixel values, we believe it is better suited to be a measure of mucus content than mean pixel value, as dense mucus content is manifested in OCT images as alternating regions of high pixel values and low pixel values (see Fig. 5). The choice of this metric for assessing mucus content is then reasonable based on the visual assessment of dense mucus distributions in OCT images. In addition to this, we found that among the metrics we investigated, GLCM Contrast was best correlated with mucin data. Mucin is the gel-forming component of airway mucus, and increased mucin production, such as in inflamed or diseased airways, can result in an increase in the concentration of solids in mucus [18]. We do however note that more data is required to assess the accuracy of mucin content as derived from BAL fluid, as there are factors that may impact this accuracy, such as whether mucus density affects retrieval. Issues such as this may also have affected how well what was imaged corresponded to what was collected by the BAL. Lastly, in addition to investigating mucus changes in asthma, this technique may also be of value in other applications, such as in COPD or in quantifying the effectiveness of medications with putative mucolytic properties [31, 32].
5. Conclusion
In conclusion, we have introduced a suite of algorithms designed to automatically segment the lumen and mucus, as well as characterize mucus content, in the lung in OCT images. We have validated the automatic segmentation algorithm by comparing results against manually segmented images from data obtained in vivo, as well as demonstrating that our approach to mucus assessment is correlated with mucin content. We believe that although more data is needed to determine how well GLCM Contrast measures mucin, it offers a promising alternative to a mean-pixel value approach. For the segmentation algorithms we have proposed, given the large number and the wide range of patient data we used for testing, and the success of these algorithms in handling this data, we believe they are ready for immediate implementation in future in vivo studies.
Disclosures
The authors declare that there are no conflicts of interest related to this article.
Acknowledgments
The authors would like to thank Dr. R. Scott Harris, Dr. Jason W. Griffith, Carol Leary, and Lloyd Liang for their participation in the clinical study.
Funding
National Institutes of Health (NIH) (R01CA167827, R01HL133664, U19AI095261, R37AI040618).
References and links
- 1.Huang D., Swanson E. A., Lin C. P., Schuman J. S., Stinson W. G., Chang W., Hee M. R., Flotte T., Gregory K., Puliafito C. A., et, “Optical coherence tomography,” Science 254(5035), 1178–1181 (1991). 10.1126/science.1957169 [DOI] [PMC free article] [PubMed] [Google Scholar]
- 2.Yun S. H., Tearney G. J., Vakoc B. J., Shishkov M., Oh W. Y., Desjardins A. E., Suter M. J., Chan R. C., Evans J. A., Jang I. K., Nishioka N. S., de Boer J. F., Bouma B. E., “Comprehensive volumetric optical microscopy in vivo,” Nat. Med. 12(12), 1429–1433 (2007). 10.1038/nm1450 [DOI] [PMC free article] [PubMed] [Google Scholar]
- 3.Fujimoto J. G., Boppart S. A., Tearney G. J., Bouma B. E., Pitris C., Brezinski M. E., “High resolution in vivo intra-arterial imaging with optical coherence tomography,” Heart 82(2), 128–133 (1999). 10.1136/hrt.82.2.128 [DOI] [PMC free article] [PubMed] [Google Scholar]
- 4.Jang I. K., Bouma B. E., Kang D. H., Park S. J., Park S. W., Seung K. B., Choi K. B., Shishkov M., Schlendorf K., Pomerantsev E., Houser S. L., Aretz H. T., Tearney G. J., “Visualization of coronary atherosclerotic plaques in patients using optical coherence tomography: comparison with intravascular ultrasound,” J. Am. Coll. Cardiol. 39(4), 604–609 (2002). 10.1016/S0735-1097(01)01799-5 [DOI] [PubMed] [Google Scholar]
- 5.Vakoc B. J., Shishko M., Yun S. H., Oh W. Y., Suter M. J., Desjardins A. E., Evans J. A., Nishioka N. S., Tearney G. J., Bouma B. E., “Comprehensive esophageal microscopy by using optical frequency-domain imaging (with video),” Gastrointest. Endosc. 65(6), 898–905 (2007). 10.1016/j.gie.2006.08.009 [DOI] [PMC free article] [PubMed] [Google Scholar]
- 6.Suter M. J., Vakoc B. J., Yachimski P. S., Shishkov M., Lauwers G. Y., Mino-Kenudson M., Bouma B. E., Nishioka N. S., Tearney G. J., “Comprehensive microscopy of the esophagus in human patients with optical frequency domain imaging,” Gastrointest. Endosc. 68(4), 745–753 (2008). 10.1016/j.gie.2008.05.014 [DOI] [PMC free article] [PubMed] [Google Scholar]
- 7.Lam S., Standish B., Baldwin C., McWilliams A., leRiche J., Gazdar A., Vitkin A. I., Yang V., Ikeda N., MacAulay C., “In vivo optical coherence tomography imaging of preinvasive bronchial lesions,” Clin. Cancer Res. 14(7), 2006–2011 (2008). 10.1158/1078-0432.CCR-07-4418 [DOI] [PMC free article] [PubMed] [Google Scholar]
- 8.Williamson J. P., McLaughlin R. A., Noffsinger W. J., James A. L., Baker V. A., Curatolo A., Armstrong J. J., Regli A., Shepherd K. L., Marks G. B., Sampson D. D., Hillman D. R., Eastwood P. R., “Elastic properties of the central airways in obstructive lung diseases measured using anatomical optical coherence tomography,” Am. J. Respir. Crit. Care Med. 183(5), 612–619 (2011). 10.1164/rccm.201002-0178OC [DOI] [PubMed] [Google Scholar]
- 9.Adams D. C., Hariri L. P., Miller A. J., Wang Y., Cho J. L., Villiger M., Holz J. A., Szabari M. V., Hamilos D. L., Scott Harris R., Griffith J. W., Bouma B. E., Luster A. D., Medoff B. D., Suter M. J., “Birefringence microscopy platform for assessing airway smooth muscle structure and function in vivo,” Sci. Transl. Med. 8(359), 359ra131 (2016). 10.1126/scitranslmed.aag1424 [DOI] [PMC free article] [PubMed] [Google Scholar]
- 10.Prati F., Di Vito L., Biondi-Zoccai G., Occhipinti M., La Manna A., Tamburino C., Burzotta F., Trani C., Porto I., Ramazzotti V., Imola F., Manzoli A., Materia L., Cremonesi A., Albertucci M., “Angiography alone versus angiography plus optical coherence tomography to guide decision-making during percutaneous coronary intervention: the Centro per la Lotta contro l’Infarto-Optimisation of Percutaneous Coronary Intervention (CLI-OPCI) study,” EuroIntervention 8(7), 823–829 (2012). 10.4244/EIJV8I7A125 [DOI] [PubMed] [Google Scholar]
- 11. Jasjit S. S., Setarehdan S. K., Sameer S., eds., Advanced algorithmic approaches to medical image segmentation: state-of-the-art application in cardiology, neurology, mammography and pathology (Springer-Verlag New York, Inc., 2002), p. 668. [Google Scholar]
- 12.Kafieh R., Rabbani H., Kermani S., “A review of algorithms for segmentation of optical coherence tomography from retina,” J. Med. Signals Sens. 3(1), 45–60 (2013). [PMC free article] [PubMed] [Google Scholar]
- 13.Ughi G. J., Gora M. J., Swager A. F., Soomro A., Grant C., Tiernan A., Rosenberg M., Sauk J. S., Nishioka N. S., Tearney G. J., “Automated segmentation and characterization of esophageal wall in vivo by tethered capsule optical coherence tomography endomicroscopy,” Biomed. Opt. Express 7(2), 409–419 (2016). 10.1364/BOE.7.000409 [DOI] [PMC free article] [PubMed] [Google Scholar]
- 14.Qi L., Huang S., Heidari A. E., Dai C., Zhu J., Zhang X., Chen Z., “Automatic airway wall segmentation and thickness measurement for long-range optical coherence tomography images,” Opt. Express 23(26), 33992–34006 (2015). 10.1364/OE.23.033992 [DOI] [PMC free article] [PubMed] [Google Scholar]
- 15.Pagnozzi A. M., Kirk R. W., Kennedy B. F., Sampson D. D., McLaughlin R. A., “Automated quantification of lung structures from optical coherence tomography images,” Biomed. Opt. Express 4(11), 2383–2395 (2013). 10.1364/BOE.4.002383 [DOI] [PMC free article] [PubMed] [Google Scholar]
- 16.Chatzizisis Y. S., Koutkias V. G., Toutouzas K., Giannopoulos A., Chouvarda I., Riga M., Antoniadis A. P., Cheimariotis G., Doulaverakis C., Tsampoulatidis I., Bouki K., Kompatsiaris I., Stefanadis C., Maglaveras N., Giannoglou G. D., “Clinical validation of an algorithm for rapid and accurate automated segmentation of intracoronary optical coherence tomography images,” Int. J. Cardiol. 172(3), 568–580 (2014). 10.1016/j.ijcard.2014.01.071 [DOI] [PubMed] [Google Scholar]
- 17.Suter M. J., Kashiwagi M., Gallagher K. A., Nadkarni S. K., Asanani N., Tanaka A., Conditt G. B., Tellez A., Milewski K., Kaluza G. L., Granada J. F., Bouma B. E., Tearney G. J., “Optimizing flushing parameters in intracoronary optical coherence tomography: an in vivo swine study,” Int. J. Cardiovasc. Imaging 31(6), 1097–1106 (2015). 10.1007/s10554-015-0668-0 [DOI] [PMC free article] [PubMed] [Google Scholar]
- 18.Fahy J. V., Dickey B. F., “Airway mucus function and dysfunction,” N. Engl. J. Med. 363(23), 2233–2247 (2010). 10.1056/NEJMra0910061 [DOI] [PMC free article] [PubMed] [Google Scholar]
- 19.Park B., Pierce M., Cense B., de Boer J., “Real-time multi-functional optical coherence tomography,” Opt. Express 11(7), 782–793 (2003). 10.1364/OE.11.000782 [DOI] [PubMed] [Google Scholar]
- 20. Lim J. S., Two-Dimensional Signal and Image Processing (Prentice Hall, 1990), p. 548. [Google Scholar]
- 21.Yang Q., Reisman C. A., Chan K., Ramachandran R., Raza A., Hood D. C., “Automated segmentation of outer retinal layers in macular OCT images of patients with retinitis pigmentosa,” Biomed. Opt. Express 2(9), 2493–2503 (2011). 10.1364/BOE.2.002493 [DOI] [PMC free article] [PubMed] [Google Scholar]
- 22.Chiu S. J., Allingham M. J., Mettu P. S., Cousins S. W., Izatt J. A., Farsiu S., “Kernel regression based segmentation of optical coherence tomography images with diabetic macular edema,” Biomed. Opt. Express 6(4), 1172–1194 (2015). 10.1364/BOE.6.001172 [DOI] [PMC free article] [PubMed] [Google Scholar]
- 23.Dijkstra E. W., “A note on two problems in connexion with graphs,” Numer. Math. 1(1), 269–271 (1959). 10.1007/BF01386390 [DOI] [Google Scholar]
- 24. Haralick R. M., Shapiro L. G., Computer and Robot Vision, Vol. 1 (Addison-Wesley, 1992), pp. 158–205. [Google Scholar]
- 25.Honeycutt C. E., Plotnick R., “Image analysis techniques and gray-level co-occurrence matrices (GLCM) for calculating bioturbation indices and characterizing biogenic sedimentary structures,” Comput. Geosci. 34(11), 1461–1472 (2008). 10.1016/j.cageo.2008.01.006 [DOI] [Google Scholar]
- 26.Cho J. L., Ling M. F., Adams D. C., Faustino L., Islam S. A., Afshar R., Griffith J. W., Harris R. S., Ng A., Radicioni G., Ford A. A., Han A. K., Xavier R., Kwok W. W., Boucher R., Moon J. J., Hamilos D. L., Kesimer M., Suter M. J., Medoff B. D., Luster A. D., “Allergic asthma is distinguished by sensitivity of allergen-specific CD4+ T cells and airway structural cells to type 2 inflammation,” Sci. Transl. Med. 8(359), 359ra132 (2016). 10.1126/scitranslmed.aag1370 [DOI] [PMC free article] [PubMed] [Google Scholar]
- 27.Afshar R., Strassner J. P., Seung E., Causton B., Cho J. L., Harris R. S., Hamilos D. L., Medoff B. D., Luster A. D., “Compartmentalized chemokine-dependent regulatory T-cell inhibition of allergic pulmonary inflammation,” J. Allergy Clin. Immunol. 131(6), 1644–1652 (2013). 10.1016/j.jaci.2013.03.002 [DOI] [PMC free article] [PubMed] [Google Scholar]
- 28.Thomas S. Y., Banerji A., Medoff B. D., Lilly C. M., Luster A. D., “Multiple chemokine receptors, including CCR6 and CXCR3, regulate antigen-induced T cell homing to the human asthmatic airway,” J. Immunol. 179(3), 1901–1912 (2007). 10.4049/jimmunol.179.3.1901 [DOI] [PubMed] [Google Scholar]
- 29.Thomas S. Y., Lilly C. M., Luster A. D., “Invariant natural killer T cells in bronchial asthma,” N. Engl. J. Med. 354(24), 2613–2616 (2006). 10.1056/NEJMc066189 [DOI] [PubMed] [Google Scholar]
- 30.Keane P. A., Karampelas M., Sim D. A., Sadda S. R., Tufail A., Sen H. N., Nussenblatt R. B., Dick A. D., Lee R. W., Murray P. I., Pavesio C. E., Denniston A. K., “Objective measurement of vitreous inflammation using optical coherence tomography,” Ophthalmology 121(9), 1706–1714 (2014). 10.1016/j.ophtha.2014.03.006 [DOI] [PMC free article] [PubMed] [Google Scholar]
- 31.Bagnasco D., Ferrando M., Varricchi G., Passalacqua G., Canonica G. W., “A Critical Evaluation of Anti-IL-13 and Anti-IL-4 Strategies in Severe Asthma,” Int. Arch. Allergy Immunol. 170(2), 122–131 (2016). 10.1159/000447692 [DOI] [PubMed] [Google Scholar]
- 32.Durham A. L., Caramori G., Chung K. F., Adcock I. M., “Targeted anti-inflammatory therapeutics in asthma and chronic obstructive lung disease,” Transl. Res. 167(1), 192–203 (2016). 10.1016/j.trsl.2015.08.004 [DOI] [PMC free article] [PubMed] [Google Scholar]


