

Abstract
Many of the extracellular proteins or extracellular domains of plasma membrane proteins exist or function as homo‐ or heteromeric multimer protein complexes. Successful recombinant production of such proteins is often achieved by co‐expression of the components using eukaryotic cells via the secretory pathway. Here we report a strategy addressing large‐scale expression of hetero‐multimeric extracellular domains of plasma membrane proteins and its application to the extracellular domains of a taste receptor. The target receptor consists of a heterodimer of T1r2 and T1r3 proteins, and their extracellular ligand binding domains (LBDs) are responsible for the perception of major taste substances. However, despite the functional importance, recombinant production of the heterodimeric proteins has so far been unsuccessful. We achieved the successful preparation of the heterodimeric LBD by use of Drosophila S2 cells, which have a high secretory capacity, and by the establishment of a stable high‐expression clone producing both subunits at a comparable level. The method overcame the problems encountered in the conventional transient expression of the receptor protein in insect cells using baculovirus or vector lipofection, which failed in the proper heterodimer production because of the biased expression of T1r3LBD over T1r2LBD. The large‐scale expression methodology reported here may serve as one of the considerable strategies for the preparation of multimeric extracellular protein complexes.
Keywords: Drosophila S2 cells, secretory expression, co‐expression, protein complex, taste receptor
Introduction
Extracellular proteins or extracellular domains of plasma membrane proteins play significant roles in various physiological functions, and thus are important research targets for life science studies. These proteins include extracellular matrix proteins, proteins or their extracellular domains for cell adhesion, and extracellular ligand binding domains (LBDs) of metabotropic and ionotropic receptors.1, 2, 3 In order to advance their biochemical, biophysical, and structural analyses, large‐scale recombinant expression of the target proteins is essential. Under the physiological conditions in living bodies, these proteins acquire their functional structures with proper folding and post‐translational modifications via the secretory pathway.4, 5, 6 Therefore, their recombinant expression is also often achieved by secreted expression using eukaryotic host cells, such as insect cell lines sf9, High Five, and S2; yeasts such as P. pastoris and S. cerevisiae; and mammalian cell lines such as HEK293 and CHO. This is because they are also equipped with machinery for secreted expression similar to their native hosts, such as organelles as endoplasmic reticulum and Golgi, and systems for post‐translational modifications, membrane trafficking, and quality control of the products within.7, 8, 9
Notably, many extracellular proteins or extracellular domains of plasma membrane proteins are known to exist and/or function as homo‐ or heteromeric multimer protein complexes.10, 11 Indeed, a number of multimeric structures of such proteins have been solved crystallographically.12, 13, 14, 15, 16, 17 In these cases, co‐expression of the component proteins is often required for the successful recombinant production of the protein complex. This is especially the case when the component proteins constitutively exist as a complex, because each component is sometimes unstable if it exists alone. Co‐expression is usually achieved by the transfection of multiple expression vectors or viruses for individual components simultaneously, or a single vector or virus containing multiple genes of the components.18, 19, 20, 21, 22 However, co‐expression could result in incomplete complex formation if the expression of all components at an equal level is not achieved.
Here we report a strategy addressing the large‐scale expression of multimeric extracellular domains of plasma membrane proteins, and its application to the heterodimeric extracellular domains of a taste receptor. For taste perception, heterodimers of T1r proteins, T1r1/T1r3 and T1r2/T1r3, serve as umami and sweet taste receptors, respectively.23, 24, 25, 26 T1r proteins are class C G protein‐coupled receptors, and major taste substances, such as monosodium glutamate and sugars, are recognized at their LBDs with ∼500 amino acid residues located at the extracellular side.27, 28 In order to address the mechanisms of taste recognition and subsequent signal transduction, biochemical, biophysical, and structural analyses of heterodimeric T1r LBDs are crucial. However, such analyses have been hampered by unsuccessful large‐scale recombinant protein preparation, although there were a couple of studies reporting preparation of a LBD from a single subunit.29, 30 Recently, we achieved a large‐scale expression of fish T1r2LBD/T1r3LBD in a heterodimeric state,31 and succeeded in its crystallization and structure determination.32 In this article, we report a detailed method finally resulted in the successful preparation of the T1rLBD heterodimer for the first time, using an expression system for Drosophila S2 cells and the establishment of a stable cell clone exhibiting the high expression of both subunits.
Results
Method overview
The pivotal point of our established method for a large‐scale expression of multimeric extracellular protein complex is the construction of a stable high‐expression clone using Drosophila S2 cells. The experimental scheme of the method is summarized in Figure 1(A), and the detailed protocol is described in the “Materials and Methods” section.
Figure 1.

Overview of the large‐scale expression method of a multimeric extracellular protein complex, described in this study. (A) The experimental scheme and a possible approximate schedule for the construction of a stable high‐expression S2 cell clone. (B) A typical example of a soft‐agar plate of S2 cells after incubation for two weeks.
Firstly, the expression plasmids for the components proteins of the complex are transfected together with an antibiotic‐resistant marker to Drosophila S2 cells, and established a stable cell line expressing all components. We employed S2 cells here because of their high efficiency for secretory expression.33 in contrast to another conventional insect cell expression system, baculovirus, which shows typically low expression levels of secretory pathway proteins.34 Although the conventional protocol for the construction of the stable S2 cells, that is the one provided by a manufacturer, results in a pool of recombinant cell populations,33 we further clone cells in a stable‐expression cell pool. The cell cloning process is critical in achieving the best expression result for the following reasons: (1) enables selection of the high‐expression clones among the cell pools exhibiting various expression levels, (2) enables selection of the clones showing the expression of the all components at a similar level, (3) avoids alteration in the cell population during the cell culture, as we encountered in the case for the taste receptor expression as described below, (4) gives reproducible results for protein production. Since S2 cells cannot stand culture at a low cell density,33, 35, 36 the cloning was performed in soft agar in the presence of a conditioned medium37 [Fig. 1(B)]. We ourselves experienced that no favorable cell growth or colony formation was achieved for cloning by limiting dilution or soft agar in the absence of a conditioned medium. The cloning process should be employed at an early stage of antibiotic resistant selection and carried out simultaneously, that is by use of soft agar plate containing the appropriate antibiotics, because it is apprehended that the cell pool contains more low‐expression cells at the latter stage of the culture, as described below. In our case, about 3–10 colonies per 1 mL culture volume appeared in the presence of 25–50% conditioned medium and antibiotics at the cell density of 0.5 × 10⁴ cells/mL.
Next, high‐expression clones are selected among the stable cells, taking into account the expression levels of each component. The expression level was typically analyzed by Western blotting by use of the antibody against a purification tag sequence, such as the His‐tag and FLAG‐tag, attached to each subunit.
Then, the expression of the selected clones is confirmed after a further couple of passages, and finally the best clone is selected. At this stage, it should be checked whether the characteristics of clones, such as protein expression levels, are stable and reproducible even when the passage increased. Especially, we focus on the expression level of each component, and preferentially select a clone showing the expression of the components at a similar level. The selected clone is then adapted to a serum‐free medium and proceeded to large‐scale protein production.
Previous problems for the recombinant expression of a heterodimeric taste receptor extracellular domains
Before applying the above method, the recombinant expression of a heterodimeric T1r taste receptor extracellular domains had been hampered by multiple problems. We first describe our previous attempts and their results of the expression of heterodimeric T1rLBDs.
We previously found that T1r2aLBD and T1r3LBD from medaka fish displayed favorable secreted expression and stable heterodimerization,31 although those from other sources, including mouse and human, displayed failure of folding and localization during the recombinant expression.38 To address the large‐scale preparation of the heterodimeric T1rLBD, we first attempted baculovirus expression,34 the most commonly used eukaryotic expression system for structural studies. The coding sequences for T1r2aLBD and T1r3LBD were inserted under two promoters in a single transfer vector; the polyhedrin and p10 promoters, respectively, and the generated recombinant baculovirus was used for transfection and protein expression by sf9 or High Five cells. However, an SDS‐PAGE analysis of the product protein, after the affinity chromatography using the purification tag, showed that the electrophoretic band corresponding to T1r3LBD was more intense than that of T1r2aLBD [Fig. 2(A), inset]. The result indicated that the transfected cells exhibited a biased expression of T1r3LBD, as compared to T1r2aLBD, although the protein production was administrated by a single baculovirus containing the both genes. In addition, the elution profile of the following size‐exclusion chromatography (SEC) showed three major peaks [Fig. 2(A)]. Peaks 2 and 3 were presumed as T1rLBD dimer and monomer, because the molecular weight estimated by the SEC elution volume of each peak was ∼130 and ∼65 kDa, while those calculated from the amino acid sequences are 109 and 54–55 kDa, respectively. On the other hand, peak 1 was eluted at the void volume and supposed to be aggregated protein.
Figure 2.
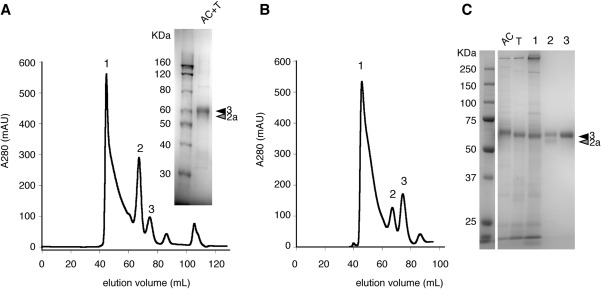
Expression and purification of T1r2aLBD/T1r3LBD heterodimer using conventional transient insect cell expression systems. (A) The SEC profile of the final purification stage of T1r2aLBD/T1r3LBD produced by baculovirus expression. Inset is a typical SDS‐PAGE result after the first affinity chromatography and tag‐cleavage step. (B) The SEC profile of the final purification stage of T1r2aLBD/T1r3LBD produced by transient expression using S2 cells. (C) SDS‐PAGE of the fractions from SEC shown in panel B. AC: after the first affinity chromatography step; T: the following tag‐cleavage step; 1, 2, 3: the peak top fractions for those shown in panel B.
We also tested transient expression using another common insect cell line for protein expression, Drosophila S2 cell. As expected from their high secretory capacity, S2 cells resulted in higher secretory expression compared to baculovirus expression (Table 1). However, the similar tendency was observed on the co‐expression of T1r2aLBD and T1r3LBD by baculovirus: the transfected cells exhibited a biased expression of T1r3LBD compared to T1r2aLBD, even though the same amount of the two vectors, in which the coding sequence of each single subunit was inserted under the same metallothionein promoter,39 were used for transfection [Fig. 2(C)]. These results suggested that T1r2aLBD intrinsically possesses a low ability for expression compared to T1r3LBD. The SEC elution profile of the transient co‐expression product using S2 cells also showed a similar pattern to that of the baculovirus product [Fig. 2(B)]. The SDS‐PAGE analysis of the fractions from SEC showed that peak 2 consisted of two bands corresponding to T1r2aLBD and T1r3LBD [Fig. 2(C)]. Taking into account the estimated molecular weight of peak 2 as described above, peak 2 was considered as a T1r2aLBD/T1r3LBD heterodimer. On the other hand, peak 3 contained only T1r3LBD and thus was presumed as a T1r3LBD monomer. Notably, peak 1 also indicated the exclusive presence of T1r3LBD. These results indicated that the presence of peak 1 and peak 3 was attributed to the residual T1r3LBD produced by the biased expression, causing heterogeneity in the purified protein sample unfavorable for structural and other accurate analyses. The results also suggested that a single subunit of T1rLBD, such as the residual T1r3LBD without partnering with T1r2aLBD, is more unstable than the heterodimer and prone to make aggregation.
Table 1.
The yield of T1r2aLBD/T1r3LBD heterodimer from expression systems used in this study
| Cell | Condition | mg protein/L culturea |
|---|---|---|
| High five | Baculovilus, 27°C, 24 h |
0.422 (± 0.128; n = 3) |
| S2 | Metallothionein promoter, transient, 27°C, 120 h |
6.14 (3.30, 8.97; n = 2) |
| S2 | β‐actin promoter, transient, 27°C, 120 h, high Ca2+ addition |
0.915 (± 0.234, n = 6) |
| S2 | β‐actin promoter, stable cell pool, P7, 27°C, 120 h, high Ca2+ addition |
0.0878 (n = 1) |
| S2 | β‐actin promoter, high‐expression stable clone, P14 or P26, 27°C, 120 h, high Ca2+ addition |
0.939 (1.11, 0.767; n = 2) |
The yield after the affinity chromatography was shown. The values are mean of the results from the multiple repeated experiments shown as n. In parentheses, ±SEMs in the case of n ≧ 3 or all results in the case of n = 2 are also shown.
We further tried to establish a stable cell line expressing T1r2aLBD and T1r3LBD, using S2 cells. At this stage, we changed the protein expression promoter with the β‐actin promoter40 from the metallothionein promoter to improve the purification as described in the next section. However, the cells again exhibited a biased production of T1r3LBD compared to T1r2LBD (Suppporting Information Fig. S1). Furthermore, the expression level was quite low as ∼1/10 of that from the transient expression after the expansion of the cells for large‐scale preparation (Table 1). We found that the expression level was decreased as the passage increased after the establishment of the stable cell pool (Suppporting Information Fig. S1), indicating the alteration of the cell population of the stable cell pool during the culture. The results suggested that the obtained cell pool was a group of heterogeneous cells in terms of expression levels of T1rLBD, and the cells with higher T1r expression levels showed slower cell growth, resulting in more populations of low expression cells at the latter stage of the culture.
Application of the stable high‐expression cell cloning strategy to the recombinant expression of heterodimeric taste receptor extracellular domains
In order to overcome the problems for T1rLBD expression, we employed the stable high‐expression cell cloning strategy described above.
We transfected the S2 cells with the expression plasmids for T1r2aLBD and T1r3LBD, together with an antibiotic‐resistant marker for Blasticidin‐S, and subjected them to the soft‐agar plate cloning in the presence of Blasticidin‐S. Then, we selected high‐expression clones among stable cells, judged by Western blotting against the FLAG‐tag attached to the both T1r subunits. The results indicated that the expression levels of the clones were quite varied [Fig. 3(A,B)]. Notably, major species of the stable cells were low‐expression clones, such that ∼70% of the clones displayed ∼1/10 or less signals of those for the top 5% high‐expression clones. These observations are consistent with the previous presumption that a stable cell pool is heterogeneous in terms of protein expression, and contains low‐expression clones. We selected one or two clones showing the highest levels of expression among those tested on each blot. For example, from the blot shown in Figure 3(A), the clones #1–1B and 1–1G were chosen. Consequently, among 144 clones tested in total, we selected 10 clones at the first selection stage. Then we confirmed the expression of these selected clones after a further couple of passages and performed the second selection [Fig. 3(C,D)]. To overcome a biased expression of heterodimer components, we especially took into account the expression level of both T1r2aLBD and T1r3LBD, and selected a clone showing the expression of the two components as close as possible. The Western‐blotting result indicated that most clones showed a higher expression of T1r3LBD, as compared to T1r2aLBD, and the expression balances of the two subunits were quite varied [Fig. 3(C,D)]. Among the tested clones, we selected clone #1–11H as the final one, in terms of the amount of protein expression as well as the closest balance of the production of the two subunits.
Figure 3.
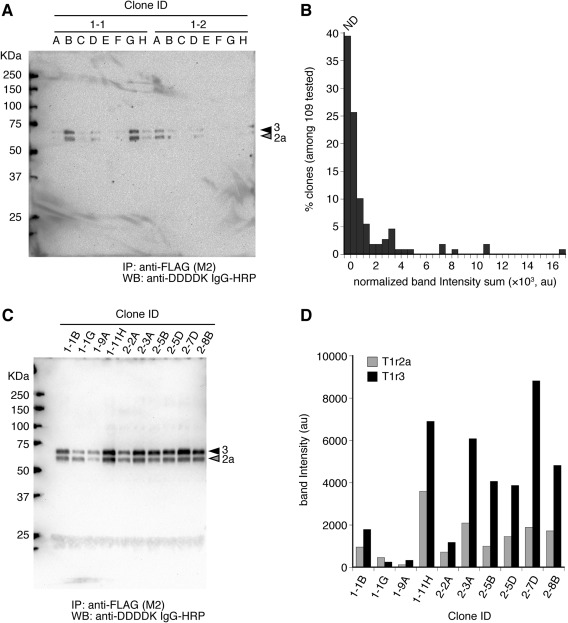
Stable high‐expression cell cloning for T1r2aLBD/T1r3LBD heterodimer using S2 cells. (A) A typical example of a western blotting for analysis of expression levels of clones in the first selection process. The labels above the membrane indicate the clone IDs analyzed in each well. In this membrane, 16 clones, namely #1–1A to 1–1H and 1–2A to 1–2H, were analyzed. (B) A histogram of the expression level of each clone analyzed by western blotting in the first screening process. The sum of normalized band intensities of T1r2aLBD and T1r3LBD for each clone was compared. ND: no detectable bands were observed under the tested condition. (C) Western blotting analysis of expression levels of clones in the second selection process. The labels above the membrane indicate the clone IDs analyzed in each well. (D) The quantified result of the band intensities of panel C.
We subjected the #1–11H clone to large‐scale protein production after adaption to a serum‐free medium. In addition to the improvement of the expression system, we introduced a modification in the purification process of the T1r2aLBD/T1r3LBD heterodimer. We found that the addition of high‐concentration calcium salt (40 mM) at the beginning of the purification selectively precipitates unstable species, such as the unpaired residual T1r3LBD, and results in a reduced aggregated fraction [the peak 1 in Fig. 4(A)] compared to the previous condition (Fig. 2). On the other hand, in the case of the sample expressed under the metallothionein promoter, the Ca2+ addition was less effective for reducing the aggregated fraction (Supporting Information Fig. S2). This might be because copper sulfate contained in the culture medium, used for the induction of protein expression, interferes the precipitation process. Through the combination of the modified purification process with the established high‐expression stable cell clone with an improved expression balance of the two subunits, the purity of the final protein sample was dramatically improved. That is, the final SEC elution profile displayed no noticeable aggregation fraction and much reduced monomer fraction [Fig. 4(B)], and SDS‐PAGE showed two equally intense bands for T1r2aLBD and T1r3LBD exclusively [Fig. 4(C)]. The expression level of the clone did not decrease significantly even after more than 20 passages (Table 1).
Figure 4.
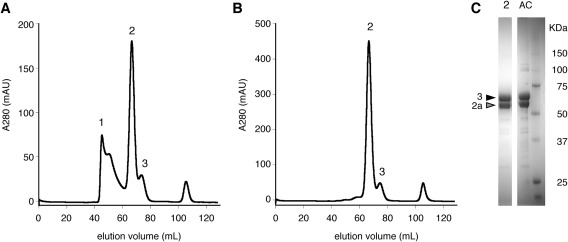
Purification results of T1r2aLBD/T1r3LBD heterodimer under the improved condition. (A) The elution profile of the final SEC step of the sample obtained from transient expression by S2 cells cultured in a serum‐containing medium. (B) The elution profile of the final SEC step of the sample obtained from the established stable high‐expression clone, #1–11H, cultured in a serum‐free medium. (C) SDS‐PAGE of after the first affinity chromatography step (AC) and the fraction at the top of peak 2 in the SEC step shown in panel B.
We confirmed the reproducibility of the described protocol by establishing another high‐expression stable cell clone actually used for our previous studies.31, 32 To avoid a nonspecific protein digestion and to further improve the final purity of the sample, we used the expression vectors in which the protease cleavage site was replaced with the Factor Xa site from the Thrombin site (Suppporting Information Fig. S3). After the optimization of expression and purification conditions, we routinely obtain ∼4 mg protein from 1 L culture of the finally selected clone #5D. By use of the proteins prepared from the clone, the monodispersity of the heterodimer was verified by SEC, analytical ultracentrifugation, and electron microscopic observation of a negatively stained sample.31 The purified protein sample enabled various biophysical and structural analyses of the T1rLBD heterodimer, such as isothermal calorimetry for ligand binding and small‐angle X‐ray scattering for the detection of conformational change upon ligand binding,31 and even crystallographic structure analysis.32
Discussion
We described a strategy that enabled the heterologous expression of the heterodimeric extracellular domains of a taste receptor. A conventional approach for the recombinant preparation of multiprotein complexes is co‐expression of the components. However, sometimes, a part of the components exhibits lower expression level than others, as observed for T1r2aLBD in this study (Fig. 2). Such biased expression caused heterogeneity of the sample, such as a residual monomer fraction and an aggregated fraction of unstable uncomplexed components, in addition to the proper complex of interest. One strategy to improve the homogeneity of the purified complex is an adoption of a different tag to each component and multistep purification by use of each purification tag one‐by‐one. In this study, we propose another strategy to achieve purification of the homogeneous complex: establishment of a stable expression cell in which the expression level of each component is adjusted to a similar level by selecting an appropriate clone at the screening stage. This strategy makes the best use of the expression capacity of the cells, reduces the purification steps, and therefore makes most of the final yield of the purified protein from the system. In addition, the use of a stable cell clone has an advantage in terms of the high reproducibility of the quality and quantity of the expression products compared to transient‐expression. In this study, a stable cell construction was achieved by a classical transfection and selection method, but the process is expected to be improved by the use of recently developed genome editing techniques, such as the CRISPR/Cas9 system.41 One drawback of the stable expression compared to the transient expression is that the former requires more time to obtain the purification results from the system. Therefore, stable‐ and transient‐expression should be chosen according to the requirement of the protein of interest and a stage of the proceedings of the study. For example, the latter would be efficient at the stage of selecting the expression systems and designing the expression construct, such as the purification tag selection. On the other hand, the former would serve better at the stage when the expression system and expression construct are set and subjected to a routine large‐scale protein preparation for various analyses.
In addition to the general points discussed above, high‐expression stable cell cloning was especially crucial for reproducible protein production of the extracellular domains of T1r, rather than the use of stable cell pool, although the latter is a conventional method for stable protein production by S2 cells.33 This was likely attributed to the slower growth of T1r‐expressing cells than nonexpressing cells, resulting in alteration of the cell population during the culture. In this study, more than half the clones were judged as nonexpressing clones at the selection process during the stable cell construction [Fig. 3(B)]. Large‐scale expression of recombinant proteins through the secretory pathway sometimes gives a high load to cellular processes, such as post‐translational modification, quality control, and trafficking of the products, and may cause cellular stresses. Indeed, production of a recombinant protein with localization signals including that for secretory pathway was found to cause defects in the growth of budding yeast cells.42 One strategy to circumvent the problems is the employment of an inducible expression system. However, it should be noted that the strategy is applicable only when the quality of the purified protein is unaffected by the induction procedure. Extracellular proteins are often produced by secreted expression, in which the protein is later purified from the culture medium. Induction of protein expression is usually achieved by the addition of a reagent to the culture medium, and thus, could more or less affect the latter purification processes. Indeed, in the case for T1rLBD expression, the use of metallothionein promoter, a common inducible promoter for S2 cells by use of a heavy metal salt, was unfavorable to achieve an effective purification (Suppporting Information Fig. S2). Taking into account these situations, the large‐scale expression strategy reported here may serve as one of the strategies worth considering for other multimeric extracellular protein complexes.
Materials and Methods
Vector construction
The expression vectors of the LBDs of T1r2a and T1r3 from medaka fish (T1r2a: 1–474 aa.; T1r3: 1–491 a.a.),31 followed by a protease cleavage site, the FLAG‐tag, and the octa‐His tag were constructed as follows. For construction of the vector for baculovirus expression, pFBD‐mfT1r2a3L, the coding sequence for T1r2aLBD, followed by the thrombin cleavage site (LVPRGS) and the two purification tags, was inserted between the BamHI and HindIII sites under the polyhedrin promoter, and that for T1r3LBD with the same cleavage site and tags was inserted between SmaI and KpnI sites under the p10 promoter in the pFastBac Dual vector (Invitrogen). The baculovirus for protein expression was prepared according to the manufacturer's protocol (Invitrogen). For the vectors for S2 cell expression under the metallothionein promoter, pMT‐mfT1r2aL(t) and pMT‐mfT1r3L(t), the same protein‐coding genes were inserted into the pMT/V5‐HisA vector (Invitrogen) between the SpeI and PmeI sites. For the vectors for S2 cell expression under the β‐actin promoter, pAc‐mfT1r2aL(t) and pAc‐mfT1r3L(t), the same protein‐coding genes were inserted into the pAc5.1/V5‐HisA vector (Invitrogen) between the EcoRI and PmeI sites (for T1r2a) or the KpnI and PmeI sites (for T1r3), respectively. For the vectors for S2 cell expression used in the previous study (pAc‐mfT1r2aL and pAc‐mfT1r3L),31 the Thrombin cleavage site in pAc‐mfT1r2aL(t) and pAc‐mfT1r3L(t) was replaced with the Factor Xa site (IEGR) (Suppporting Information Fig. S3).
Establishment of stable high‐expression S2 cell clones
All the cell culture procedures below were performed at 300 K. Plasmid vector transfection to Drosophila S2 cells was performed by the calcium phosphate method according to the manufacturer's protocol (Invitrogen). Briefly, 9.5 μg of pAc‐mfT1r2aL(t), 9.5 μg of pAc‐mfT1r3L(t), and 1 μg of pCoBlast (Invitrogen) were co‐transfected to 3 mL of S2 cells (at the cell density of ∼2 × 10⁶ cells/mL), cultured in complete Schneider's Drosophila medium (SDM, Invitrogen, supplemented with 10% FBS and 1 mM l‐glutamine) in a 35 mm dish or in a 6‐well plate. One day after the transfection, the cells were washed with and resuspended in fresh complete SDM. Three days after the transfection, the cells were resuspended in fresh complete SDM supplemented with 25 μg/mL Blasticidin S.
S2 cell cloning in soft agar was performed as basically described previously37 with some modifications. A week after the transfection, cells were plated in soft agar in order for antibiotic‐resistant cell selection and cloning. Typically, cells at three different amounts, 0.5 × 10⁵, 1.7 × 10⁵, and 5 × 10⁵ cells, were resuspended in 9 mL of 75–50% fresh and 25–50% conditioned complete SDM supplemented with 25 μg/mL Blasticidin S, where the latter was prepared by filtration of the medium after the culture of nontransfected S2 cells for 2–4 days. Then, the cells were mixed with 1 mL of 3% low melting point agarose (Agarose‐LM, Nacalai Tesque) in PBS (10 mM NaH2PO4, 1.8 mM KH2PO4, 137 mM NaCl, 2.7 mM KCl, pH 7.4), which was completely melted by incubation at 353K, and plated in a 90 mm dish or two 60 mm dishes at the final cell density of 0.5 × 10⁴, 1.7 × 10⁴, and 5 × 10⁴ cells/mL. The plates were put in a sealed plastic container for the prevention of dry up, and incubated for two weeks, avoiding vibration.
After the incubation (i.e., three weeks after the transfection), colonies of S2 cell clones were visible in size of ∼ 0.5–1 mm. A single colony was sucked up by a micropipette and plated in 100 μL fresh complete SDM with 25 μg/mL Blasticidin S in 96 well plates. Two to four days later, 100 μL of complete SDM was added to each well, and the cloned cells were subjected to further culture and expansion in the complete SDM.
The first high‐expression clone screening was performed generally a week after the S2 cell clones were plated in a 96 well plate. About 100 μL of the cell culture supernatant (the cultured medium) taken from each well was transferred to an Anti‐FLAG High Sensitivity, M2 Coated 96‐Well Plates (SIGMA). After 2 h of incubation at room temperature, each well was washed with 300 μL TBST (50 mM Tris, 150 mM NaCl, 0.5% Tween20, pH 7.4) three times, and the bound protein was eluted with 30 μL of the 2 × SDS‐PAGE sample buffer 125 mM Tris, 4% SDS, 20% glycerol, 0.004% bromophenol blue, pH 6.8, supplemented with 5 mM DTT). The second screening was performed after the clones selected at the first screening were expanded in a 24 well plate (with 0.5 mL culture volume) or in a larger scale. Typically, 200–500 μL of the cell culture supernatant taken from each well was mixed with 20 μL of ANTI‐FLAG M2 Affinity Gel (SIGMA) and rotated at 277 K for 1 h. After washing by TBS (TBS without Tween20) three times, the bound protein was eluted with 20 μL of the 2 × SDS‐PAGE sample buffer. In both cases, protein expression was analyzed by western blotting. The eluent protein was subjected to SDS‐PAGE with SuperSep Ace 10% gels (Wako) and electroblotted on a nitrocellulose membrane by iBlot (Invitrogen). After the blocking of the membrane by Blocking One (Nacalai Tesque), the protein was immunologically detected by use of Anti‐DDDDK‐tag HRP‐DirecT (MBL, Cat # PM020–7), and the chemiluminescent signals were detected using Immobilon Western HRP substrate (Millipore) and ChemidocXRS (Bio‐Rad).
The selected clones were adapted to a serum‐free medium, ExpressFive SFM, and subjected to protein production as described previously.31
For the establishment of a conventional stable cell pool (Suppporting Information Fig. S1), the cells transfected by pAc‐mfT1r2aL(t), pAc‐mfT1r3L(t), and pCoBlast as described above were passed in the presence of 25 μg/mL Blasticidin S for two weeks, according to the manufacturer's protocol.
Transient protein expression
All the cell culture procedures below were performed at 300 K. For baculovirus expression, High Five cells (Invitrogen), cultured in ExpressFive SFM (Invitrogen), were transfected by the bacmid at a multiplicity of infection of 1. The transfected cells were further cultured for 24 h. For transient expression in S2 cells, the co‐transfection of pMT‐mfT1r2aL(t) and pMT‐mfT1r3L(t) or pAc‐mfT1r2aL(t) and pAc‐mfT1r3L(t) with the same DNA amount (3.2 μg each per 1 mL culture volume at the cell density of ∼2 × 10⁶ cells/mL) was performed by the calcium phosphate method according to the manufacturer's protocol (Invitrogen). One day after the transfection, the cells were washed with and resuspended in fresh complete SDM. In the case of the protein expression under the metallothionein promoter, copper sulfate was added to the medium to a final concentration of 500 μM. In both cases, the cells were further incubated for 120 h.
Quantification of the western blotting results
Band intensities from the western blotting results were quantified using ImageJ.43 In order to compare the clones on different blots in the first screening [Fig. 3(B)], the sum of the intensities of two bands for T1r2aLBD and T1r3LBD on each blot were normalized using the values of the clones tested in the second screening. If two clones were selected for the second screening from the same blot, the clone showing closer intensities between the first and second screening was chosen as a control clone for calculation of the normalization factor for the blot. If no clones were selected for the second screening from the blot, all clones on the same blots were not included in the histogram analysis shown in Figure 3(B). In this study, 32 clones analyzed on two blots in the first screening were not included in the histogram analysis.
Protein purification
The T1r2a/3LBD protein was purified as described previously.31 Briefly, the cell culture medium, after the protein expression, was supplemented with l‐alanine and CaCl2 to final concentrations of 0.1M and 40 mM, and subjected to an affinity chromatography using ANTI‐FLAG M2 Affinity Gel in buffer A (20 mM Tris, 0.1M l‐alanine, 2 mM CaCl2, 0.3M NaCl, pH 8.0). The eluent was further purified by a SEC using a HiLoad 16/600 Superdex 200 pg column (GE HealthCare) connected to an AKTA Purifier (GE HealthCare) in buffer A. At an early stage of the study (Fig. 2), supplementation of alanine and CaCl2 at the first stage of purification was omitted, and the buffer A without 2 mM CaCl2 was used for the purification. In addition, the purification tag was removed by digestion with Thrombin (Novagen) at the ratio of 15 U per mg T1r2a/3LBD, at 277 K overnight, before the SEC step.
Competing Interest
The authors declare no competing interest.
Funding information
This work was financially supported by the Funding Program for Next Generation World‐Leading Researchers (NEXT Program) from the Japan Society for the Promotion of Science (JSPS)/the Council for Science and Technology Policy (CSTP) (LS130, to AY).
Supporting information
Supporting Information Figures.
Acknowledgments
The author thanks Drs. Atsushi Sato and Motoaki Wakiyama for advices on S2 cell cloning and culture; Maiko Hosotani for the photo of the low‐melting point agarose plate for S2 cell cloning; Fumie Iwabuki, Takashi Yamada, Naoko Ono, Noriko Matsuura, and Junko Nakamura for technical assistance.
Japan Society for the Promotion of Science, Next Generation World‐Leading Researchers/LS130.
Statement for a broader audience: Many extracellular proteins or extracellular domains of plasma membrane proteins exist or function as homo‐ or heteromeric multimer protein complexes. However, the successful protein production of such protein complexes used for life science studies is not often easy. Here we report a strategy for the recombinant protein production of multimeric protein complexes using Drosophila S2 cells, enabling successful preparation of the heterodimeric extracellular ligand binding domains of a taste receptor.
References
- 1. Gumbiner BM (1996) Cell adhesion: the molecular basis of tissue architecture and morphogenesis. Cell 84:345–357. [DOI] [PubMed] [Google Scholar]
- 2. Kew JN, Kemp JA (2005) Ionotropic and metabotropic glutamate receptor structure and pharmacology. Psychopharmacology 179:4–29. [DOI] [PubMed] [Google Scholar]
- 3. Jarvelainen H, Sainio A, Koulu M, Wight TN, Penttinen R (2009) Extracellular matrix molecules: potential targets in pharmacotherapy. Pharmacol Rev 61:198–223. [DOI] [PMC free article] [PubMed] [Google Scholar]
- 4. Trombetta ES, Parodi AJ (2003) Quality control and protein folding in the secretory pathway. Annu Rev Cell Dev Biol 19:649–676. [DOI] [PubMed] [Google Scholar]
- 5. Anelli T, Sitia R (2008) Protein quality control in the early secretory pathway. EMBO J 27:315–327. [DOI] [PMC free article] [PubMed] [Google Scholar]
- 6. Barlowe CK, Miller EA (2013) Secretory protein biogenesis and traffic in the early secretory pathway. Genetics 193:383–410. [DOI] [PMC free article] [PubMed] [Google Scholar]
- 7. Douris V, Swevers L, Labropoulou V, Andronopoulou E, Georgoussi Z, Iatrou K (2006) Stably transformed insect cell lines: tools for expression of secreted and membrane‐anchored proteins and high‐throughput screening platforms for drug and insecticide discovery. Adv Virus Res 68:113–156. [DOI] [PubMed] [Google Scholar]
- 8. Damasceno LM, Huang CJ, Batt CA (2012) Protein secretion in Pichia pastoris and advances in protein production. Appl Microbiol Biotechnol 93:31–39. [DOI] [PubMed] [Google Scholar]
- 9. Dalton AC, Barton WA (2014) Over‐expression of secreted proteins from mammalian cell lines. Protein Sci 23:517–525. [DOI] [PMC free article] [PubMed] [Google Scholar]
- 10. Chautard E, Ballut L, Thierry‐Mieg N, Ricard‐Blum S (2009) MatrixDB, a database focused on extracellular protein–protein and protein–carbohydrate interactions. Bioinformatics 25:690–691. [DOI] [PMC free article] [PubMed] [Google Scholar]
- 11. Hashimoto K, Nishi H, Bryant S, Panchenko AR (2011) Caught in self‐interaction: evolutionary and functional mechanisms of protein homooligomerization. Phys Biol 8:035007. [DOI] [PMC free article] [PubMed] [Google Scholar]
- 12. de Vos AM, Ultsch M, Kossiakoff AA (1992) Human growth hormone and extracellular domain of its receptor: crystal structure of the complex. Science 255:306–312. [DOI] [PubMed] [Google Scholar]
- 13. Kunishima N, Shimada Y, Tsuji Y, Sato T, Yamamoto M, Kumasaka T, Nakanishi S, Jingami H, Morikawa K (2000) Structural basis of glutamate recognition by a dimeric metabotropic glutamate receptor. Nature 407:971–977. [DOI] [PubMed] [Google Scholar]
- 14. Xiong JP, Stehle T, Diefenbach B, Zhang R, Dunker R, Scott DL, Joachimiak A, Goodman SL, Arnaout MA (2001) Crystal structure of the extracellular segment of integrin αVβ3. Science 294:339–345. [DOI] [PMC free article] [PubMed] [Google Scholar]
- 15. Jin R, Singh SK, Gu S, Furukawa H, Sobolevsky AI, Zhou J, Jin Y, Gouaux E (2009) Crystal structure and association behaviour of the GluR2 amino‐terminal domain. EMBO J 28:1812–1823. [DOI] [PMC free article] [PubMed] [Google Scholar]
- 16. Karakas E, Simorowski N, Furukawa H (2011) Subunit arrangement and phenylethanolamine binding in GluN1/GluN2B NMDA receptors. Nature 475:249–253. [DOI] [PMC free article] [PubMed] [Google Scholar]
- 17. Geng Y, Bush M, Mosyak L, Wang F, Fan QR (2013) Structural mechanism of ligand activation in human GABAB receptor. Nature 504:254–259. [DOI] [PMC free article] [PubMed] [Google Scholar]
- 18. Romier C, Ben Jelloul M, Albeck S, Buchwald G, Busso D, Celie PH, Christodoulou E, De Marco V, van Gerwen S, Knipscheer P, Lebbink JH, Notenboom V, Poterszman A, Rochel N, Cohen SX, Unger T, Sussman JL, Moras D, Sixma TK, Perrakis A (2006) Co‐expression of protein complexes in prokaryotic and eukaryotic hosts: experimental procedures, database tracking and case studies. Acta Crystallogr D 62:1232–1242. [DOI] [PubMed] [Google Scholar]
- 19. Fitzgerald DJ, Schaffitzel C, Berger P, Wellinger R, Bieniossek C, Richmond TJ, Berger I (2007) Multiprotein expression strategy for structural biology of eukaryotic complexes. Structure 15:275–279. [DOI] [PubMed] [Google Scholar]
- 20. Kriz A, Schmid K, Baumgartner N, Ziegler U, Berger I, Ballmer‐Hofer K, Berger P (2010) A plasmid‐based multigene expression system for mammalian cells. Nat Commun 1:120. [DOI] [PubMed] [Google Scholar]
- 21. Trowitzsch S, Bieniossek C, Nie Y, Garzoni F, Berger I (2010) New baculovirus expression tools for recombinant protein complex production. J Struct Biol 172:45–54. [DOI] [PubMed] [Google Scholar]
- 22. Kerrigan JJ, Xie Q, Ames RS, Lu Q (2011) Production of protein complexes via co‐expression. Protein Expr Purif 75:1–14. [DOI] [PubMed] [Google Scholar]
- 23. Nelson G, Hoon MA, Chandrashekar J, Zhang Y, Ryba NJ, Zuker CS (2001) Mammalian sweet taste receptors. Cell 106:381–390. [DOI] [PubMed] [Google Scholar]
- 24. Nelson G, Chandrashekar J, Hoon MA, Feng L, Zhao G, Ryba NJ, Zuker CS (2002) An amino‐acid taste receptor. Nature 416:199–202. [DOI] [PubMed] [Google Scholar]
- 25. Li X, Staszewski L, Xu H, Durick K, Zoller M, Adler E (2002) Human receptors for sweet and umami taste. Proc Natl Acad Sci USA 99:4692–4696. [DOI] [PMC free article] [PubMed] [Google Scholar]
- 26. Zhao GQ, Zhang Y, Hoon MA, Chandrashekar J, Erlenbach I, Ryba NJ, Zuker CS (2003) The receptors for mammalian sweet and umami taste. Cell 115:255–266. [DOI] [PubMed] [Google Scholar]
- 27. Xu H, Staszewski L, Tang H, Adler E, Zoller M, Li X (2004) Different functional roles of T1R subunits in the heteromeric taste receptors. Proc Natl Acad Sci USA 101:14258–14263. [DOI] [PMC free article] [PubMed] [Google Scholar]
- 28. Zhang F, Klebansky B, Fine RM, Xu H, Pronin A, Liu H, Tachdjian C, Li X (2008) Molecular mechanism for the umami taste synergism. Proc Natl Acad Sci USA 105:20930–20934. [DOI] [PMC free article] [PubMed] [Google Scholar]
- 29. Nie Y, Vigues S, Hobbs JR, Conn GL, Munger SD (2005) Distinct contributions of T1R2 and T1R3 taste receptor subunits to the detection of sweet stimuli. Curr Biol 15:1948–1952. [DOI] [PubMed] [Google Scholar]
- 30. Maîtrepierre E, Sigoillot M, Le Pessot L, Briand L (2012) Recombinant expression, in vitro refolding, and biophysical characterization of the N‐terminal domain of T1R3 taste receptor. Protein Expr Purif 83:75–83. [DOI] [PubMed] [Google Scholar]
- 31. Nango E, Akiyama S, Maki‐Yonekura S, Ashikawa Y, Kusakabe Y, Krayukhina E, Maruno T, Uchiyama S, Nuemket N, Yonekura K, Shimizu M, Atsumi N, Yasui N, Hikima T, Yamamoto M, Kobayashi Y, Yamashita A (2016) Taste substance binding elicits conformational change of taste receptor T1r heterodimer extracellular domains. Sci Rep 6:25745. [DOI] [PMC free article] [PubMed] [Google Scholar]
- 32. Nuemket N, Yasui N, Kusakabe Y, Nomura Y, Atsumi N, Akiyama S, Nango E, Kato Y, Kaneko MK, Takagi J, Hosotani M, Yamashita A (2017) Structural basis for perception of diverse chemical substances by T1r taste receptors. Nat Commun 8:15530. [DOI] [PMC free article] [PubMed] [Google Scholar]
- 33. Kirkpatrick RB, Shatzman A, Drosophila S2 system for heterologous gene expression In: Fernandez JM, Hoeffler JP. Eds. (1999) Gene expression systems, San Diego: Academic Press, pp 289–330. [Google Scholar]
- 34. Jarvis DL (2009) Baculovirus‐insect cell expression systems. Methods Enzymol 463:191–222. [DOI] [PubMed] [Google Scholar]
- 35. Cherbas L, Moss R, Cherbas P (1994) Transformation techniques for Drosophila cell lines. Methods Cell Biol 44:161–179. [DOI] [PubMed] [Google Scholar]
- 36. Moraes AM, Jorge SA, Astray RM, Suazo CA, Calderon Riquelme CE, Augusto EF, Tonso A, Pamboukian MM, Piccoli RA, Barral MF, Pereira CA (2012) Drosophila melanogaster S2 cells for expression of heterologous genes: from gene cloning to bioprocess development. Biotechnol Adv 30:613–628. [DOI] [PubMed] [Google Scholar]
- 37. Saigo K, Ueda R, Miyake T (1983) Polymorphism and stability of histone gene clusters in Drosophila melanogaster cultured cells. Biochim Biophys Acta 740:390–401. [DOI] [PubMed] [Google Scholar]
- 38. Ashikawa Y, Ihara M, Matsuura N, Fukunaga Y, Kusakabe Y, Yamashita A (2011) GFP‐based evaluation system of recombinant expression through the secretory pathway in insect cells and its application to the extracellular domains of class C GPCRs. Protein Sci 20:1720–1734. [DOI] [PMC free article] [PubMed] [Google Scholar]
- 39. Bunch TA, Grinblat Y, Goldstein LS (1988) Characterization and use of the Drosophila metallothionein promoter in cultured Drosophila melanogaster cells. Nucleic Acids Res 16:1043–1061. [DOI] [PMC free article] [PubMed] [Google Scholar]
- 40. Chung YT, Keller EB (1990) Positive and negative regulatory elements mediating transcription from the Drosophila melanogaster actin 5C distal promoter. Mol Cell Biol 10:6172–6180. [DOI] [PMC free article] [PubMed] [Google Scholar]
- 41. Lee JS, Kallehauge TB, Pedersen LE, Kildegaard HF (2015) Site‐specific integration in CHO cells mediated by CRISPR/Cas9 and homology‐directed DNA repair pathway. Sci Rep 5:8572. [DOI] [PMC free article] [PubMed] [Google Scholar]
- 42. Kintaka R, Makanae K, Moriya H (2016) Cellular growth defects triggered by an overload of protein localization processes. Sci Rep 6:31774. [DOI] [PMC free article] [PubMed] [Google Scholar]
- 43. Schneider CA, Rasband WS, Eliceiri KW (2012) NIH image to ImageJ: 25 years of image analysis. Nat Methods 9:671–675. [DOI] [PMC free article] [PubMed] [Google Scholar]
Associated Data
This section collects any data citations, data availability statements, or supplementary materials included in this article.
Supplementary Materials
Supporting Information Figures.