

ABSTRACT
Increasing antibiotic resistance among pathogenic bacterial species is a serious public health problem and has prompted research examining the antibacterial effects of alternative compounds and novel treatment strategies. Compounding this problem is the ability of many pathogenic bacteria to form biofilms during chronic infections. Importantly, these communities are often recalcitrant to antibiotic treatments that show effectiveness against acute infection. The antimicrobial properties of silver have been known for decades, but recently silver and silver-containing compounds have seen renewed interest as antimicrobial agents for treating bacterial infections. The goal of this study was to assess the ability of citrate-capped silver nanoparticles (AgNPs) of various sizes, alone and in combination with the aminoglycoside antibiotic tobramycin, to inhibit established Pseudomonas aeruginosa biofilms. Our results demonstrate that smaller 10-nm and 20-nm AgNPs were more effective at synergistically potentiating the activity of tobramycin. Visualization of biofilms treated with combinations of 10-nm AgNPs and tobramycin reveals that the synergistic bactericidal effect may be caused by disrupting cellular membranes. Minimum biofilm eradication concentration (MBEC) assays using clinical P. aeruginosa isolates shows that small AgNPs are more effective than larger AgNPs at inhibiting biofilms, but that the synergy effect is likely a strain-dependent phenomenon. These data suggest that small AgNPs synergistically potentiate the activity of tobramycin against P. aeruginosa in vitro and may reveal a potential role for AgNP/antibiotic combinations in treating patients with chronic infections in a strain-specific manner.
KEYWORDS: Pseudomonas aeruginosa, biofilms, silver, synergy
INTRODUCTION
Bacterial biofilms are communities of cells attached to biotic or abiotic surfaces that are encased in an extracellular matrix consisting of secreted proteins, polysaccharides, nucleic acids, and cellular debris. These cellular communities have a complex physical structure with gradients of oxygen, nutrients, wastes, secondary metabolites, and pH and redox conditions (1–3). Because of this, bacteria are found in various metabolic states throughout biofilms—some are actively multiplying while others are dormant or dead (4, 5). The biofilm lifestyle provides pathogens with survival strategies against host defenses, antibiotics, and other environmental factors by protecting against physical trauma, desiccation, and the specific activities of many antimicrobial agents. Specifically, the antimicrobial resistance of chronic bacterial infections has been linked to the inherent architecture of the biofilms they form. Conventional resistance mechanisms associated with planktonic (i.e., “free-swimming”) bacteria, such as efflux pump upregulation, expression of chromosomal beta-lactamase, and mutations in antibiotic target molecules also contribute to the increased antimicrobial resistance of biofilms. The multitude of virulence and resistance mechanisms operating during biofilm growth severely limits our ability to treat chronic infections (4–6).
Pseudomonas aeruginosa is an urgent multidrug-resistant threat that is showing increased resistance to important classes of antibiotics that are critical for treating serious Gram-negative infections (7, 8). Upon exposure to antibiotics and other environmental stresses, P. aeruginosa uses a number of survival strategies, including adaptation to a biofilm lifestyle (2, 9, 10). Current antibiotic treatments are often unable to effectively clear biofilm-mediated chronic P. aeruginosa infections, and as such there is a pressing need for research into new treatments that specifically target bacterial biofilms.
In this study, we examined the efficacy of combining different-sized citrate-capped silver nanoparticles (AgNPs) with the aminoglycoside antibiotic tobramycin for elimination of preformed P. aeruginosa biofilms, comprised of lab or clinical isolates, in vitro. Our results demonstrate that smaller-sized AgNPs are more effective, alone and in combination with tobramycin, in reducing P. aeruginosa PAO1 biofilm biomass and viability than larger-sized nanoparticles. Similarly, combinations of smaller AgNPs and tobramycin also reduce biofilm biomass and viability for two clinical P. aeruginosa isolates, but the nature of these interactions was found to be strain dependent. Together, these findings highlight the potential for AgNPs to enhance the activity of commonly used antibiotics, including protein synthesis inhibitors such as tobramycin, against P. aeruginosa biofilms.
RESULTS
Determining the effects of tobramycin on biofilm biomass and viability.
To assess the antimicrobial properties of tobramycin against P. aeruginosa PAO1 biofilms we used the MBEC (minimum biofilm eradication concentration) high-throughput assay (11–13). This assay is separated into three distinct stages (growth, challenge, and recovery; see Materials and Methods) and can determine both MBEC and MIC values (11, 13, 14). Biofilms treated with increasing concentrations of tobramycin during the challenge phase demonstrated an initial increase in biomass (∼140% up to ∼94 μg/ml of tobramycin), followed by a reduction in recovered biomass to ∼50% at the highest concentrations tested, compared to that for untreated biofilms (Fig. 1). Biofilm viability (inferred from the cell density of the planktonic population associated with the biofilm after the challenge and recovery phases) decreased as the concentration of tobramycin increased, resulting in ∼25% cell viability at the highest concentrations of tobramycin tested, compared to that for untreated biofilms (Fig. 1). The MIC and MBEC values for tobramycin were determined to be 5.86 μg/ml and between 2,000 to 2,500 μg/ml, respectively.
FIG 1.
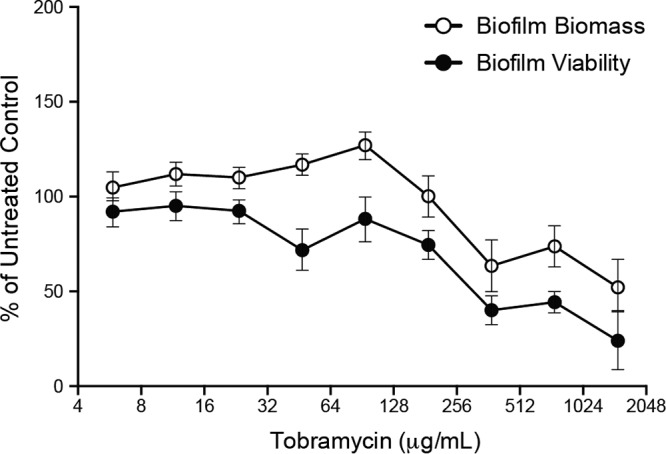
High concentrations of tobramycin reduce, but do not eliminate, P. aeruginosa PAO1 biofilms. Biofilm biomass and viability following challenge with tobramycin (0.0 μg/ml to 1500 μg/ml). Values were normalized to those obtained from untreated controls after biofilms were incubated in fresh media in the recovery phase (expressed as % of untreated controls). Mean values for 6 replicates ± the standard deviations are shown.
Determining the antimicrobial activity of different sized AgNPs against PAO1.
We determined MIC and MBEC values for each of the different-sized AgNPs used in this study (Table 1). The 10-nm and 20-nm AgNPs showed the lowest median MICs (0.312 μg/ml and 0.625 μg/ml, respectively) and MBEC (3.75 μg/ml) values, while the 40-nm and 60-nm AgNPs showed higher median MICs (1.25 μg/ml and 2.50 μg/ml, respectively) and were unable to completely inhibit biofilm viability following the recovery phase at the highest concentration of AgNPs tested (10.0 μg/ml). The 100-nm AgNPs had a median MIC of 7.50 μg/ml. Importantly, MBEC values could not be determined for the 100-nm AgNPs, as P. aeruginosa biofilms remained viable (i.e., planktonic growth was observed in the recovery plate) for all concentrations of AgNPs tested (Table 1). As a measure of quality control, the size distribution of the five different AgNP preparations was confirmed by transmission electron microscopy (TEM) (see Fig. S1 in the supplemental material).
TABLE 1.
Minimum inhibitory and eradication concentrations of different-sized AgNPsa
| AgNP treatment (nm) | MIC (μg/ml) |
n | MBEC (μg/ml) |
n | ||||
|---|---|---|---|---|---|---|---|---|
| Range | Median | Mode | Range | Median | Mode | |||
| 10 | 0.156 to 0.625 | 0.312 | 0.156 | 8 | 1.25 to 5.00 | 3.75 | 5.00 | 6 |
| 20 | 0.312 to 2.50 | 0.625 | 1.25 | 8 | 1.25 to 5.00 | 3.75 | 5.00 | 6 |
| 40 | 0.312 to 2.50 | 1.25 | 1.25 | 8 | 2.50 to >10.0b | >2.50b | >5.00b | 6 |
| 60 | 1.25 to 10.0 | 2.50 | 2.50 | 8 | 5.00 to >10.0b | >5.00b | >10.0b | 6 |
| 100 | 2.50 to 10.0 | 7.50 | 10.0 | 8 | NDc | >10.0c | >10.0c | 6 |
MICs were observed for individual antimicrobials against planktonic cells. MBECs are concentrations determined for individual antimicrobials by measuring the inhibition of biofilm viability following the 20-h challenge of P. aeruginosa PAO1 biofilms. Biofilm viability was assessed by measuring the optical density at 600 nm (OD600) of the planktonic cultures in the wells of the microtiter plate following the 20 h of incubation of the recovery phase.
Biofilms remained viable (i.e., planktonic growth was observed) following recovery at the highest concentration of AgNPs tested (10.0 μg/ml).
Biofilms remained viable (i.e., planktonic growth was observed) following recovery for all concentrations of AgNPs tested (0.156 μg/ml to 10.0 μg/ml). ND, not determined.
Identifying concentrations and sizes of AgNPs that inhibit biofilm biomass and viability when combined with tobramycin.
To determine the effects of different combinations of AgNP + tobramycin on established P. aeruginosa PAO1 biofilms, we used the MBEC assay to evaluate biofilm biomass after challenge (Fig. 2 and 3; see also Fig. S2, and S3 in the supplemental material). For clarity, we have presented the data from small, medium, and large AgNPs (10 nm, 40 nm, and 100 nm, respectively) in this section, and have only shown the data for the full size range (including 20-nm and 60-nm AgNPs) in the supplemental material. In the absence of AgNPs (i.e., 0.0 μg/ml), biofilm biomass decreased as the concentration of tobramycin increased (Fig. 2A) in a manner similar to that seen in Fig. 1. The 10-nm AgNP + tobramycin challenge demonstrated that 0.312 μg/ml was the lowest effective AgNP concentration, eliminating biofilm biomass at almost all concentrations of tobramycin (Fig. 2C). In contrast, the 20-nm AgNP + tobramycin challenge showed a reduction in biofilm biomass at an AgNP concentration of 0.625 μg/ml (see Fig. S2D in the supplemental material), while the 40-nm (Fig. 2F) and 60-nm (see Fig. S2F in the supplemental material) AgNP combinations showed reductions at 2.50 μg/ml. The 100-nm AgNP + tobramycin challenge only showed patterns of reduction at the highest concentrations of AgNPs tested (10.0 μg/ml; Fig. 2H).
FIG 2.

Small AgNPs are more effective at reducing biofilm biomass. Data demonstrating the effects of different AgNP-tobramycin combinations on P. aeruginosa PAO1 biofilm biomass in the recovery phase. Normalized values of percent recovery of biofilm biomass following challenge with different combinations of tobramycin (0.0 μg/ml to 1,500 μg/ml) and AgNP sizes (10 nm, 40 nm, and 100 nm) at eight different AgNP concentrations (0.0 μg/ml to 10.0 μg/ml, indicated in the top left corner of each panel), including panel A, which represents replicate samples treated with tobramycin only. Biofilm biomass values for treated samples were normalized to values for untreated cells (i.e., 0.0 μg/ml AgNPs and 0.0 μg/ml tobramycin). Dashed lines indicate 100% recovery (i.e., levels observed for untreated cells). Mean values for a minimum of 6 replicates ± the standard deviations are shown.
FIG 3.

Small AgNPs are more effective at reducing biofilm viability. Data demonstating the effects of different AgNP-tobramycin combinations on P. aeruginosa PAO1 biofilm viability in the recovery phase. Normalized values of percent viability of biofilms following challenge with different combinations of tobramycin (0.0 μg/ml to 1,500 μg/ml) and AgNP sizes (10 nm, 40 nm, and 100 nm) at the specific AgNP concentrations (0.0 μg/ml to 10.0 μg/ml) indicated in the top left corner of each panel are shown (panel A represents replicate samples treated with tobramycin only). Biofilm viability values were normalized to values for untreated control samples (i.e., 0.0 μg/ml AgNPs and 0.0 μg/ml tobramycin). Dashed lines indicate 100% recovery (i.e., levels observed for untreated cells). Mean values for a minimum of 6 replicates ± the standard deviations are shown.
The viability measurements for P. aeruginosa biofilms after challenge with different combinations of AgNPs and tobramycin (Fig. 3; see also Fig. 3 in the supplemental material) followed a similar pattern as that observed for biofilm biomass, in that smaller AgNPs were more effective than large AgNPs at the same μg/ml dose (indicated by lower viability compared to untreated control). At a concentration of 0.312 μg/ml, the 10-nm AgNP combinations reduced biofilm viability below that of the untreated control for all doses of tobramycin (Fig. 3C), whereas an AgNP concentration of 0.625 μg/ml was required to obtain a similar effect for 20-nm particles (see Fig. S3D in the supplemental material). Likewise, AgNP concentrations of 2.50 μg/ml were required to reduce viability for combinations containing 40-nm (Fig. 3F) and 60-nm (see Fig. S3F in the supplemental material) AgNPs. Finally, the 100-nm AgNP combinations only reduced biofilm viability at 5.00 μg/ml (Fig. 3G). Together, these data suggest that, in AgNP + tobramycin challenges, smaller AgNPs were more effective in reducing P. aeruginosa PAO1 biofilm biomass and viability.
Visualizing and quantifying antimicrobial synergy of AgNPs and tobramycin against P. aeruginosa biofilms.
We used heat plots to visualize the effect of combining AgNPs and tobramycin on biofilm biomass and viability (Fig. 4). The observed pattern of the heat plots provides an initial indication of synergy, like isobologram plots of drug-drug interactions (15). A concave appearance between the dark red versus light red areas, such as that seen with the 10-nm AgNP biomass and viability plots (Fig. 4; top panels, curved lines), indicates that synergistic interactions occurred. This concave appearance is less obvious for the 20-nm data, but still present, indicating synergistic interactions. Plots for the 40-nm, 60-nm, and 100-nm AgNPs have a linear appearance between dark red and light red areas, reflecting primarily additive interactions of the AgNPs and tobramycin against the P. aeruginosa biofilms. These plots further highlight that smaller AgNPs had greater effects than larger AgNPs on biofilm biomass and viability at lower tobramycin concentrations. Heat plots also identified specific antimicrobial combinations that can be further tested for synergistic effects in preventing recovery of P. aeruginosa biofilm populations following challenge. To quantify potential synergy, we used fractional inhibitory concentration index (FICi) values to determine the nature of the effects observed with different antimicrobial combinations. Evaluation of synergy using calculations of median FICi values indicated that 10-nm and 20-nm AgNPs exhibited synergistic interactions with tobramycin against both biofilm and planktonic Pseudomonas PAO1 (Table 2), while the 40-nm, 60-nm, and 100-nm AgNPs showed an additive effect (Table 2).
FIG 4.

Heat maps demonstrate enhanced biofilm reduction by small AgNPs and identify potential synergistic combinations of tobramycin + AgNPs. Comparison of effects of different AgNP-tobramycin combinations on biofilm biomass (left) and biofilm viability (right) in the recovery phase, according to AgNP size (indicated on the right). Results are presented as heat plots illustrating the normalized values of percent recovery of biofilm biomass and viability after treatment with AgNPs and tobramycin. One hundred percent recovery equals levels observed for untreated control samples. Darker red boxes indicate greater percent recoveries (i.e., greater biofilm biomass or viability), whereas lighter red boxes indicate lower biofilm recovery (i.e., greater antimicrobial effect). Dashed lines represent the nature of the interaction for each combination of AgNPs and tobramycin, with concave lines representing synergistic interactions and straight lines representing additive interactions.
TABLE 2.
Fractional inhibitory concentration indices calculated for tobramycin and AgNP combinations that inhibited P. aeruginosa PAO1 biofilmsa
| AgNP treatment (nm) | Biofilm |
Planktonic |
||||
|---|---|---|---|---|---|---|
| FICib | Range | Interaction type | FICib | Range | Interaction type | |
| 10 | 0.11 | 0.00 to 0.63 | Synergistic | 0.07 | 0.07 to 0.43 | Synergistic |
| 20 | 0.21 | 0.08 to 0.73 | Synergistic | 0.14 | 0.08 to 0.66 | Synergistic |
| 40 | 0.26 | 0.14 to 0.66 | Synergistic | 0.25 | 0.14 to 0.66 | Synergistic |
| 60 | 0.50 | 0.16 to 1.02 | Synergistic | 0.43 | 0.13 to 1.02 | Synergistic |
| 100 | 0.52 | 0.33 to 1.04 | Additive | 0.52 | 0.26 to 1.08 | Additive |
Biofilm viability was assessed by measuring the OD600 of the planktonic cultures in the wells of the microtiter plate following the 20 h of incubation of the recovery phase.
Fractional inhibitory concentration index (FICi) presented as median values.
Next, we used transmission electron microscopy (TEM) to visualize the physical changes that occurred at the cellular level upon exposure of P. aeruginosa cells within a biofilm to AgNP and tobramycin treatments. Representative micrographs of resin-embedded thin sections revealed the morphology and ultrastructure of cells and the internal structure of the biofilms (Fig. 5). Micrographs of untreated biofilm controls showed the presence of intact P. aeruginosa PAO1 cells and biofilm matrix material (Fig. 5A). Biofilms treated with 10-nm AgNPs (0.312 μg/ml) or with tobramycin (94.0 μg/ml) showed no significant morphological or ultrastructural defects (Fig. 5B and C) compared with untreated cells. However, biofilms treated with a combination of the two (i.e., 0.312 μg/ml of 10-nm AgNPs + 94.0 μg/ml tobramycin) exhibited more extensive cellular changes, including altered cellular morphology and cytoplasmic clearing, indicating that the integrity of the bacterial cell envelope was likely compromised (Fig. 5D).
FIG 5.
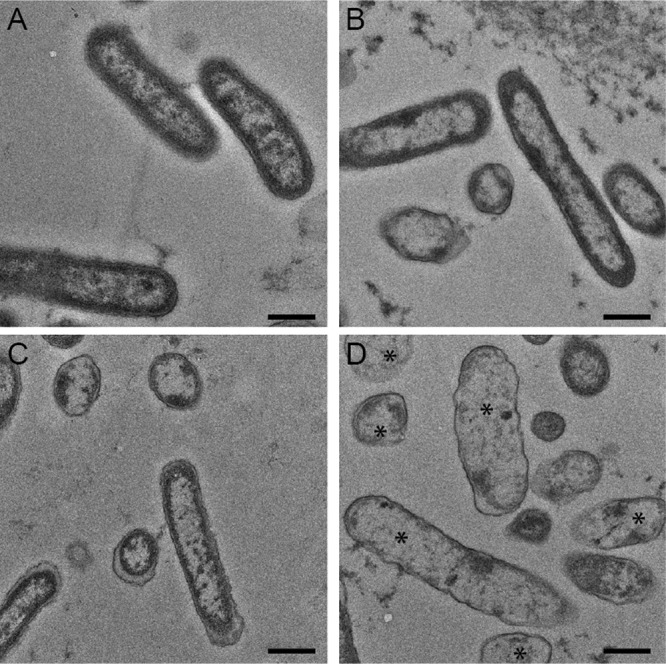
Cellular ultrastructure reveals changes to membrane integrity. Transmission electron micrographs were used to examine the effect of 10-nm AgNPs on P. aeruginosa biofilms. (A to D) Negatively stained transmission electron micrographs of P. aeruginosa PAO1 biofilms cultured in silicone tubing for 72 h and either left untreated (A) or treated for 18 h with tobramycin (94.0 μg/ml) (B), 10-nm AgNPs (0.312 μg/ml) (C), or 10-nm AgNPs (0.312 μg/ml) plus tobramycin (94.0 μg/ml) (D). Asterisks in panel D highlight cells with increased cytoplasmic clearing and morphological changes compared to untreated cells in panel A. Bar, 50 nm.
Determining the effect of small AgNPs and tobramycin on clinical P. aeruginosa biofilms.
To determine if combinations of 10-nm AgNPs + tobramycin were also more effective than 100-nm AgNP + tobramycin combination against clinical P. aeruginosa strains, we used the MBEC assay to evaluate two clinical isolates. The Liverpool epidemic strain isolate LES400 (16, 17) and the prairie epidemic strain isolate PES385 (18, 19) were selected because they were originally isolated from patients with cystic fibrosis and are associated with increased patient morbidity, risk of respiratory death and/or lung transplantation, and high levels of antibiotic resistance (17, 18). The last characteristic is demonstrated by the observation that the LES400 and PES385 isolates showed higher MIC values for tobramycin (94.0 μg/ml and 375.0 μg/ml, respectively), compared to that of PAO1 (5.86 μg/ml), and similarly high MBEC values (Table 3). In contrast, the median MIC values for LES400 and PES385 exposed to 10-nm AgNPs was ∼4-fold higher (Table 3) than those determined for PAO1 (Table 1), while the MIC values for 100-nm AgNPs were similar for all three strains (Table 3). When we tested the effect of AgNP + tobramycin combinations on the clinical strains we found that the addition of 10-nm AgNPs showed greater reductions in biomass and viability at lower concentrations than did the 100-nm AgNPs (Fig. 6A and B). However, median FIC (fractional inhibitory concentration) index values suggest strain-dependent differences in the interaction between the 10-nm and 100-nm AgNP + tobramycin combinations (Table 3). For the LES400 isolate, the median FIC indices for 10-nm and 100-nm AgNP + tobramycin combinations were additive. However, synergistic combinations were observed for both AgNP sizes (Table 3). For 10-nm AgNPs, although the majority of effective combinations with tobramycin were additive, at 0.625 μg/ml AgNP and between 12 to 375 μg/ml tobramycin the combinations were synergistic at eliminating the LES400 biofilms. For PES385 the median FIC index for the 10-nm AgNPs was synergistic, while the value for 100-nm AgNPs was additive (Table 3). Against PES385 biofilms, there was a wider range of 10-nm AgNP and tobramycin combinations that was synergistic at eliminating PES385 biofilms compared to the LES400 isolate (Table 3). These results suggest that although smaller 10-nm AgNPs are better at inhibiting biofilms in combination with tobramycin than 100-nm AgNPs, strain-level differences in susceptibility to AgNP + tobramycin combinations do exist.
TABLE 3.
Median MIC, MBEC, and FICi values for individual and combinations of antimicrobials following the 20 h challenge of clinical P. aeruginosa biofilmsa
| Treatment | LES400 |
PES385 |
||||||||
|---|---|---|---|---|---|---|---|---|---|---|
| MIC (μg/ml) | MBEC (μg/ml) | FICi (interaction type) | FICi range | n | MIC (μg/ml) | MBEC (μg/ml) | FICi (interaction type) | FICi range | n | |
| 10 nm AgNP | 1.25 | 5 | 3 | 1.25 | 3.75 | 3 | ||||
| 100 nm AgNP | 10.0 | >10.0 | 3 | 5.0 | >10.0 | 3 | ||||
| TOB | 94.0 | >1,500 | 6 | 375 | >1,500 | 6 | ||||
| 10 nm AgNP + TOB | 0.51 (additive) | 0.26 to 0.99 | 3 | 0.31 (synergistic) | 0.13 to 0.75 | 3 | ||||
| 100 nm AgNP + TOB | 0.53 (additive) | 0.13 to 1.50 | 3 | 0.52 (additive) | 0.19 to 1.00 | 3 | ||||
MIC, MBEC, and FICi presented as median values. FICi values are reported for cells from the recovery phase. TOB, tobramycin.
FIG 6.

Treatment with combinations of 10-nm AgNPs and tobramycin results in lower biofilm viability and biomass, indicating greater bacterial killing of clinical isolates. Data demonstrate the effects of 10-nm and 100-nm AgNP-tobramycin combinations on biofilm viability in the recovery phase of clinical P. aeruginosa isolates. Normalized values of percent biomass (circles and solid lines) and viability (squares and dashed lines) of biofilms following challenge with different combinations of tobramycin (0.0 μg/ml to 1,500 μg/ml) and 10-nm (blue symbols) and 100-nm (red symbols) AgNPs. The specific AgNP concentrations (0.0 μg/ml to 5.0 μg/ml) are indicated in the top left corner of each panel. Biofilm biomass and viability values are presented for the clinical isolates LES400 (A) and PES385 (B). All values were normalized to untreated control samples (i.e., 0.0 μg/ml AgNPs and 0.0 μg/ml tobramycin). Dashed lines indicate 100% recovery (i.e., levels observed for untreated cells). Mean values for a minimum of 3 replicates ± the standard deviations are shown.
DISCUSSION
The antimicrobial effects of silver have been known for decades (20–22), but despite its historical use and recent inclusion in consumer products (20), little is known about the mechanisms of its antimicrobial action (23–26). Recent studies have assessed the effects of silver ions and AgNPs in combination with commonly used antibiotics and found that silver potentiates antimicrobial action of antibiotics against planktonically cultured bacterial pathogens (27–38). Small AgNPs (8 to 10 nm) have also shown to be effective at detaching preformed P. aeruginosa biofilms (39) and recent studies from our lab have shown that small AgNPs (10 to 20 nm) synergize the antimicrobial activity of the monobactam antibiotic aztreonam (11).
Here we assessed the ability of citrate-capped AgNPs of different sizes, alone and in combination with the aminoglycoside antibiotic tobramycin, to prevent the recovery of P. aeruginosa PAO1 biofilms in vitro, comparing a lab strain (PAO1) and two clinical isolates (LES400 and PES385). Our results showed that treatment of preformed biofilms with tobramycin alone resulted in decreases in both biofilm biomass and viability compared to untreated controls (Fig. 1). These results are different than those previously observed for aztreonam, where PAO1 biofilm biomass increased with increasing concentration of antibiotic while viability remained unchanged at 100% (11). This suggests that tobramycin has better in vitro inhibitory effects against planktonic cells and preformed biofilms than aztreonam. The MIC and MBEC values for the different-sized AgNPs reported here (Table 1) were similar to those reported previously for PAO1 (11, 27, 30, 40, 41).
Specific combinations of tobramycin and AgNPs were effective at reducing both biofilm biomass and viability, with the smaller 10-nm and 20-nm AgNPs providing the most synergy against planktonic and biofilm cultures. The larger particles also reduced both biofilm biomass and viability but required much higher concentrations of tobramycin and AgNPs. This same trend was observed in our previous study with aztreonam (11), but with greatly reduced efficacy for the larger AgNPs; when combined with aztreonam the 40-nm, 60-nm, and 100-nm AgNPs could not eliminate PAO1 biofilm biomass or viability even at the highest concentrations tested. These results are surprising, as the MIC and MBEC values obtained for tobramycin and aztreonam were similar (tobramycin MIC = 5.86 μg/ml and MBEC = 2,000 to 2,500 μg/ml; aztreonam MIC = 2.00 μg/ml and MBEC = 4,000 μg/ml). This suggests that the antimicrobial synergy provided by the smaller AgNPs differs for each type of antibiotic and may be dependent on the antibiotic's mechanism of action. Mechanisms of silver activity against bacteria have been studied for over 40 years. For example, silver nitrate has been shown to inhibit respiratory function, exert uncoupler-like activity, inhibit succinate uptake, inhibit NADP-linked glutamate dehydrogenase, and collapse the membrane potential or proton motive force across the cytoplasmic membrane, leading to disruption of the cellular membranes (42–44). Aminoglycoside antibiotics such as tobramycin have been shown to have two potential killing mechanisms, inhibition of protein synthesis (45) and perturbation of the outer membrane (46–48). It has also recently been proposed that disruption of the outer bacterial membrane by tobramycin may be critical to enhance antibiotic penetration, and that aminoglycosides could potentially be used synergistically with other antimicrobials to combat multidrug-resistant infections (49). This proposed mechanism could account for the difference observed between aztreonam and tobramycin in our studies. However, TEM micrographs of cells treated with 10-nm AgNPs (0.312 μg/ml) and tobramycin (94.0 μg/ml) (Fig. 5D) show similar morphological and cell envelope defects as those treated with similar concentrations of 10-nm AgNPs and aztreonam (11), suggesting that while specific mechanism may differ between the synergistic effect of tobramycin + AgNPs and aztreonam + AgNPs, the small AgNPs are important in potentiating the antimicrobial effect of both classes of antibiotic by compromising the cell envelope.
In summary, our results also show that small AgNPs are effective antimicrobial agents alone and in combination with tobramycin at relatively low concentrations (0.312 μg/ml and 0.625 μg/ml for 10-nm and 20-nm AgNPs, respectively) against PAO1 biofilms. Similar results were observed for the two clinical isolates; however, effective AgNP concentrations were higher, suggesting that differences in effectiveness are in part strain-dependent. This is in contrast with recent studies that show higher MIC and FICi values for small AgNPs (33, 34, 40), and suggests that in addition to strain-dependent differences other factors, including mode of AgNP production and surface functionalization, may play an important role in AgNP antimicrobial activity. Combined, these data demonstrate the ability of small citrate-capped AgNPs to synergistically enhance the antimicrobial effects of tobramycin against P. aeruginosa biofilms in vitro and highlight the potential benefit of using low concentrations of each antimicrobial to reduce potential toxicity effects of silver and the possibility of bacterial resistance to antibiotics.
MATERIALS AND METHODS
Bacteria, growth conditions, and antimicrobial agents.
P. aeruginosa PAO1 (50), LES400 (16, 17), and PES385 (18, 19) were cultured in minimal Davis medium (MDM) supplemented with 0.1% (wt/vol) dextrose, as described previously (11). Tobramycin and the various-sized citrate-capped AgNPs (10, 20, 40, 60, and 100 nm) were purchased from Sigma-Aldrich (St. Louis, MO). Tobramycin and AgNP stock solution were prepared in MDM at a concentration 4 times higher than the highest concentration used in the minimum biofilm eradication concentration (MBEC) assays and stored at −20°C.
MBEC assays, biofilm viability, and biofilm biomass determinations.
The MBEC assays were performed in triplicate, using independent P. aeruginosa cultures for each replicate. The tests were divided into growth, challenge and recovery phases as previously described, with separate 20-h incubation periods for each phase (11, 23). For the growth phase of the experiment, MBEC plates were placed in a humidified container, placed in an incubator at 37°C, and shaken at 100 rpm to develop the biofilms. Following the incubation, the optical density at 600 nm (OD600) of the planktonic cultures was determined. Biofilms that formed on the peg surfaces of the MBEC plate during the growth phase were rinsed in phosphate-buffered saline (PBS) and placed in microtiter challenge plates containing different combinations of tobramycin and the AgNPs, prepared using a microdilution two-dimensional (2D) checkerboard procedure (27). The setup of each challenge plate evaluated 2-fold dilutions of tobramycin (1,500 μg/ml, highest concentration; 6.00 μg/ml, lowest concentration) with 2-fold dilutions of AgNP (10.0 μg/ml, highest concentration; 0.156 μg/ml, lowest concentration). To determine the MBEC value of tobramycin alone, a separate test was conducted to evaluate tobramycin concentrations between 188 and 4,000 μg/ml. Within each challenge plate, MDM only (negative growth control) and MDM only plus biofilms (untreated growth control) were included. Following the challenge phase, the OD600 of the planktonic cultures was determined and used to calculate MIC values. Additionally, peg biofilms were rinsed in PBS, placed in the recovery-phase microtiter plate containing 200 μl MDM/well, and incubated (11).
At the end of the recovery phase, the OD600 of the planktonic cultures in the wells of the microtiter plate were measured to determine the biofilm viability (i.e., the presence of viable bacterial cells shed from a treated biofilm). Biofilm viability measurements were normalized and expressed as % of untreated controls. The OD600 values were also used for MBEC determination as described previously (11–13). For recovery-phase biofilm biomass determination, the pegs attached to the lids of the MBEC plates were washed by placing them in a fresh microtiter plate containing 200 μl PBS in each well for 1 to 2 min, which removed any loosely adherent cells. The biofilms were then processed and stained with crystal violet to measure biomass (i.e., cells and extracellular matrix material) as previously described (14, 51). Briefly, after rinsing the peg lid in PBS, the biofilms were fixed in 99% methanol for 15 min and then air dried. The peg biofilms were then stained in 0.2% crystal violet (wt/vol) for 5 min. The biofilms were rinsed twice in deionized water to remove excess stain and allowed to air dry. To solubilize the bound dye, the stained biofilms were placed in 33% glacial acetic acid for 10 min. The absorbance of each sample was measured at 590 nm. These values were normalized and expressed as % of untreated controls.
Silicone tube assays.
Biofilms were grown in a flowthrough biofilm tubing reactor and imaged as previously described (11). Following biofilm development, the flow was stopped and the biofilms were treated with either 94.0 μg/ml tobramycin or 94.0 μg/ml tobramycin with 0.312 μg/ml 10-nm AgNPs (a synergistic combination, as identified by the MBEC assays). An untreated growth control was also prepared with 2 ml of MDM alone. The tubing was incubated statically for up to 18 h. Sections of tubing 1 cm long were cut from the 20-cm segment at defined time points posttreatment (0, 8, 12, 18, and 24 h). The tube sections were placed in 1.5-ml microcentrifuge tubes with 2.5% glutaraldehyde in 0.1-M Na-cacodylate buffer to fix the samples, and then stored at 4°C prior to evaluation of cell morphology via transmission electron microscopy (TEM). Based on our initial observations, the 18-h samples were selected for evaluation by TEM.
Fractional inhibitory concentration index calculations.
The FIC index (52, 53) for tobramycin and AgNP combinations was calculated to determine the nature of the inhibitory effects observed in the MBEC assays. Briefly, the FIC index was calculated for the first nonturbid well (indicating low/no growth) in each row and column of the recovery plate, representing the lowest tobramycin/AgNP combinations that inhibited the P. aeruginosa biofilm, i.e., the MBEC. OD600 values ≤0.01 were considered nonturbid. The following equation was used: ΣFIC = FICA + FICB = (CA/MBECA) + (CB/MBECB), where MBECA and MBECB are the MBECs of AgNP and tobramycin alone, respectively, and CA and CB are the concentrations of the AgNP and tobramycin in combination, respectively. An FIC index value of ≤0.5 was considered synergistic, a value of >0.5 to <4 was considered to be no interaction/additive, and a value ≥4 was antagonistic The FIC index median and range were determined for data at tobramycin and AgNP concentrations less than their respective MBECs where growth or biomass were inhibited. An FIC index value of ≤0.5 was considered synergistic, a value of >0.5 to <4 was considered to be no interaction/additive, and a value ≥4 was antagonistic.
Statistical analysis.
Graphical presentation and statistical analyses of the data were completed using Prism 6 (GraphPad Software, Inc., San Diego, CA).
Supplementary Material
ACKNOWLEDGMENTS
This work was supported by a Cystic Fibrosis Canada Kin Fellowship to Amber J. Park, an NSERC CGS-D doctoral award to Mara C. Goodyear, and an NSERC Discovery Grant (no. 371639) to Cezar M. Khursigara.
We thank Deborah Stewart Khursigara for critical reading of the manuscript and editorial assistance.
We also thank Roger C. Levesque and Michael Parkins for providing the clinical P. aeruginosa isolates LES400 and PES385, respectively.
Footnotes
Supplemental material for this article may be found at https://doi.org/10.1128/AAC.00415-17.
REFERENCES
- 1.Høiby N, Bjarnsholt T, Givskov M, Molin S, Ciofu O. 2010. Antibiotic resistance of bacterial biofilms. Int J Antimicrobial Agents 35:322–332. doi: 10.1016/j.ijantimicag.2009.12.011. [DOI] [PubMed] [Google Scholar]
- 2.Costerton JW. 2001. Cystic fibrosis pathogenesis and the role of biofilms in persistent infection. Trends Microbiol 9:50–52. doi: 10.1016/S0966-842X(00)01918-1. [DOI] [PubMed] [Google Scholar]
- 3.Burmølle M, Thomsen TR, Fazli M, Dige I, Christensen L, Homøe P, Tvede M, Nyvad B, Tolker-Nielsen T, Givskov M, Moser C, Kirketerp-Møller K, Johansen HK, Høiby N, Jensen PØ, Sørensen SJ, Bjarnsholt T. 2010. Biofilms in chronic infections—a matter of opportunity—monospecies biofilms in multispecies infections. FEMS Immunol Med Microbiol 59:324–336. doi: 10.1111/j.1574-695X.2010.00714.x. [DOI] [PubMed] [Google Scholar]
- 4.Harrison F. 2007. Microbial ecology of the cystic fibrosis lung. Microbiology 153:917–923. doi: 10.1099/mic.0.2006/004077-0. [DOI] [PubMed] [Google Scholar]
- 5.Li Z, Kosorok MR, Farrell PM, Laxova A, West SEH, Green CG, Collins J, Rock MJ, Splaingard ML. 2005. Longitudinal development of mucoid Pseudomonas aeruginosa infection and lung disease progression in children with cystic fibrosis. JAMA 293:581–588. doi: 10.1001/jama.293.5.581. [DOI] [PubMed] [Google Scholar]
- 6.Fothergill JL, Panagea S, Hart CA, Walshaw MJ, Pitt TL, Winstanley C. 2007. Widespread pyocyanin over-production among isolates of a cystic fibrosis epidemic strain. BMC Microbiol 7:45–10. doi: 10.1186/1471-2180-7-45. [DOI] [PMC free article] [PubMed] [Google Scholar]
- 7.Folkesson A, Jelsbak L, Yang L, Johansen HK, Ciofu O, Høiby N, Molin S. 2012. Adaptation of Pseudomonas aeruginosa to the cystic fibrosis airway: an evolutionary perspective. Nat Rev Microbiol 10:841–851. doi: 10.1038/nrmicro2907. [DOI] [PubMed] [Google Scholar]
- 8.Hassett DJ, Korfhagen TR, Irvin RT, Schurr MJ, Sauer K, Lau GW, Sutton MD, Yu H, Høiby N. 2010. Pseudomonas aeruginosa biofilm infections in cystic fibrosis: insights into pathogenic processes and treatment strategies. Expert Opin Ther Targets 14:117–130. doi: 10.1517/14728220903454988. [DOI] [PubMed] [Google Scholar]
- 9.Govan JR, Deretic V. 1996. Microbial pathogenesis in cystic fibrosis: mucoid Pseudomonas aeruginosa and Burkholderia cepacia. Microbiol Rev 60:539–574. [DOI] [PMC free article] [PubMed] [Google Scholar]
- 10.O'Toole G, Kaplan HB, Kolter R. 2000. Biofilm formation as microbial development. Annu Rev Microbiol 54:49–79. doi: 10.1146/annurev.micro.54.1.49. [DOI] [PubMed] [Google Scholar]
- 11.Habash MB, Park AJ, Vis EC, Harris RJ, Khursigara CM. 2014. Synergy of silver nanoparticles and aztreonam against Pseudomonas aeruginosa PAO1 biofilms. Antimicrob Agents Chemother 58:5818–5830. doi: 10.1128/AAC.03170-14. [DOI] [PMC free article] [PubMed] [Google Scholar]
- 12.Ceri H, Olson ME, Stremick C, Read RR, Morck D, Buret A. 1999. The Calgary Biofilm Device: new technology for rapid determination of antibiotic susceptibilities of bacterial biofilms. J Clin Microbiol 37:1771–1776. [DOI] [PMC free article] [PubMed] [Google Scholar]
- 13.Ceri H, Olson M, Morck D, Storey D, Read R, Buret A, Olson B. 2001. The MBEC Assay System: multiple equivalent biofilms for antibiotic and biocide susceptibility testing. Methods Enzymol 337:377–385. doi: 10.1016/S0076-6879(01)37026-X. [DOI] [PubMed] [Google Scholar]
- 14.Peeters E, Nelis HJ, Coenye T. 2008. Comparison of multiple methods for quantification of microbial biofilms grown in microtiter plates. J Microbiol Methods 72:157–165. doi: 10.1016/j.mimet.2007.11.010. [DOI] [PubMed] [Google Scholar]
- 15.Hegreness M, Shoresh N, Damian D, Hartl D, Kishony R. 2008. Accelerated evolution of resistance in multidrug environments. Proc Natl Acad Sci U S A 105:13977–13981. doi: 10.1073/pnas.0805965105. [DOI] [PMC free article] [PubMed] [Google Scholar]
- 16.Salunkhe P, Smart CHM, Morgan JAW, Panagea S, Walshaw MJ, Hart CA, Geffers R, Tümmler B, Winstanley C. 2005. A cystic fibrosis epidemic strain of Pseudomonas aeruginosa displays enhanced virulence and antimicrobial resistance. J Bacteriol 187:4908–4920. doi: 10.1128/JB.187.14.4908-4920.2005. [DOI] [PMC free article] [PubMed] [Google Scholar]
- 17.Jeukens J, Boyle B, Kukavica-Ibrulj I, Ouellet MM, Aaron SD, Charette SJ, Fothergill JL, Tucker NP, Winstanley C, Levesque RC. 2014. Comparative genomics of isolates of a Pseudomonas aeruginosa epidemic strain associated with chronic lung infections of cystic fibrosis patients. PLoS One 9:e87611-15. doi: 10.1371/journal.pone.0087611. [DOI] [PMC free article] [PubMed] [Google Scholar]
- 18.Duong J, Booth SC, McCartney NK, Rabin HR, Parkins MD, Storey DG. 2015. Phenotypic and genotypic comparison of epidemic and non-epidemic strains of Pseudomonas aeruginosa from individuals with cystic fibrosis. PLoS One 10:e0143466. doi: 10.1371/journal.pone.0143466. [DOI] [PMC free article] [PubMed] [Google Scholar]
- 19.Parkins MD, Glezerson BA, Sibley CD, Sibley KA, Duong J, Purighalla S, Mody CH, Workentine ML, Storey DG, Surette MG, Rabin HR. 2014. Twenty-five-year outbreak of Pseudomonas aeruginosa infecting individuals with cystic fibrosis: identification of the prairie epidemic strain. J Clin Microbiol 52:1127–1135. doi: 10.1128/JCM.03218-13. [DOI] [PMC free article] [PubMed] [Google Scholar]
- 20.Nowack B, Krug HF, Height M. 2011. 120 years of nanosilver history: implications for policy makers. Environ Sci Technol 45:1177–1183. doi: 10.1021/es103316q. [DOI] [PubMed] [Google Scholar]
- 21.Chernousova S, Epple M. 2012. Silver as Antibacterial Agent: Ion, Nanoparticle, and Metal. Angew Chem Int Ed Engl 52:1636–1653. doi: 10.1002/anie.201205923. [DOI] [PubMed] [Google Scholar]
- 22.Griffith M, Udekwu KI, Gkotzis S, Mah TF, Alarcon EI. 2015. Anti-microbiological and anti-infective activities of silver, p 127–146. In Alarcon EI, Griffith M, Udekwu KI (ed), Silver nanoparticle applications. Springer, Cham, Switzerland. [Google Scholar]
- 23.Harrison JJ, Turner RJ, Ceri H. 2005. High-throughput metal susceptibility testing of microbial biofilms. BMC Microbiol 5:53. doi: 10.1186/1471-2180-5-53. [DOI] [PMC free article] [PubMed] [Google Scholar]
- 24.Morones JR, Elechiguerra JL, Camacho A, Holt K, Kouri JB, Ramírez JT, Yacaman MJ. 2005. The bactericidal effect of silver nanoparticles. Nanotechnology 16:2346–2353. doi: 10.1088/0957-4484/16/10/059. [DOI] [PubMed] [Google Scholar]
- 25.Lok C-N, Ho C-M, Chen R, He Q-Y, Yu W-Y, Sun H, Tam PK-H, Chiu J-F, Che C-M. 2007. Silver nanoparticles: partial oxidation and antibacterial activities. J Biol Inorg Chem 12:527–534. doi: 10.1007/s00775-007-0208-z. [DOI] [PubMed] [Google Scholar]
- 26.Eid M, Araby E. 2013. Bactericidal effect of poly(acrylamide/itaconic acid)–silver nanoparticles synthesized by gamma irradiation against Pseudomonas aeruginosa. Appl Biochem Biotechnol 171:469–487. doi: 10.1007/s12010-013-0357-1. [DOI] [PubMed] [Google Scholar]
- 27.Hwang I-S, Hwang JH, Choi H, Kim K-J, Lee DG. 2012. Synergistic effects between silver nanoparticles and antibiotics and the mechanisms involved. J Med Microbiol 61:1719–1726. doi: 10.1099/jmm.0.047100-0. [DOI] [PubMed] [Google Scholar]
- 28.Gnanadhas DP, Ben Thomas M, Thomas R, Raichur AM, Chakravortty D. 2013. Interaction of silver nanoparticles with serum proteins affects their antimicrobial activity in vivo. Antimicrob Agents Chemother 57:4945–4955. doi: 10.1128/AAC.00152-13. [DOI] [PMC free article] [PubMed] [Google Scholar]
- 29.Morones-Ramirez JR, Winkler JA, Spina CS, Collins JJ. 2013. Silver enhances antibiotic activity against Gram-negative bacteria. Sci Transl Med 5:190ra81–190ra81. doi: 10.1126/scitranslmed.3006276. [DOI] [PMC free article] [PubMed] [Google Scholar]
- 30.Markowska K, Grudniak AM, Krawczyk K, Wróbel I, Wolska KI. 2014. Modulation of antibiotic resistance and induction of a stress response in Pseudomonas aeruginosa by silver nanoparticles. J Med Microbiol 63:849–854. doi: 10.1099/jmm.0.068833-0. [DOI] [PubMed] [Google Scholar]
- 31.Sondi I, Salopek-Sondi B. 2004. Silver nanoparticles as antimicrobial agent: a case study on E. coli as a model for Gram-negative bacteria. J Colloid Interface Sci 275:177–182. doi: 10.1016/j.jcis.2004.02.012. [DOI] [PubMed] [Google Scholar]
- 32.Jain J, Arora S, Rajwade JM, Omray P, Khandelwal S, Paknikar KM. 2009. Silver nanoparticles in therapeutics: development of an antimicrobial gel formulation for topical use. Mol Pharm 6:1388–1401. doi: 10.1021/mp900056g. [DOI] [PubMed] [Google Scholar]
- 33.Smekalova M, Aragon V, Panacek A, Prucek R, Zboril R, Kvetek L. 2016. Enhanced antibacterial effect of antibiotics in combination with silver nanoparticles against animal pathogens. Vet J 209:174–179. doi: 10.1016/j.tvjl.2015.10.032. [DOI] [PubMed] [Google Scholar]
- 34.Wan G, Ruan L, Yin Y, Yang T, Ge M, Cheng X. 2016. Effects of silver nanoparticles in combination with antibiotics on the resistant bacteria Acinetobacter baumannii. Int J Nanomedicine (Lond) 11:3789–3800. doi: 10.2147/IJN.S104166. [DOI] [PMC free article] [PubMed] [Google Scholar]
- 35.Fakhri A, Tahami S, Naji M. 2017. Synthesis and characterization of core-shell bimetallic nanoparticles for synergistic antimicrobial effect studies in combination with doxycycline on burn specific pathogens. J Photochem Photobiol B, Biol 169:21–26. doi: 10.1016/j.jphotobiol.2017.02.014. [DOI] [PubMed] [Google Scholar]
- 36.Aziz N, Pandey R, Barman I, Prasad R. 2016. Leveraging the attributes of Mucor hiemalis-derived silver nanoparticles for a synergistic broad-spectrum antimicrobial platform. Front Microbiol 7:1984. doi: 10.3389/fmicb.2016.01984. [DOI] [PMC free article] [PubMed] [Google Scholar]
- 37.Akram FE, El-Tayeb T, Abou-Aisha K, El-Azizi M. 2016. A combination of silver nanoparticles and visible blue light enhances the antibacterial efficacy of ineffective antibiotics against methicillin-resistant Staphylococcus aureus (MRSA). Ann Clin Microbiol Antimicrob 15:48. doi: 10.1186/s12941-016-0164-y. [DOI] [PMC free article] [PubMed] [Google Scholar]
- 38.Patra JK, Baek K-H. 2017. Antibacterial activity and synergistic antibacterial potential of biosynthesized silver nanoparticles against foodborne pathogenic bacteria along with its anticandidal and antioxidant effects. Front Microbiol 8:167. doi: 10.3389/fmicb.2017.00167. [DOI] [PMC free article] [PubMed] [Google Scholar]
- 39.Loo C-Y, Young PM, Cavaliere R, Whitchurch CB, Lee W-H, Rohanizadeh R. 2014. Silver nanoparticles enhance Pseudomonas aeruginosa PAO1 biofilm detachment. Drug Dev Ind Pharm 40:719–729. doi: 10.3109/03639045.2013.780182. [DOI] [PubMed] [Google Scholar]
- 40.Panáček A, Smékalová M, Kilianová M, Prucek R, Bogdanová K, Večeřová R, Kolář M, Havrdová M, Płaza GA, Chojniak J, Zbořil R, Kvítek L. Strong and nonspecific synergistic antibacterial efficiency of antibiotics combined with silver nanoparticles at very low concentrations showing no cytotoxic effect. Molecules 21:26. doi: 10.3390/molecules21010026. [DOI] [PMC free article] [PubMed] [Google Scholar]
- 41.Qayyum S, Khan AU. 2016. Nanoparticles vs. biofilms: a battle against another paradigm of antibiotic resistance. Med Chem Commun (Camb) 7:1479–1498. doi: 10.1039/C6MD00124F. [DOI] [Google Scholar]
- 42.Dibrov P, Dzioba J, Gosink KK, Häse CC. 2002. Chemiosmotic mechanism of antimicrobial activity of Ag+ in Vibrio cholerae. Antimicrob Agents Chemother 46:2668–2670. doi: 10.1128/AAC.46.8.2668-2670.2002. [DOI] [PMC free article] [PubMed] [Google Scholar]
- 43.Holt KB, Bard AJ. 2005. Interaction of silver(I) ions with the respiratory chain of Escherichia coli: an electrochemical and scanning electrochemical microscopy study of the antimicrobial mechanism of micromolar Ag+. Biochemistry 44:13214–13223. doi: 10.1021/bi0508542. [DOI] [PubMed] [Google Scholar]
- 44.Schreurs WJ, Rosenberg H. 1982. Effect of silver ions on transport and retention of phosphate by Escherichia coli. J Bacteriol 152:7–13. [DOI] [PMC free article] [PubMed] [Google Scholar]
- 45.Davis BD. 1987. Mechanism of bactericidal action of aminoglycosides. Microbiol Rev 51:341–350. [DOI] [PMC free article] [PubMed] [Google Scholar]
- 46.Loh B, Grant C, Hancock RE. 1984. Use of the fluorescent probe 1-N-phenylnaphthylamine to study the interactions of aminoglycoside antibiotics with the outer membrane of Pseudomonas aeruginosa. Antimicrob Agents Chemother 26:546–551. doi: 10.1128/AAC.26.4.546. [DOI] [PMC free article] [PubMed] [Google Scholar]
- 47.Hancock RE, Raffle VJ, Nicas TI. 1981. Involvement of the outer membrane in gentamicin and streptomycin uptake and killing in Pseudomonas aeruginosa. Antimicrob Agents Chemother 19:777–785. doi: 10.1128/AAC.19.5.777. [DOI] [PMC free article] [PubMed] [Google Scholar]
- 48.Kadurugamuwa JL, Clarke AJ, Beveridge TJ. 1993. Surface action of gentamicin on Pseudomonas aeruginosa. J Bacteriol 175:5798–5805. doi: 10.1128/jb.175.18.5798-5805.1993. [DOI] [PMC free article] [PubMed] [Google Scholar]
- 49.Bulitta JB, Ly NS, Landersdorfer CB, Wanigaratne NA, Velkov T, Yadav R, Oliver A, Martin L, Shin BS, Forrest A, Tsuji BT. 2015. Two mechanisms of killing of Pseudomonas aeruginosa by tobramycin assessed at multiple inocula via mechanism-based modeling. Antimicrob Agents Chemother 59:2315–2327. doi: 10.1128/AAC.04099-14. [DOI] [PMC free article] [PubMed] [Google Scholar]
- 50.Hancock RE, Carey AM. 1979. Outer membrane of Pseudomonas aeruginosa: heat- and 2-mercaptoethanol-modifiable proteins. J Bacteriol 140:902–910. [DOI] [PMC free article] [PubMed] [Google Scholar]
- 51.Stepanovic S, Vukovic D, Dakic I, Savic B, Svabic-Vlahovic M. 2000. A modified microtiter-plate test for quantification of staphylococcal biofilm formation. J Microbiol Methods 40:175–179. doi: 10.1016/S0167-7012(00)00122-6. [DOI] [PubMed] [Google Scholar]
- 52.Berenbaum MC. 1978. A method for testing for synergy with any number of agents. J Infect Dis 137:122–130. doi: 10.1093/infdis/137.2.122. [DOI] [PubMed] [Google Scholar]
- 53.den Hollander JG, Mouton JW, Verbrugh HA. 1998. Use of pharmacodynamic parameters to predict efficacy of combination therapy by using fractional inhibitory concentration kinetics. Antimicrob Agents Chemother 42:744–748. [DOI] [PMC free article] [PubMed] [Google Scholar]
Associated Data
This section collects any data citations, data availability statements, or supplementary materials included in this article.