ABSTRACT
Colistin adheres to a range of materials, including plastics in labware. The loss caused by adhesion influences an array of methods detrimentally, including MIC assays and in vitro time-kill experiments. The aim of this study was to characterize the extent and time course of colistin loss in different types of laboratory materials during a simulated time-kill experiment without bacteria or plasma proteins present. Three types of commonly used large test tubes, i.e., soda-lime glass, polypropylene, and polystyrene, were studied, as well as two different polystyrene microplates and low-protein-binding microtubes. The tested concentration range was 0.125 to 8 mg/liter colistin base. Exponential one-phase and two-phase functions were fitted to the data, and the adsorption of colistin to the materials was modeled with the Langmuir adsorption model. In the large test tubes, the measured start concentrations ranged between 44 and 102% of the expected values, and after 24 h, the concentrations ranged between 8 and 90%. The half-lives of colistin loss were 0.9 to 12 h. The maximum binding capacities of the three materials ranged between 0.4 and 1.1 μg/cm2, and the equilibrium constants ranged between 0.10 and 0.54 ml/μg. The low-protein-binding microtubes showed start concentrations between 63 and 99% and concentrations at 24 h of between 59 and 90%. In one of the microplates, the start concentrations were below the lower limit of quantification at worst. In conclusion, to minimize the effect of colistin loss due to adsorption, our study indicates that low-protein-binding polypropylene should be used when possible for measuring colistin concentrations in experimental settings, and the results discourage the use of polystyrene. Furthermore, when diluting colistin in protein-free media, the number of dilution steps should be minimized.
KEYWORDS: colistin, adsorption, in vitro
INTRODUCTION
For many Gram-negative multiresistant pathogenic strains, such as Klebsiella pneumoniae and Acinetobacter baumannii strains, the polymyxin antibiotics, of which colistin is the most commonly used (1), are the only remaining treatment options. As there are still many gaps in the knowledge about colistin, a wide range of preclinical and clinical studies on the antibacterial properties of colistin and other polymyxins are being performed, and there is an increasing demand to include colistin in routine susceptibility testing of clinical isolates. It is well known that the amphipathic nature of colistin, which has both lipophilic and hydrophilic, polycationic components (2, 3), causes it to adhere to a wide range of materials, including plastics in labware. As an example, polystyrene usually has a negative surface charge and is therefore prone to bind cations such as proteins and colistin. This is a property that is deliberately enhanced in tissue culture plates to improve the adherence of cells to the plate. Likewise, plastics can be manufactured in a manner that decreases the adhesion of proteins, often marketed as “low protein binding.” In contrast, it has been previously shown that protein content ameliorates the problem of adsorption; i.e., plasma concentrations are accurately quantified and thereby not affected (4). If colistin is considerably lost during experiments, a multitude of data generated from standard laboratory procedures may thus be unreliable and may not accurately characterize the concentration-effect relationships. Even more serious is that colistin is lost in different degrees depending on which type of material is used in the experiment, since this introduces a strong condition-specific systematic error between laboratories. The types of data that are affected by colistin loss include those derived from MIC assays, including targets determined in pharmacokinetic/pharmacodynamic (PK/PD) index studies, in vitro time-kill models, and pharmacokinetic studies using, e.g., dialysis, microdialysis (5), or bronchoalveolar lavage or other nonprotein fluids.
These issues have been the subject of much discussion in the scientific community in different fora, mainly during talks and discussions in conferences. While the implications are potentially serious, the loss of colistin during experiments has not been well characterized in the literature, although a number of papers have discussed the problem (4, 6–14).
The aim of this study was to characterize the extent and time course of colistin loss in different types of laboratory materials during a simulated time-kill experiment without bacteria, using a validated liquid chromatography-tandem mass spectrometry (LC-MS/MS) assay method for determination of colistin concentrations in culture media (3). The effects of different dilution approaches were also investigated. The different materials were compared with regard to total colistin binding, the loss kinetics were examined by a fitting one-phase decay function, and the binding characteristics were analyzed by fitting the Langmuir model of adsorption to the data.
RESULTS
Comparison of dilution schemes.
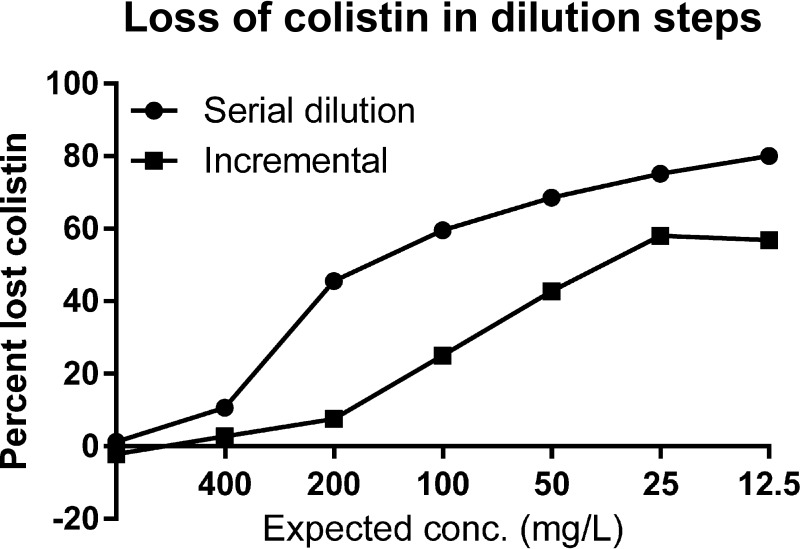
The loss of colistin in the dilution steps from stock to final concentrations ranged from 0% to 57% in the incremental dilution scheme and from 0% to 80% in the serial dilution scheme (Fig. 1). In each dilution step where fresh plastic comes into contact with a colistin-containing solution, the available colistin concentration decreases.
FIG 1.
Mean loss of colistin per dilution step for each of the different dilution strategies in Fig. 5.
Experiments in large test tubes.
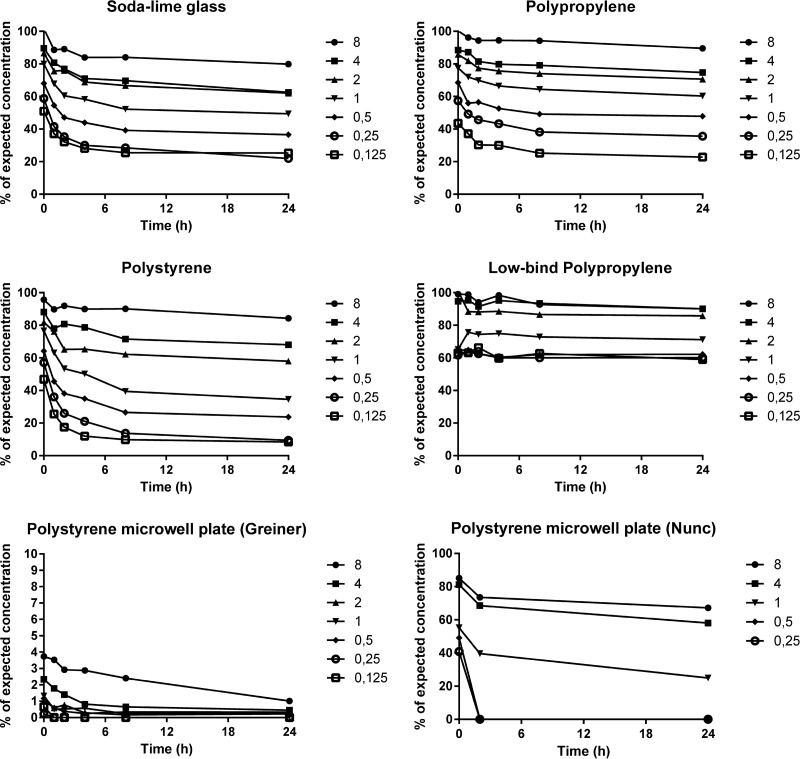
In the glass tubes (Fig. 2), the measured start concentrations (at t = 0) ranged between 51 and 102% of the expected concentrations (based on measured concentrations in the 10,000-mg/liter stock solutions). The highest percentages were found with the highest concentrations, and they decreased as concentrations were lowered. Colistin was also lost over time, with 25 to 80% of expected concentrations left at 24 h, which was best described by the one-phase exponential function without degradation, with concentration-dependent half-lives ranging between 0.9 and 2.2 h (k = 0.31 to 0.75 h−1). The variability in the measured concentrations (coefficient of variation [CV]) ranged between 3 and 56%, and this value increased with decreasing concentrations (which was consistent for all materials).
FIG 2.
Concentrations of colistin over time in the different materials as percentages of the expected concentrations (based on the measured concentrations in the stock solutions). Curves show means from triplicate experiments, except in microwell plates, where only one experiment was performed in the Nunc plates and two experiments in the Greiner plates (the second with sampling only at 0, 2, and 24 h) to verify the extremely low concentrations. Note the scale shift in the y axis for the Greiner plate. Target concentrations in milligrams per liter are indicated for the symbols.
In the polypropylene tubes (Fig. 2), the pattern was similar, with start concentrations ranging between 44 and 100% of the expected values and decreasing over time (23 to 90% of expected values at 24 h). The one-phase curve fit had loss half-lives between 1.1 and 4.3 h (k = 0.16 to 0.63 h−1). The variability in the data (CV) ranged between 1 and 52%.
The pattern was repeated in polystyrene (Fig. 2). Initial concentrations were 47 to 96% of expected values and decreased over time (8.4 to 84% of expected values at 24 h), and the half-lives were 0.9 to 11.6 h (k = 0.06 to 0.80 h−1). The variability of the data (CV) ranged between 2 and 104%.
Low-protein-binding microtubes.
In the experiments with low-protein-binding polypropylene microtubes (Fig. 2), the initial concentrations were higher than in the other materials, between 63 and 99%, and the degree of loss during the experiments was much lower than for any of the other tested materials (59 to 90% of expected values at 24 h). The half-lives of colistin loss could not be reliably quantified. The variability in the data (CV) ranged between 2 and 39%.
Microplates.
The measured concentrations in the polystyrene microplates showed a large difference between the two plates. In the Nunc plates, the loss of colistin was similar to the loss in the larger Nunc polystyrene tubes (one experiment), whereas the concentrations in the Greiner Bio-one plates were much lower than expected (two experiments). The initial concentrations in the latter ranged from 4% of expected values in the case of 8 mg/liter down to below the limit of quantification in the cases of 0.25 mg/liter and 0.125 mg/liter, and consequently the reported data are limited (Fig. 2).
Adsorption equilibrium analysis.
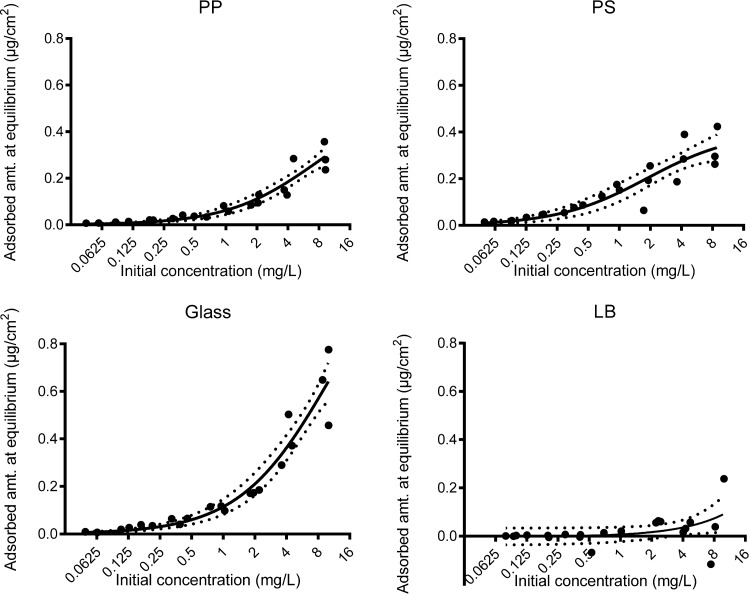
The Langmuir adsorption model described the data well for the large tubes (Fig. 3), with r2 values between 0.83 and 0.92. The normal Langmuir model was preferred to the more complex, modified Langmuir model according to the F test. The inclusion of a linear degradation term did not improve the fit, and the degradation constant was estimated to be infinitesimally small. The fitted parameters are related to the binding strength (Langmuir equilibrium constant K) and maximum binding capacity (Lmax), and they differed markedly between the different materials (Table 1). Glass had the highest maximum binding capacity (1.32 μg/cm2), followed by polypropylene (0.54 μg/cm2) and polystyrene (0.40 μg/cm2). Polystyrene had the highest equilibrium constant (0.54 ml/μg), followed by polypropylene (0.13 ml/μg) and glass (0.10 ml/μg). In the low-protein-binding tubes, the adsorption over time was too low in the measured range for the model to be accurately fitted.
FIG 3.
Adsorption equilibrium analysis according to the Langmuir adsorption model. The dotted lines represent the 95% confidence interval of the fitted curve. PP, polypropylene; PS, polystyrene; LB, low-protein-binding polypropylene.
TABLE 1.
Lmax, K, and r2 as determined from the experiments in the large test tubesa
| Parameter | Mean (SE) in: |
||
|---|---|---|---|
| PP | PS | Glass | |
| Lmax (μg/cm2) | 0.54 (0.12) | 0.40 (0.04) | 1.32 (0.27) |
| K (ml/μg) | 0.13 (0.05) | 0.54 (0.19) | 0.10 (0.04) |
| r2 | 0.91 | 0.83 | 0.92 |
Abbreviations: Lmax, maximum binding capacity; K, Langmuir equilibrium constant; PP, polypropylene; PS, polystyrene.
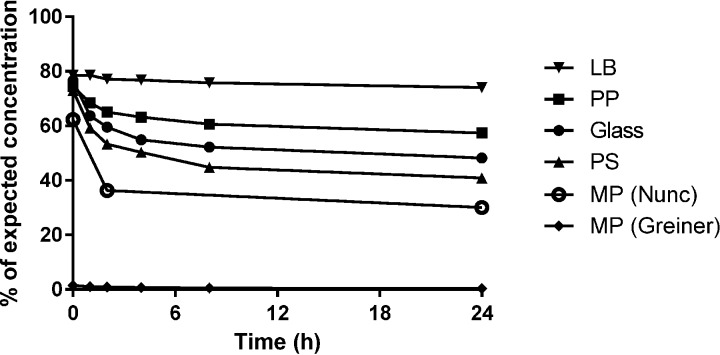
In summary, the cumulative loss from the stock solution down to the lowest concentrations after 24 h of incubation varied between materials and concentrations. The degree of colistin loss was lowest in the low-protein-binding polypropylene tubes, followed by the polypropylene, glass, and polystyrene large tubes and polystyrene microplates (Fig. 4).
FIG 4.
Summary of material performance over the whole concentration range. The mean percentages of expected concentrations were calculated for each material, regardless of the nominal concentration. Note that not all concentrations were analyzed in the Nunc microplates; adding the two skipped concentrations to the mean percentage would with high certainty lower the mean further.
DISCUSSION
We have shown that colistin is extensively lost during normal experimental conditions in a strong concentration- and material-dependent manner. Colistin appears to be lost in two situations: (i) during dilution steps when the solution is exposed to new surfaces, resulting in a lower start concentration than expected (with the percentage lost increasing with decreasing concentration), and (ii) over time in the experimental vessel as colistin adheres to the surface (Fig. 1 and 2). Thus, there seem to be three especially critical factors contributing to the final concentrations in the experiment vessel: (i) the number of dilution steps for the drug (i.e., the number of times the solution is exposed to new surfaces), (ii) the materials used in liquid handling, and (iii) the concentrations used. The concentration-time curves (Fig. 2) and Langmuir models (Fig. 3) imply that there is one main process, adsorption, that is responsible for the disappearance of colistin. Although degradation of colistin or loss of volume due to sampling (i.e., decreasing the volume/surface area) could be expected to influence the loss, inclusion of a linear function for degradation did not improve the curve fits in this study.
The materials used in experiments and sampling will have a major impact on the degree of colistin loss. In this study, the low-protein-binding polypropylene tubes showed the least adsorption, followed by standard polypropylene and glass. Unfortunately, polypropylene has a downside in microbiological applications, as it is slightly opalescent and thus is problematic when growth is assessed visually or by optical density, e.g., in MIC assays. However, plastics can also be obtained with various modifications; polypropylene can be manufactured to have low protein-binding capacity, as in the microtubes used in this study, or made clear to facilitate use with optical readers. Likewise, there are modifications and coatings for glass as well as for polystyrene, e.g., for different applications in cell culture, immunosorbent assays, etc. The possibilities are many, but information is generally sparse, and the different varieties of the basic materials may cause large differences in the level of adsorption, depending on manufacturing process (12). One must also not forget that pipette tips are most likely an additional source of loss due to adsorption; the current study setup, however, did not allow differentiation between the losses in pipette tips and in dilution tubes.
It is clear from the adsorption analysis that the polystyrene tubes used in this study bind colistin relatively strongly (with a high equilibrium constant) compared with the other materials and have a high binding capacity, whereas the glass tubes bind very weakly but have a very high binding capacity. It is likely that the concentrations tested were too low to get an accurate determination of the maximum binding capacity of glass. The polypropylene tubes, however, exhibit a low binding strength, which is the more important parameter of the two in an actual laboratory setting, as well as a moderate binding capacity.
The results of this study will have serious implications for in vitro experiments such as MIC determinations and an array of time-kill experiments, if it is assumed that the adsorption of colistin to the materials is not reversed by the presence of bacteria. If the presence of bacteria alters the dynamics of adsorption, the equilibrium would be shifted away from colistin adsorption to the vessel. However, there are some data available where colistin concentrations have been measured with bacteria present (10, 13), which suggest that this is not the case. It is therefore of utmost importance to further investigate these dynamics, especially as CLSI and EUCAST currently recommend that colistin MIC testing should be performed by broth microdilution in polystyrene microplates, which in our experiments bound more colistin than any other material tested and with a >10-fold difference between the two brands. It is also worth noting that the concentration dependency of the adsorption introduces a nonlinearity to the MIC tests. As the relative adsorption is higher (i.e., the fraction of nonadsorbed colistin is lower) at lower concentrations, the error in observed MIC increases with decreasing concentrations. This could account for a part of the differences between methods observed in comparative studies.
There have been some studies (9, 15, 16) on the effect of Tween 80, a common surfactant and dispersant, on MIC tests. The hypothesis is that Tween 80 inhibits the adsorption of colistin and keeps it in solution (14). However, the approach has three potential problems. First, a competitive displacement may reduce the adsorption of colistin, but the extent may not be sufficient and will be dependent on the concentration of colistin. Second, being a surfactant, Tween 80 may also have an antimicrobial effect of its own in these tests, as has been shown in prior studies (17–19). Third, although Tween 80 has a low intrinsic antimicrobial effect, it may interact synergistically with colistin, e.g., by forming mixed micelles (17–19). As the problem with adsorption of colistin can be mitigated by using materials with low-protein-binding properties, the potentially problematic use of Tween 80 seems unnecessary.
In pharmacokinetic studies, where the concentrations in fluids containing little or no protein are of interest (e.g., urine, dialysate, bronchoalveolar lavage fluids or, microdialysate fluids), the colistin concentration will appear to be lower than the actual concentration unless much care is taken to reduce the effect of adsorption. For example, Jansson et al. (4) showed that non-protein-containing samples, such as culture media, should be drawn directly to vials containing drug-free plasma or serum, which reduces the adsorption of colistin. The theory is that the plasma proteins are adsorbed to the vial, occupying the binding sites of colistin and thus minimizing the adsorption of colistin, equivalent to the competitive protein adsorption to a surface of serum proteins, i.e., the Vroman effect (20–23). Furthermore, the protein binding of colistin (approximately 50%) can shift the adsorption equilibrium in a manner similar to that discussed above for bacteria, reducing the amount of colistin that is available for adsorption to the vessel surface. Time-kill experiments and MIC tests are more difficult to correct for or modify, as addition of plasma or other additives to the experiments is not feasible due to protein binding and other potential unquantifiable interactions. In addition, if the nonlinear errors introduced by the concentration-dependent relative adsorption of colistin are left unaccounted for, they could affect the choice of best PK/PD index and target due to the mismatch between measured concentrations in vivo and actual concentrations in the MIC assay (24).
In conclusion, it is important to carefully monitor colistin concentrations during the time course of an experiment, especially where materials in which colistin adsorption has not fully been characterized are used, and some reported data (including MIC values) may need to be reevaluated. Furthermore, when diluting colistin, it is beneficial to minimize the number of steps in which the diluents come in contact with previously unexposed materials. Of the materials in this study, low-protein-binding polypropylene or standard polypropylene appears to be advantageous, whereas standard polystyrene is less so. Other materials that may perform better should be assessed in order to gain more accurate results for the antibacterial effect of colistin. In particular, it would be of utmost importance for routine clinical MIC testing of colistin to identify materials and brands (for pipette tips as well as vessels) that have the lowest feasible binding of colistin.
MATERIALS AND METHODS
Antibiotic dilutions.
Stock solutions (10,000 mg/liter free base) of colistin (Sigma-Aldrich, St. Louis, MO) were freshly prepared each day in filtered, sterile water. All further solutions were made in Mueller-Hinton broth with standardized content of Mg2+ and Ca2+ (Mueller-Hinton II broth; BD Biosciences, Franklin Lakes, NJ). All pipetting of colistin was performed with 200-μl polypropylene pipette tips (Sarstedt, Nümbrecht, Germany). The same pipette tips were used for all experiments. To study the potential loss of colistin by adsorption to labware, including pipette tips, two dilution approaches were compared in triplicate (Fig. 5): a serial dilution scheme and an incremental dilution scheme. Series of 1-ml 2-fold dilutions ranging from 12.5 to 800 mg/liter colistin (free base) were prepared in soda-glass tubes (5 ml; Sarstedt). Samples (100 μl) for concentration determination were drawn after completion of the dilution series. All tubes were vortexed briefly prior to sampling. The samples were added to polypropylene microtubes (1.5 ml; Sarstedt) containing 100 μl drug-free human serum. The samples and all stock solutions were frozen immediately (−70°C) to minimize additional loss prior to analysis. An incremental dilution scheme was used in all further experiments, with a final dilution step of 1:100 to minimize colistin loss.
FIG 5.
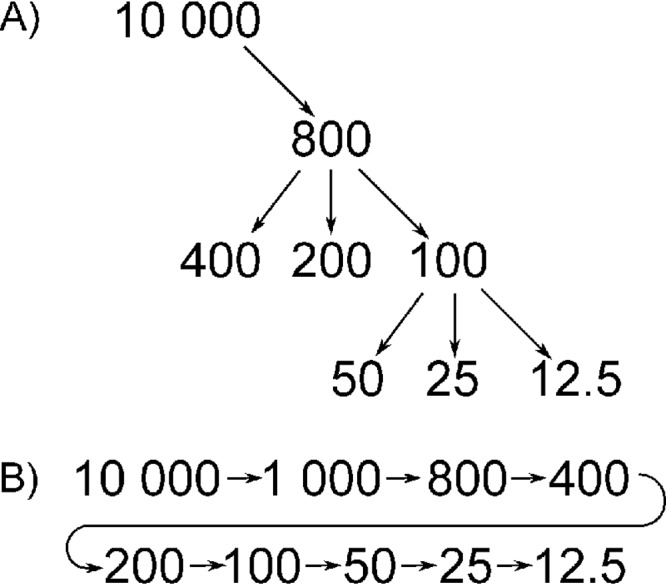
Schematic illustrations of the incremental dilution (A) and the serial dilution (B). Numbers indicate the colistin concentration (milligrams per liter) in each tube.
Experiments in large test tubes.
Three types of commonly used test tubes were studied: soda-lime glass (10 ml; Bergman Labora, Stockholm, Sweden), polypropylene (15-ml Falcon; BD), and polystyrene (10 ml; Nunc, Roskilde, Denmark). The volume of liquid in all tubes was 4 ml, and the tubes were incubated at 37°C for 24 h. Samples (200 μl) for concentration determination were drawn at 0, 1, 2, 4, 8, and 24 h. All tubes were vortexed briefly prior to sampling. The samples were added to polypropylene microtubes (1.5 ml; Sarstedt) containing 200 μl drug-free human serum. The samples were frozen immediately (−70°C) to minimize additional loss prior to analysis. All experiments were performed in triplicate.
Low-protein-binding microtubes.
Low-protein-binding polypropylene microtubes (1.5-ml Protein LoBind; Eppendorf, Hamburg, Germany) were studied as described above, with the exception of the volumes; the total volume in each tube was 1 ml, and the sample size was 100 μl. The tubes were incubated at 37°C for 24 h, and the samples for concentration determination were drawn at 0, 1, 2, 4, 8, and 24 h. All tubes were vortexed briefly prior to sampling. Samples were transferred to polypropylene microtubes containing 100 μl serum. The experiments were performed in triplicate.
Microplates.
Noncoated standard round-bottom polystyrene microplates from two different manufacturers (Nunc, Roskilde, Denmark, and Greiner Bio-One, Kremsmünster, Austria) were also evaluated. The volume in each well was 100 μl, and panels were prepared so that one well was emptied at each sampling. As in the previous experiments, the plates were incubated at 37°C for 24 h. The plates were not vortexed, but the contents were gently mixed by pipetting prior to drawing the sample. Samples were transferred to polypropylene microtubes containing 100 μl serum. The experiment was performed twice in the Greiner plate, with replicates at time points 0, 2, and 24 h to verify the extremely low concentrations measured, and once in the Nunc plate, at time points 0, 2, and 24 h (also excluding the concentrations of 2 and 0.125 μg/ml).
Concentration determination assay.
Samples were assayed with a previously described LC-MS/MS method (4). In brief, the frozen samples were thawed, protein was precipitated with acetonitrile (ACN) containing 0.1% trifluoroacetic acid (TFA), and the supernatants were diluted with 0.03% TFA. After this quick sample preparation step, 100 μl was loaded on an Ultrasphere Cl8 column with a mobile phase consisting of 25% ACN in 0.03% TFA and detected by tandem mass spectrometry. Within the concentration range in this study, the intraday CV was ≤11.4% and accuracy ranged from −2.4 to 8.1%. The lower limits of quantification for 100 μl medium-plasma mix were 24.2 and 13.2 μg/liter for colistins A and B, respectively. Samples with high concentrations (>25 mg/liter) were diluted in mobile phase as necessary.
Adsorption kinetics.
The adsorption kinetics (concentration-time profiles) were analyzed by fitting standard exponential one-phase and two-phase decay functions to the data using GraphPad Prism 6 (GraphPad Software, La Jolla, CA, USA), without constraints on the independent variables k (rate constant) and t (time). The model fits were compared to investigate whether the kinetics are best described by one-phase or two-phase kinetics, with the second taking into account a continuous intraexperiment colistin degradation or other disappearance of colistin, e.g., during sampling. Each material and concentration was analyzed separately, and the best-fitting function was determined by the extra sum-of-squares F test.
Adsorption equilibrium analysis.
The adsorption equilibrium was investigated to quantify binding capacities and binding strength differences between materials. The adsorbed amount of colistin per surface area of material in the large tubes at equilibrium (after 24 h) was calculated by subtracting the measured concentration at 24 h from the measured start concentration and dividing by the exposed surface area during the experiment. The area exposed during vortexing was excluded due to the short exposure time and the fact that the area could not be correctly estimated. The Langmuir adsorption model (20) was fitted to the resulting data. Briefly, this model describes a relationship between maximum adsorption and concentration of adsorbate (colistin) in the experiment, as follows: L = Lmax × (K × c)/(1 + K × c), where L is the adsorbed amount per surface area, Lmax is the maximum adsorption or full saturation, K is the Langmuir adsorption constant, and c is the tested concentration.
To investigate evidence for colistin degradation in the data, a modified Langmuir model with a linear degradation term (analogous to unspecific binding in receptor-ligand interaction studies) was also fitted to the data: L = Lmax × (K × c)/(1 + K × c) + N × c, where N is the degradation constant. The degradation constant was constrained to >0 μg/cm2, as colistin was not expected to form during experiments. For both models, the Lmax term was constrained to <10 μg/cm2, well above the observed maximum. The constraints were used to limit the solution space to physically possible solutions. The fits of the Langmuir and modified Langmuir models were compared for each material using the F test.
ACKNOWLEDGMENTS
This study was supported in part by Vinnova and the Swedish Foundation for Strategic Research.
We thank Britt Jansson for skillful technical assistance.
REFERENCES
- 1.Wertheim H, Van Nguyen K, Hara GL, Gelband H, Laxminarayan R, Mouton J, Cars O. 2013. Global survey of polymyxin use: a call for international guidelines. J Glob Antimicrob Resist 1:131–134. doi: 10.1016/j.jgar.2013.03.012. [DOI] [PMC free article] [PubMed] [Google Scholar]
- 2.Li J, Nation RL, Milne RW, Turnidge JD, Coulthard K. 2005. Evaluation of colistin as an agent against multi-resistant Gram-negative bacteria. Int J Antimicrob Agents 25:11–25. doi: 10.1016/j.ijantimicag.2004.10.001. [DOI] [PubMed] [Google Scholar]
- 3.Vaara M. 1992. Agents that increase the permeability of the outer membrane. Microbiol Rev 56:395–411. [DOI] [PMC free article] [PubMed] [Google Scholar]
- 4.Jansson B, Karvanen M, Cars O, Plachouras D, Friberg LE. 2009. Quantitative analysis of colistin A and colistin B in plasma and culture medium using a simple precipitation step followed by LC/MS/MS. J Pharm Biomed Anal 49:760–767. doi: 10.1016/j.jpba.2008.12.016. [DOI] [PubMed] [Google Scholar]
- 5.Matzneller P, Gobin P, Lackner E, Zeitlinger M. 2015. Feasibility of microdialysis for determination of protein binding and target site pharmacokinetics of colistin in vivo. J Clin Pharmacol 55:431–437. doi: 10.1002/jcph.419. [DOI] [PubMed] [Google Scholar]
- 6.Dudhani RV, Turnidge JD, Coulthard K, Milne RW, Rayner CR, Li J, Nation RL. 2010. Elucidation of the pharmacokinetic/pharmacodynamic determinant of colistin activity against Pseudomonas aeruginosa in murine thigh and lung infection models. Antimicrob Agents Chemother 54:1117–1124. doi: 10.1128/AAC.01114-09. [DOI] [PMC free article] [PubMed] [Google Scholar]
- 7.Karvanen M, Plachouras D, Friberg LE, Paramythiotou E, Papadomichelakis E, Karaiskos I, Tsangaris I, Armaganidis A, Cars O, Giamarellou H. 2013. Colistin methanesulfonate and colistin pharmacokinetics in critically ill patients receiving continuous venovenous hemodiafiltration. Antimicrob Agents Chemother 57:668–671. doi: 10.1128/AAC.00985-12. [DOI] [PMC free article] [PubMed] [Google Scholar]
- 8.Mohamed AF, Karaiskos I, Plachouras D, Karvanen M, Pontikis K, Jansson B, Papadomichelakis E, Antoniadou A, Giamarellou H, Armaganidis A, Cars O, Friberg LE. 2012. Application of a loading dose of colistin methanesulfonate in critically ill patients: population pharmacokinetics, protein binding, and prediction of bacterial kill. Antimicrob Agents Chemother 56:4241–4249. doi: 10.1128/AAC.06426-11. [DOI] [PMC free article] [PubMed] [Google Scholar]
- 9.Albur M, Noel A, Bowker K, Macgowan A. 2014. Colistin susceptibility testing: time for a review. J Antimicrob Chemother 69:1432–1434. doi: 10.1093/jac/dkt503. [DOI] [PubMed] [Google Scholar]
- 10.Mohamed AF, Cars O, Friberg LE. 2014. A pharmacokinetic/pharmacodynamic model developed for the effect of colistin on Pseudomonas aeruginosa in vitro with evaluation of population pharmacokinetic variability on simulated bacterial killing. J Antimicrob Chemother 69:1350–1361. doi: 10.1093/jac/dkt520. [DOI] [PubMed] [Google Scholar]
- 11.Cheah S-E, Wang J, Nguyen VTT, Turnidge JD, Li J, Nation RL. 2015. New pharmacokinetic/pharmacodynamic studies of systemically administered colistin against Pseudomonas aeruginosa and Acinetobacter baumannii in mouse thigh and lung infection models: smaller response in lung infection. J Antimicrob Chemother 70:3291–3297. doi: 10.1093/jac/dkv267. [DOI] [PubMed] [Google Scholar]
- 12.Humphries RM. 2015. Susceptibility testing of the polymyxins: where are we now? Pharmacotherapy 35:22–27. doi: 10.1002/phar.1505. [DOI] [PubMed] [Google Scholar]
- 13.Mohamed AF, Kristoffersson AN, Karvanen M, Nielsen EI, Cars O, Friberg LE. 2016. Dynamic interaction of colistin and meropenem on a WT and a resistant strain of Pseudomonas aeruginosa as quantified in a PK/PD model. J Antimicrob Chemother 71:1279–1290. doi: 10.1093/jac/dkv488. [DOI] [PubMed] [Google Scholar]
- 14.Jerke KH, Lee MJ, Humphries RM. 2016. Polymyxin susceptibility testing: a cold case reopened. Clin Microbiol Newsl 38:69–77. doi: 10.1016/j.clinmicnews.2016.04.003. [DOI] [Google Scholar]
- 15.Hindler JA, Humphries RM. 2013. Colistin MIC variability by method for contemporary clinical isolates of multidrug-resistant Gram-negative bacilli. J Clin Microbiol 51:1678–1684. doi: 10.1128/JCM.03385-12. [DOI] [PMC free article] [PubMed] [Google Scholar]
- 16.Sader HS, Rhomberg PR, Flamm RK, Jones RN. 2012. Use of a surfactant (polysorbate 80) to improve MIC susceptibility testing results for polymyxin B and colistin. Diagn Microbiol Infect Dis 74:412–414. doi: 10.1016/j.diagmicrobio.2012.08.025. [DOI] [PubMed] [Google Scholar]
- 17.Brown MR, Winsley BE. 1968. Synergistic action of polysorbate 80 and polymyxin B sulphate on Pseudomonas aeruginosa. J Gen Microbiol 50:Suppl:ix. [PubMed] [Google Scholar]
- 18.Brown MR, Geaton EM, Gilbert P. 1979. Additivity of action between polysorbate 80 and polymyxin B towards spheroplasts of Pseudomonas aeruginosa NCTC 6750. J Pharm Pharmacol 31:168–170. doi: 10.1111/j.2042-7158.1979.tb13463.x. [DOI] [PubMed] [Google Scholar]
- 19.Suling WJ, O'Leary WM. 1975. Effect of surfactants on antibiotic resistance. Antimicrob Agents Chemother 8:334–343. doi: 10.1128/AAC.8.3.334. [DOI] [PMC free article] [PubMed] [Google Scholar]
- 20.Norde W. 1986. Adsorption of proteins from solution at the solid-liquid interface. Adv Colloid Interface Sci 25:267–340. doi: 10.1016/0001-8686(86)80012-4. [DOI] [PubMed] [Google Scholar]
- 21.Stuart MA, Fleer GJ, Lyklema J, Norde W, Scheutjens JM. 1991. Adsorption of ions, polyelectrolytes and proteins. Adv Colloid Interface Sci 34:477–535. doi: 10.1016/0001-8686(91)80056-P. [DOI] [PubMed] [Google Scholar]
- 22.Norde W, Lyklema J. 1991. Why proteins prefer interfaces. J Biomater Sci Polym Ed 2:183–202. doi: 10.1080/09205063.1991.9756659. [DOI] [PubMed] [Google Scholar]
- 23.Jung S-Y, Lim S-M, Albertorio F, Kim G, Gurau MC, Yang RD, Holden MA, Cremer PS. 2003. The Vroman effect: a molecular level description of fibrinogen displacement. J Am Chem Soc 125:12782–12786. doi: 10.1021/ja037263o. [DOI] [PubMed] [Google Scholar]
- 24.Khan DD, Friberg LE, Nielsen EI. 2016. A pharmacokinetic-pharmacodynamic (PKPD) model based on in vitro time-kill data predicts the in vivo PK/PD index of colistin. J Antimicrob Chemother 71:1881–1884. doi: 10.1093/jac/dkw057. [DOI] [PubMed] [Google Scholar]


