. 2017 Oct 24;6:e29914. doi: 10.7554/eLife.29914

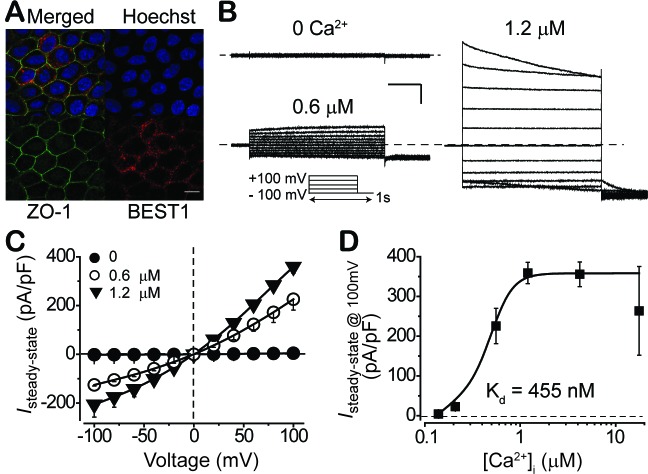
Figure 1. Subcellular localization of BEST1 and surface Ca2+-dependent Cl- current in BEST1 WT donor iPSC-RPEs.

(A) Confocal images showing plasma membrane localization of BEST1. Scale bar, 10 μm. (B) Representative current traces recorded from a BEST1 WT donor iPSC-RPEs at various free [Ca2+]i. Voltage protocol used to elicit currents is shown in Insert. Scale bar, 1 nA, 150 ms. (C) Population steady-state current-voltage relationships at different free [Ca2+]i; n = 5–6 for each point. The plot was fitted to the Hill equation. (D) Ca2+-dependent activation of surface current. Steady-state current density recorded at +100 mV plotted vs. free [Ca2+]i; n = 5–6 for each point. See also Figure 1—figure supplements 1 and Figure 1—source data 1.

Figure 1—source data 1. Comparison of different data sets from the same donors.
Ca2+-dependent Cl- current amplitudes in two clonal iPSC-RPEs (for WT and I201T) or iPSC-RPEs generated by two different sets of differentiations (for P274R) from the same donors. n = 5–6 for each data set. Diff: differentiation.
DOI: 10.7554/eLife.29914.005

Figure 1.

Figure 1—figure supplement 1. Characterization of WT iPSC and iPSC-RPE.
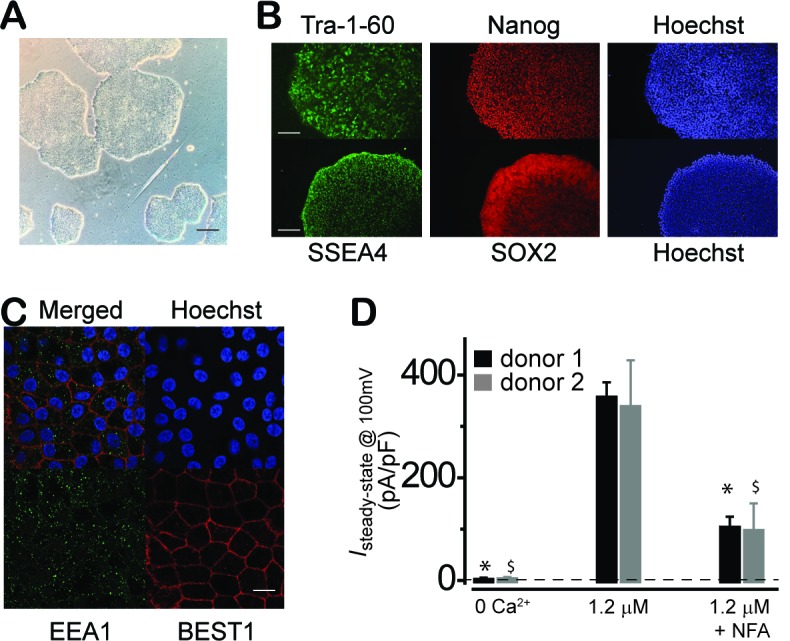
Figure 1—figure supplement 1.

(A) Phase picture of established WT iPSC line before differentiation. Scale bar, 400 μm. (B) Immunocytofluorescence images of pluripotency markers in established iPSC. Scale bar, 200 μm. (C) Confocal images showing plasma membrane localization of BEST1. Scale bar, 10 μm. (D) Comparison of current amplitudes in iPSC-RPEs from two BEST1 WT donors. Bar chart showing the steady-state current amplitudes at 0 [Ca2+]i, 1.2 μM [Ca2+]i, and 1.2 μM [Ca2+]i + 100 μM NFA in RPEs from two distinct BEST1 WT human donors; n = 5–6. ∗$p<0.05 compared to current amplitudes at 1.2 μM [Ca2+]i from donor #1 and #2, respectively, using two-tailed unpaired Student t test.