. 2017 Oct 24;6:e29914. doi: 10.7554/eLife.29914

Figure 6. Patient mutations in a BEST1 homology model.

(A) Left, ribbon diagram of the BEST1 pentamer with each protomer colored differently, as viewed from the side. Right, ribbon diagram of two oppositely facing (144°) protomers of a BEST1 pentamer are shown with the extracellular side on the top. The side chains of critical residues are in red. (B) Location of the patient mutations in relationship to the channel pore. Left, as viewed from the side; right, from inside the plasma membrane. (C) Visualization of the location of I201T. The side chains of critical residues are in red. See also Figure 6—figure supplements 1 and 2.
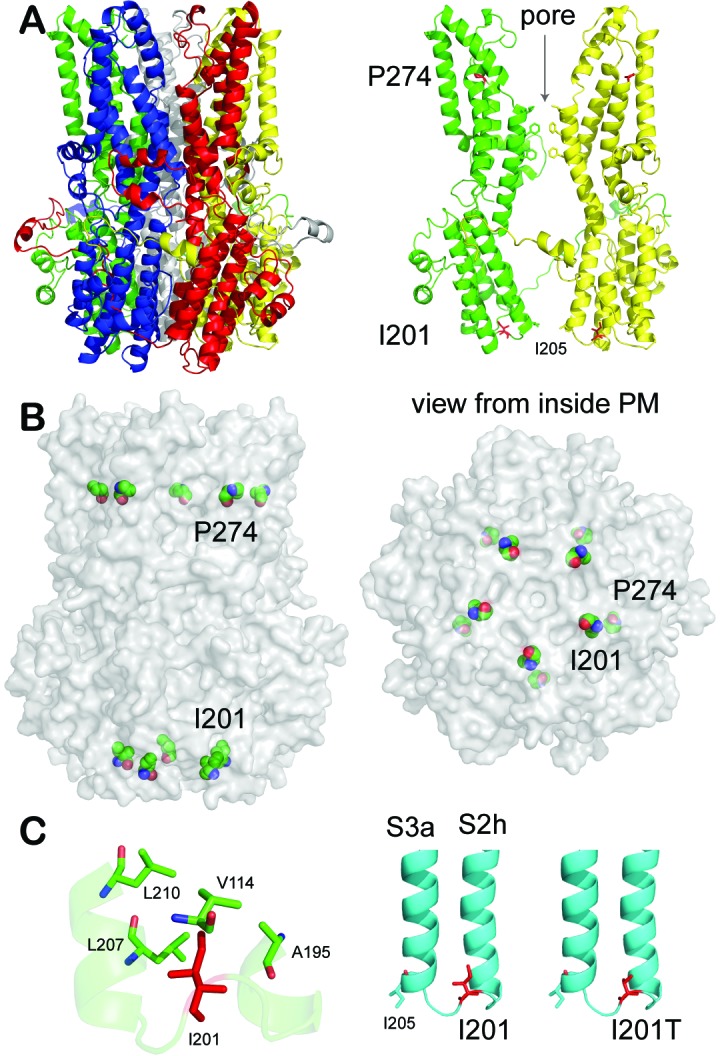
Figure 6.

Figure 6—figure supplement 1. Structural analysis of BEST1 mutations in a homology model.
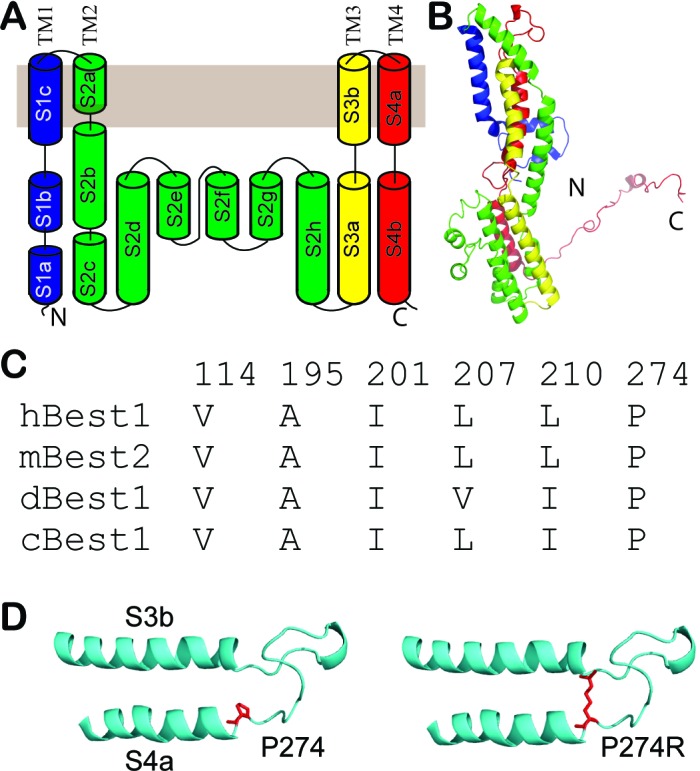
Figure 6—figure supplement 1.

(A) 2D topology of a human BEST1 protomer, colored spectrally from blue at its N-terminal segment to red at its C-terminal segment. (B) Ribbon diagram of a human BEST1 protomer. Colored as in A. (C) Critical residues in hBest1 (BEST1), mBest2 (mouse bestrohpin2), dBest1 (Drosophila melanogaster bestrophin1) and cBest1 (chicken bestrophin1). Numbers showing the positions of residues in hBest1. (D) Visualization of P274 and the predicted steric clash by the P274R mutation. The side chains of critical residues are in red.
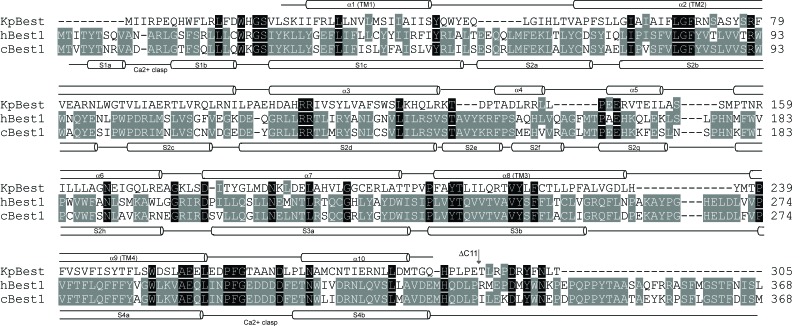
Figure 6—figure supplement 2. Structure-based sequence alignment of KpBest, hBest1 and cBest1.

Figure 6—figure supplement 2.

The KpBest structure has been used to restrict sequence gaps to inter-helical segments. Black background, identical residues in all three sequences; grey background, identical residues in two sequences. The secondary structures of KpBest and cBest1 are labeled above and underneath the sequences, respectively.