. 2017 Oct 24;6:e31054. doi: 10.7554/eLife.31054

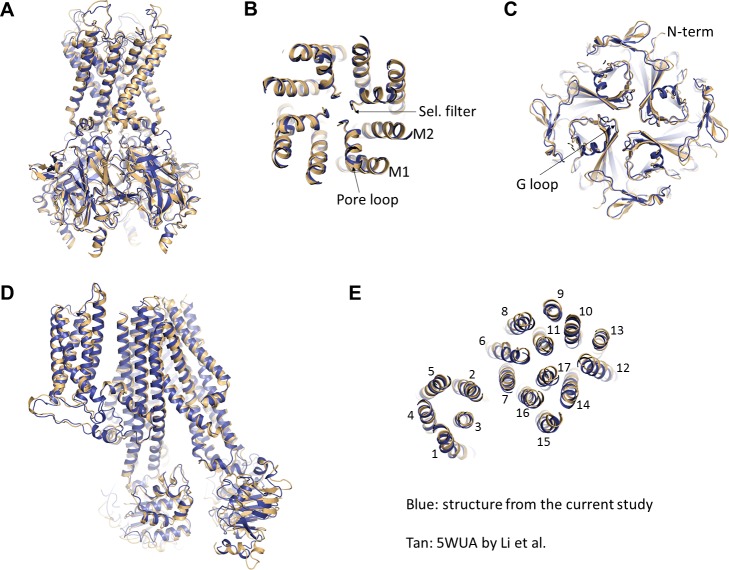
Figure 8. Comparison of the current structure with the GBC-bound, ATP-free structure from Li et al.(PDB ID: 5WUA).

(A) Overlay of the Kir6.2 structure viewed on the side. (B) Overlay of the Kir6.2 membrane helices viewed from the top. (C) Overlay of the Kir6.2 cytoplasmic domain. (D) Side view of the overlay of the SUR1 structure. (E) Overlay of the SUR1 transmembrane helices 1–17 viewed from the top. In all panels, the higher resolution structure from the current study is colored in blue, and the 5WUA structure from Li et al. is colored in tan.

Figure 8.

Figure 8—figure supplement 1. Reinterpretation of the GBC cryo-EM density proposed in Li et al.
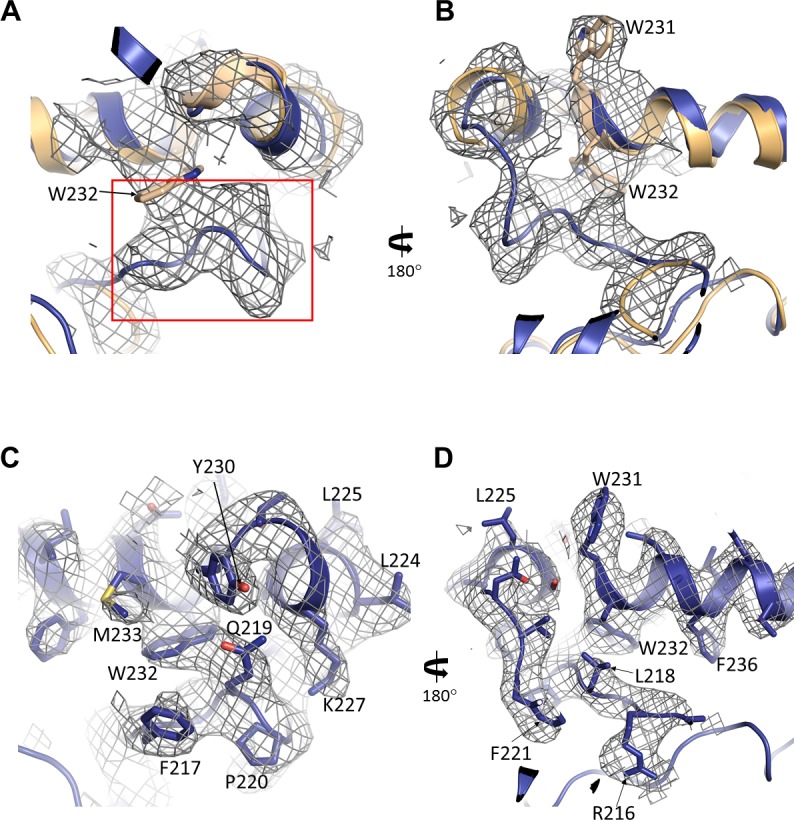
Figure 8—figure supplement 1.

(A, B) Cryo-EM density of 5WUA near SUR1-L0 where GBC binding site was proposed (approximately the boxed region shown in A). Note only W231 and W232 of SUR1-L0 were modeled in the density shown. (C, D) Cryo-EM density from the current study and the corresponding structural model in the same region shown in (A) and (B).
Figure 8—figure supplement 2. Cryo-EM density that likely corresponds to GBC in previously published KATP channel structures.

Figure 8—figure supplement 2.

(A) Cryo-EM density of 5TWV near the GBC binding site identified in the present study. (B) Cryo-EM density of 5WUA near the GBC binding site identified in the current study. In both (A) and (B), unassigned density with shape and size that can accommodate GBC is observed.