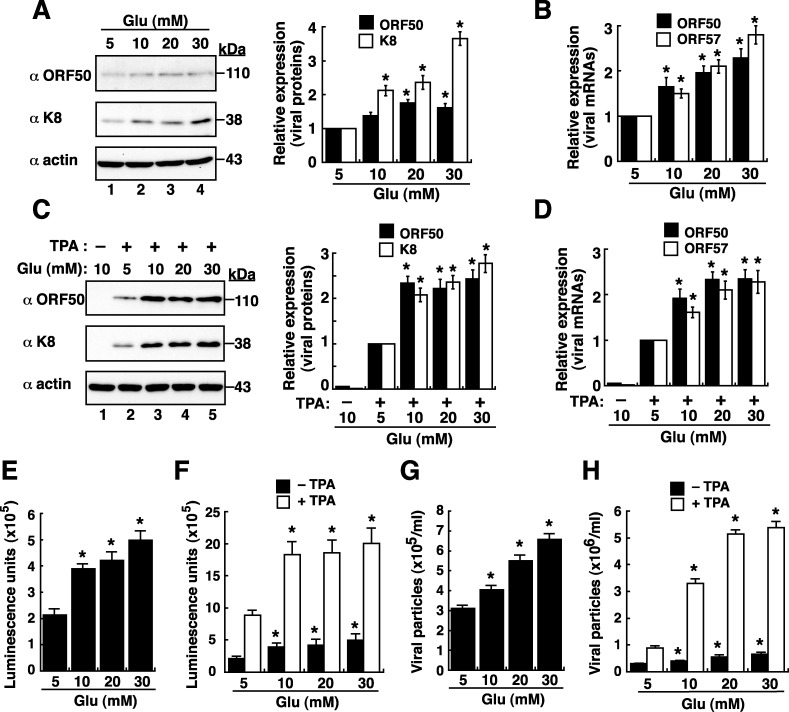
Figure 1. High glucose enhances lytic reactivation of KSHV in BCBL1 cells.
(A) Western blot analysis of viral lytic protein expression in BCBL1 cells that were cultured in various glucose concentrations for 48 hours. Relative expression levels of ORF50 and K8, normalized to β-actin, in BCBL1 cells were shown in the right panel (n=3). (B) Quantitative examination of ORF50 and ORF57 mRNAs in BCBL1 cells exposed to different glucose concentrations. Relative levels of ORF50 and ORF57 mRNAs, normalized to the GAPDH mRNA, were determined (n=3). (C) Western blot analysis of viral lytic protein expression in BCBL1 cells after treatment with TPA (15 ng/ml) and glucose at various concentrations for 48 hours. Relative expression levels of ORF50 and K8, normalized to β-actin, in BCBL1 cells were shown (right panel, n=3). (D) Expression of ORF50 and ORF57 mRNAs in BCBL1 cells after treatment with TPA (15 ng/ml) and glucose at various concentrations for 48 hours (n= 3). (E and F) Activation of the ORF50 promoter (ORF50p)-driven luciferase reporter by high glucose in BCBL1 cells in the absence or presence of TPA (n=3). The reporter plasmid pORF50p(−3801/+10) was used in transfection, and the transfected cells were cultured in different glucose concentrations in the absence or presence of TPA for 48 hours. Luciferase reporter assays were performed as described in Materials and Methods. (G and H) Virus particles released from BCBL1 cells after exposure to different glucose concentrations without or with TPA for 3 days (n=3). Data are presented as mean ± SEM. Symbol * indicates significant difference vs. the normal glucose treatment (P < 0.05).

