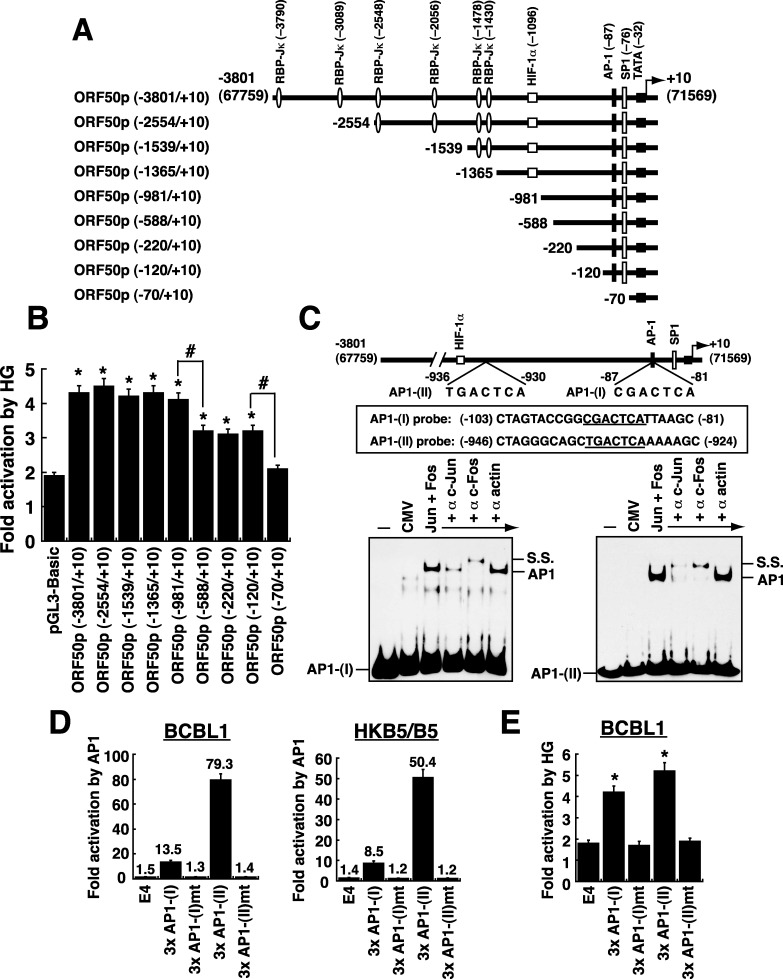
Figure 4. Defining the critical response elements in the ORF50 promoter to high glucose.
(A) Schematic diagram of ORF50p deletion reporter constructs. Several known binding sites for transcription factors such as RBP-Jκ, HIF-1α, AP-1 and SP1 in the ORF50 promoter are shown in the diagram. (B) Responsiveness of the ORF50p deletions to high glucose. BCBL1 cells were transfected with the indicated reporter plasmids, and then the transfected cells were cultured in normal or high glucose (20 mM). The fold activation of each reporter plasmid that responds to high glucose was calculated as described in Materials and Methods. Data are indicated as mean ± SEM (n=4). Symbol * represents significant difference vs. pGL3-Basic, and symbol # represents significant difference vs. the indicated deletion constructs (P < 0.05). (C) Direct binding of AP1 protein complex (c-Jun and c-Fos) to AP1-(I) element and AP1-(II) element. EMSA experiments were performed using protein extracts of 293T cells transfected with empty vector or transfected with plasmids expressing c-Jun and c-Fos. Antibodies to c-Jun and c-Fos were used to supershift or remove the formed complex. The AP1-specific complex and the supershifted (SS) complex are indicated. (D) Activation of AP1-(I)- and AP1-(II)-containing reporter constructs by AP1 protein complex (n=3). The reporter plasmids containing 3 copies of the wild-type or mutated AP1-(I) element or AP1-(II) element were individually cotransfected with plasmids expressing c-Jun and c-Fos into BCBL1 cells or HKB5/B5 cells. Luciferase activity in these transfected cells was measured 24 hours after transfection. (E) Responsiveness of the AP1-(I) and AP1-(II) elements to high glucose in BCBL1 cells. Transient reporter assay was performed in BCBL1 cells that were transfected with the indicated reporter plasmids. After the transfected cells were cultured in either normal glucose or high glucose (20 mM) for 48 hours, the response of each reporter construct to high glucose was determined. Data are represented as mean ± SEM (n=4). Symbol * represents significant difference vs. pE4luc (P < 0.05).

