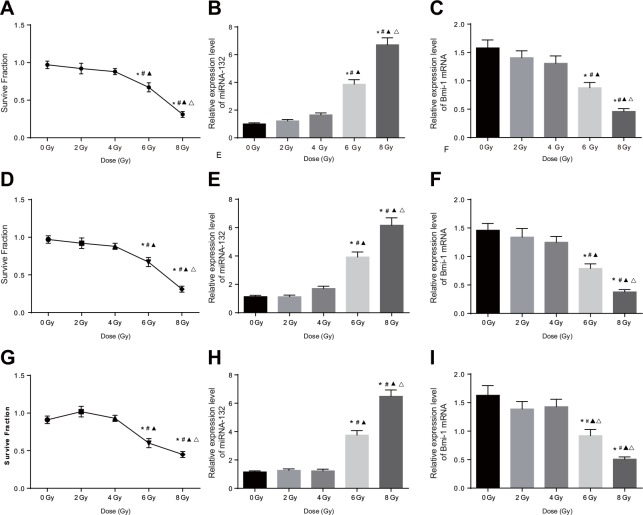
Figure 3. Comparison of miRNA-132 and Bmi-1 expression in CC cells after different radiation doses.
(A) A HeLa cell survival curve was drawn based on the results of colony formation assays. (B) Correlation between miR-132 expression and radiation dose in HeLa cells. (C) Correlation between Bmi-1 mRNA expression and radiation dose in HeLa cells. (D) A SiHa cell survival curve was drawn based on the results of colony formation assays. (E) Correlation between miR-132 expression and radiation dose in SiHa cells. (F) Correlation between Bmi-1 mRNA expression via and radiation dose in SiHa cells. (G) A C33A cell survival curve was drawn based on the result of colony formation assays. (H) Correlation between miR-132 expression and radiation dose in C33A cells. (I) Correlation between Bmi-1 mRNA expression and radiation dose in C33A cells. *P < 0.05 compared to the 0 Gy dose; #P < 0.05 compared to the 2 Gy dose; ▲P < 0.05 compared to the 4 Gy dose; ΔP < 0.05 compared to the 6 Gy dose.

