

Abstract
SG2NA belongs to a three-member striatin subfamily of WD40 repeat superfamily of proteins. It has multiple protein-protein interaction domains involved in assembling supramolecular signaling complexes. Earlier, we had demonstrated that there are at least five variants of SG2NA generated by alternative splicing, intron retention, and RNA editing. Such versatile and dynamic mode of regulation implicates it in tissue development. In order to shed light on its role in cell physiology, total proteome analysis was performed in NIH3T3 cells depleted of 78 kDa SG2NA, the only isoform expressing therein. A number of ER stress markers were among those modulated after knockdown of SG2NA. In cells treated with the ER stressors thapsigargin and tunicamycin, expression of SG2NA was increased at both mRNA and protein levels. The increased level of SG2NA was primarily in the mitochondria and the microsomes. A mouse injected with thapsigargin also had an increase in SG2NA in the liver but not in the brain. Cell cycle analysis suggested that while loss of SG2NA reduces the level of cyclin D1 and retains a population of cells in the G1 phase, concurrent ER stress facilitates their exit from G1 and traverse through subsequent phases with concomitant cell death. Thus, SG2NA is a component of intrinsic regulatory pathways that maintains ER homeostasis.
Electronic supplementary material
The online version of this article (doi:10.1007/s12192-017-0816-7) contains supplementary material, which is available to authorized users.
Keywords: SG2NA, Striatin, STRIPAK, ER stress, Cell cycle
Introduction
Striatin, SG2NA, and zinedin belong to a three-member subfamily of WD40 repeat superfamily of proteins. The prototype member of the family is striatin, and all three are quite close in their structures and functions. Their primary identity is the presence of multiple repeats of ~40 minimally conserved amino acids named “WD40 repeats” at the carboxyl termini. Structural study suggests that the repeating WD40 units form a circular, propeller-like arrangement with seven blades made up of β sheets, providing a scaffolding platform for interaction between multiple proteins. Members of the WD40 repeat family have been attributed to biological functions as diverse as RNA binding (Cuchalová et al. 2010), DNA replication (Shen et al. 2010), epigenetic regulation (Chan and Zhang 2012), cell signaling (Ritterhoff et al. 2010), autophagy (Boada-Romero et al. 2016), and apoptosis (Hwangbo et al. 2016). A large number of WD40 proteins with diverse functions have been found in mammals, plants, Drosophila, C aenorhabditis elegans, yeasts, and prokaryotes (Miller et al. 2015; Zhang and Zhang 2015).
Besides the WD40 repeats present in the carboxyl terminus, striatin/SG2NAs also harbor a caveolin-binding motif, a coiled-coiled structure, and a calmodulin binding domain in their amino terminus (Benoist et al. 2006). Unlike the other WD40 repeat proteins that are widely occurring, members of the striatin family are absent in plants and prokaryotes (Tanti et al. 2014). Over the past decade, several proteins have been reported to be interacting with striatin and SG2NA. Noticeable among them are estrogen receptor alpha (Lu et al. 2004), antioxidant protein DJ-1 (Tanti and Goswami 2014), phocein (Baillat et al. 2001), subunit A of protein phosphatase 2A (Moreno et al. 2000; Chen et al. 2014), tumor suppressor APC (Breitman et al. 2008), caveolin 1 (Gaillard et al. 2006), and Mst3 (Gordon et al. 2011).
SG2NA was first characterized as a nuclear autoantigen from a cancer patient whose expression is upregulated during S to G2 phases of the cell cycle and named accordingly (Landberg and Tan 1994; Muro et al. 1995). Subsequent studies established its structural and functional relatedness to striatin. We first demonstrated that SG2NA has at least six isoforms generated by alternative splicing and messenger RNA (mRNA) editing (Sanghamitra et al. 2008; Jain et al. 2015). Profiles of expression of isoforms of SG2NA vary among tissues and cultured cells (Tanti and Goswami 2014; Jain et al. 2015). SG2NA variants show a high degree of conservation of sequence motifs, and their structures are quite overlapping as well as distinctive (Soni et al. 2014). They are thus expected to have similar but distinct function. Downregulation of 78- and 82-kDa SG2NAs in Neuro 2A cells by short hairpin RNA (shRNA) makes it susceptible to oxidative stress (Tanti and Goswami 2014).
In the past several years, it has emerged that striatin/SG2NAs are the constituents of a multiprotein assembly called striatin-interacting phosphatase and kinase (STRIPAK). These supramolecular structures are involved in various signaling events including those involving Hippo, nuclear receptors, and cytoskeleton. STRIPAKs are the major regulators of cell cycle, differentiation, metabolism, immune regulation, Golgi assembly, cell polarity, cell migration, neural and vascular development, cardiac function, etc. (Hwang and Pallas 2014). Dysregulation of STRIPAK complexes has a role in diseases like cancer, diabetes, autism, and cerebral cavernous malformation (Hwang and Pallas 2014; Shi et al. 2016). STRIPAK complexes are conserved in evolution and have been studied in the context of development of innate immunity, neuronal morphogenesis, and circadian oscillation in Drosophila (Sakuma et al. 2015; Andreazza et al. 2015; Liu et al. 2016); germline stem cell maintenance in C elegans (Maheshwari et al. 2016); fungal development (Kück et al. 2016); and mitotic progression in yeast (Frost et al. 2012). Considering the existence of multiple isoforms of SG2NA with several modes of their regulation (Jain et al. 2015) vis-à-vis such diverse functions of STRIPAK, variants of SG2NA are likely to have multiple concurrent functions.
We have recently demonstrated that under oxidative stress, SG2NA recruits DJ-1 and Akt to plasma membrane and mitochondria, protecting cells from injury (Tanti and Goswami 2014), and also has a role in cancer cell survival (Tanti et al. 2015). Variants of SG2NA are also localized in the endoplasmic reticulum (ER) and nucleus, but its functional relevance has not been explored ((Tanti and Goswami 2014; unpublished results). The endoplasmic reticulum plays a major role in protein synthesis, its modifications, Ca++, and lipid signaling. It is the largest organelle with microdomains contacting the Golgi and the mitochondria (Phillips and Voeltz 2016). Perturbation of ER function leads to stress that contributes to various diseases. In this study, we demonstrate that in NIH3T3 cells, shRNA-induced loss of SG2NA leads to the induction of ER stress. When cells were treated with the ER stressors thapsigargin (TG) and tunicamycin (TM), expression of SG2NA increased both in vitro and in vivo. Also, cells with a lower level of SG2NA are susceptible to apoptosis upon treatment with TM and TG. We thus demonstrate for the first time that SG2NA is involved in maintaining ER homeostasis.
Materials and methods
Reagents
Thapsigargin (TG, T9033), tunicamycin (TM, T7765), MTT reagent (M5655), Hoechst 33342 stain, and propidium iodide (PI, P4170) were purchased from Sigma-Aldrich, USA. Mouse monoclonal antibody for SG2NA (STRN3, MA1-46461) was purchased from Thermo Fisher Scientific, USA. Antibodies for GRP78 (C50B12) HSP90B and vimentin (5741S) were purchased from Cell Signaling, USA. Antibodies for PKM2 (sab4200095) and β-actin (A1978) were from Sigma-Aldrich, USA. Cyclin D1 (DCS-6 sc20044), cyclin D3 (sc6283 HRP), and horseradish peroxidase-conjugated goat anti-mouse (sc-2005) and goat anti-rabbit (sc-2004) antibodies were from Santa Cruz Biotechnology, USA.
Cell culture
Mouse fibroblast cells NIH3T3 and cells derived from it by stably transfecting shRNA against Sg2na were cultured in DMEM (Sigma-Aldrich, USA) supplemented with 10% FBS (Gibco, USA), 1% antibiotics [Pen-Strep and Amphotericin B (Sigma-Aldrich, USA)]. Cells were maintained at 37 °C temperature and 5% CO2 in a humidified incubator. For induction of endoplasmic reticulum stress, cells were treated with TG (1 and 2 μM) and TM (1 and 5 μg/ml) for indicated time periods. For glucose starvation, cells were grown in 1 mM (low), 5 mM (moderate), and 25 mM (high) glucose containing media.
Animals
Male BALB/c mice were used for the study. For TG treatment, a 2-month-old mouse was intraperitoneally injected with 1 μg/g of body weight. After 24 h, brain and liver tissues were harvested and total lysates were prepared in lysis buffer (50 mM Tris pH 7.6, 400 mM NaCl, 1 mM EDTA, 1 mM EGTA, 1% NP-40, 1 mM sodium orthovanadate, 10 mM sodium fluoride, protease inhibitor cocktail, and 1 mM PMSF) for western analysis. The use of animals was according to the approved protocol of the Animal Ethics committee, Jawaharlal Nehru University, New Delhi.
Quantitative RT-PCR
Total RNA was isolated using TRI reagent (T9424, Sigma-Aldrich, USA). Complementary DNA (cDNA) was synthesized from 1 μg of RNA using Verso cDNA Kit (AB1453A, Thermo Fisher Scientific, USA). Quantitative RT-PCR analysis for Sg2na, grp78, chop, atf4, pdia3, and grp94 was performed in 20 μl volume using 1× SYBR Green Master Mix (Applied Biosystems, USA). 18s rRNA was used as internal control for normalization. The normalized values were expressed as relative quantity of gene-specific mRNA. The primers used are listed in Supplemental Table 1.
Western blotting
Cells were lysed in RIPA buffer (50 mM Tris-HCl pH 7.4, 150 mM NaCl, 1 mM EDTA, 1% Triton X-100, 1% sodium deoxycholate, 0.1% SDS, 1 mM PMSF containing 1% protease inhibitor and phosphatase inhibitors), and supernatant was collected after centrifugation. Protein concentration was estimated by Bradford assay. For western analysis, 50 μg of total protein lysates was resolved on 10% SDS-PAGE and transferred from gel to PVDF membrane by electroblotting in Towbin Buffer (25 mM Tris, 192 mM glycine, and 20% methanol). To avoid nonspecific binding, membrane was incubated in 5% BSA in 0.05% TBST at room temperature for 2 h. After blocking, primary antibody was added and kept overnight at 4 °C, washed, and incubated in HRP-conjugated secondary antibody. Chemiluminescence was captured on an x-ray film after using HRP substrates, i.e., luminol, coumaric acid, and H2O2.
Subcellular fractionation
Cells were washed with ice-cold PBS, scrapped, and harvested by centrifugation at 200×g for 7 min. The pellet was resuspended in an isotonic solution containing 250 mM sucrose, 10 mM HEPES [4-(2-hydroxyethyl)-1-piperazineethanesulfonic acid]-Tris pH 7.4, and 1 mM ethylene glycol-bis(2-aminoethylether)-tetraacetic acid (EGTA)-Tris and again centrifuged at 200×g for 7 min. The pellet was resuspended in a hypotonic solution (2 ml) containing 100 mM sucrose, 10 mM HEPES-Tris, and 1 mM EGTA. The cells were homogenized using a Dounce homogenizer. The extent of homogenization was monitored under a microscope. The hypotonic solution was made isotonic by addition of hypertonic solution (1.96 ml) of 1.78 M sucrose, 10 mM HEPES-Tris pH 7.4, 1 mM EGTA-Tris, and 2 mM MgCl2. The resulting isotonic solution with cells in it was centrifuged at 200×g for 10 min to obtain the nuclear pellet, followed by centrifugation at 300×g for 10 min, 5000×g for 10 min, and 100,000×g for 1 h to obtain post-nuclear pellet, mitochondrial pellet, and microsomal pellet, respectively. The supernatant obtained was saved as cytosolic fraction. These fractions were further enriched using OptiPrep density gradient medium (60% iodixanol solution, Sigma, #D1556) as per the manufacturer’s protocol.
Immunocytochemistry
Cells were grown on coverslips in 35-mm dishes. Cells were washed twice with phosphate-buffered saline (PBS) and fixed with ice-cold methanol and acetone (1:1) for 20 min at room temperature. After fixation, fixative solution was aspirated and fixed cells were washed twice with PBS, and incubated with blocking buffer (1% BSA and 1% FBS in 1× PBS containing 0.1% Triton X-100) for 1 h at room temperature. Cells were washed thrice with PBS. Next, cells were incubated with mouse monoclonal anti-SG2NA (1:300 in blocking solution) as the primary antibody overnight at 4 °C in a humid chamber and the next day for 1/2 h at room temperature. Coverslips were subjected to three washes of 5 min each in PBS and then incubated with a secondary antibody (Alexa Fluor 488-labeled goat anti-mouse IgG (Invitrogen)) diluted in blocking solution for 1 h at room temperature. Cells were washed thrice in PBS (5 min each) and incubated with ER-Tracker dye (ER-Tracker Red E34250 (Invitrogen)) for 15 min. Cells were washed twice with PBS and then stained with 1 μg/ml Hoechst 33342 in PBS for 30 min. Samples were again washed for two times in PBS, and then mounted in 10% glycerol. Images were obtained with a fluorescence microscope at ×60 magnification.
Measurement of cell viability by MTT assay
Cell viability after glucose starvation and TG and TM treatments were assayed by measuring the reduction of tetrazolium dye MTT (3-(4,5-dimethyl-2-thiazolyl)-2,5-diphenyl-2H-tetrazolium bromide) into a formazan crystal by the mitochondrial NADPH-dependent cellular oxidoreductase enzyme. After treatment for the indicated duration, cells were incubated with MTT (0.5 mg/ml) at 37 °C for 2 h in DMEM. Media were aspirated, and formazan crystals were solubilized in 500 μl of 90% isopropanol. Absorbance was measured at 570 nm using a multi-well plate reader (Varioskan Flash from Thermo Scientific, USA).
Hoechst 33342 and propidium iodide staining
For dual staining with Hoechst and propidium Iodide (PI), 24 h post treatment with TG and TM, cells were washed with 1× PBS and incubated with Hoechst 33342 (1:300 dilution in PBS). After 10 min, cells were washed with PBS, treated with PI at a concentration of 100 μg/ml for 10 min, and again washed with PBS and observed under fluorescence microscope. The cells stained more intensely with Hoechst only are live cells with apoptotic nuclei, cells stained with PI only are dead cells with normal nuclei, and dual-stained cells are dead cells with apoptotic nuclei (Liu et al. 2012; Syed Abdul Rahman et al. 2013).
Cell cycle analysis
The assessment of different phases of the cell cycle was done by PI staining of DNA content followed by flow cytometry. Cells were harvested by centrifugation at 1000 rpm for 10 min, washed with cold PBS, fixed in cold 70% ethanol, and stored in −20 °C overnight. The next day, cells were centrifuged, incubated in 100 μl PBS containing PI (50 μg/ml) and RNase A (1 mg/ml) for 20 min, and analyzed by flow cytometry system (BD FACSCalibur 4CB).
2D electrophoresis
The lysate was precipitated in ice-cold acetone (1 vol lysate/10 vol acetone) and was kept at −20 °C overnight. The precipitate was centrifuged at 15,000 rpm for 10 min, and the pellet was washed twice with ice-cold acetone. The final pellet was dried and suspended in lysis buffer (8 M urea, 2.5 M thiourea, and 3% CHAPS). After protein estimation, a total of 500 μg protein was resuspended in rehydration buffer (7 M urea, 2 M thiourea, 1.2% CHAPS, and 20 mM DTT) in a 350-μl volume along with IPG buffer and rehydrated on an IPG strip for 18 h. Isoelectric focusing was done using IPGphor unit with IPG gel strips (18 cm, pH 3–10 GE Healthcare, Sweden). After equilibrating the strips with DTT and iodoacetamide in equilibration buffer (50 mM Tris-Cl pH 8, 6 M urea, 30% glycerol, 2% SDS with Bromophenol Blue), the strip was run on 12% SDS-PAGE using an Ettan DALTsix electrophoresis system (GE Healthcare, Sweden).
Silver staining
After separation of proteins in 2D, the gels were kept overnight in fixing solution (50% methanol, 12% glacial acetic acid, and 0.05% formalin). After washing in 20% methanol for 20 min, gels were sensitized for 2 min in 0.02% sodium thiosulfate, stained with 0.2% AgNO3 with 0.075% formaldehyde for 20 min, and then developed in 6% Na2CO3, 0.050% formaldehyde, and 0.004% sodium thiosulfate. As the color started appearing, the reaction was stopped with 12% glacial acetic acid. Gels were stored in water at 4 °C until further analysis.
Image analysis
The stained gels were scanned, and the differential expression of proteins was analyzed by using SameSpots software from TotalLab, UK.
Peptide mass fingerprinting
The modulated protein spots between two gels were excised. The gel pieces were then washed thrice in HPLC-grade water and destained in 30 mM potassium ferricyanide and 100 mM sodium thiosulfate. The gel spots were then washed with water until the yellow color disappears. Gels pieces were then incubated in water/10 mM ammonium bicarbonate/acetonitrile solution ([AcN]; 2:1:1 vol/vol) for 15 min. After removing this solution, gels were rehydrated in 10 mM ammonium bicarbonate for 5 min. Then, an equal volume of AcN was added. After 15 min, gels were again shrunk in AcN, dried in speed vac, and digested with trypsin at 37 °C overnight. The next day, the supernatant with digested peptides was collected and a second extraction was done in 50% AcN with 0.1% TFA. The final supernatant was dried in speed vac and the lyophilized powder was subjected to MALD-TOF MS analysis essentially as described (Ahmad et al. 2015) except that the analysis was done in AB SCIEX 5800 TOF-TOF. The list of the generated peptide mass was searched in MASCOT search engine (http://www.matrixscience.com) using NCBI/UNIPROT database with following search parameters: mass tolerance, 50–100 ppm; species, Mus musculus; maximum missed cleavages, one for all samples. Identified proteins were further confirmed by tandem mass spectrometry. At least one peptide from each identified protein was selected for MS/MS validation with mass tolerance 0.2 Da.
Statistical analysis
Data are expressed as mean ± standard error of mean (S.E.M). Statistical analysis was performed by Student t test using GraphPad Prism software (Windows version 6). Differences were considered significant if the p value was less than 0.05.
Results
Downregulation of SG2NA in NIH 3T3 cells alters its proteome
To analyze the role of SG2NA in kinase-phosphatase signaling networks, we downregulated its expression by stably transfecting its shRNA (Tanti and Goswami 2014) in NIH3T3 cells and confirmed it by western blotting (Fig. 1a). To find out the changes in the expression of various proteins in knockdown cells vis-à-vis the control, a comparative proteomic study was done by 2D electrophoresis followed by MALDI-TOF-MS. To ensure reproducibility, the experiment was done in triplicate and the best image was taken as reference for further analysis. Two such representative images of control versus knockdown cells are shown in Supplemental Fig. 1S. Images were analyzed by the SameSpots software, TotalLab, UK. One hundred ten protein spots had >1.3-fold difference in expression levels between the two extracts, out of which 55 each were downregulated and upregulated. Thirty differentially expressed protein spots were then analyzed by MALDI-TOF MS, and their identity was determined (details given in the “Materials and methods” section). Out of those 30 proteins, 20 were upregulated and 10 were downregulated in SG2NA knockdown cells and a majority, i.e., seven upregulated and three downregulated proteins, were related to ER function (Fig. 1b, c, Supplemental Table 2S). Modulation of ER stress proteins upon depletion of SG2NA was then confirmed by western analysis. Lysates from control and SG2NA knockdown cell were resolved on 10% SDS-PAGE and blotted with GRP78, HSP90B, vimentin, and PKM2 antibody (Fig. 2a). The expression level was in full agreement with that seen in 2D gel (specific spots are shown on right panel of Fig. 2a). We also analyzed the transcripts of several genes involved in unfolded protein response (UPR) pathways, viz., grp78, grp94, pdia3, atf4, and chop, in control and SG2NA knockdown cells by both semi-quantitative (Supplemental Fig. 2S) and real-time RT-PCR (Fig. 2b, c). The upregulation of mRNAs of those genes involved in ER function reiterated that following the loss of SG2NA, UPR signaling is activated. To finally confirm that the loss of SG2NA leads to ER stress, we checked the splicing of xbp-1 mRNA (Calfon et al. 2002) and the cleavage of ATF6 (Haze et al. 1999), the hallmarks of UPR. As shown in Fig. 2c, substantive splicing of the xbp-1 transcript was seen in SG2NA knockdown cells only. Similarly, reduction in full-length Atf6 was also seen upon the depletion of SG2NA (Fig. 2d). In view of such substantive role of SG2NA in ER function, we also confirmed its localization in the ER or otherwise. Immunocytochemistry was done with SG2NA antibody with parallel staining of ER with the Tracker dye (ER Tracker Red E34250, Invitrogen). Such analysis showed the presence of SG2NA in the endoplasmic reticulum along with other cellular locations (Fig. 2e). We have demonstrated earlier that besides microsomes, SG2NA is also localized to mitochondria and plasma membrane (Tanti et al. 2014).
Fig. 1.

Modulation of NIH3T3 proteome upon depletion of SG2NA. a Equal amounts (50 μg) of protein extracts from control and SG2NA knockdown NIH3T3 cells were resolved on 10% SDS and probed with SG2NA antibody. Reprobing with β-actin was done to ensure equal loading. b Comparative proteomic analysis of control and SG2NA-downregulated NIH3T3 cells by 2D electrophoresis followed by MALDI-TOF-MS. Lysates (350 μg) from cells transfected with control shRNA (scr) and SG2NA shRNA were resolved by 2D electrophoresis, and the silver-stained gel images were analyzed by SameSpots software from TotalLab, UK. From the composite images, out of 110 differentially expressed proteins, 30 were identified by MALDI-TOF-MS, marked with arrows. Details of these analyses are given in Supplemental Fig. 1S and Table 1S. c Ten proteins modulated upon depletion of SG2NA that are involved in ER function are shown on the right
Fig. 2.
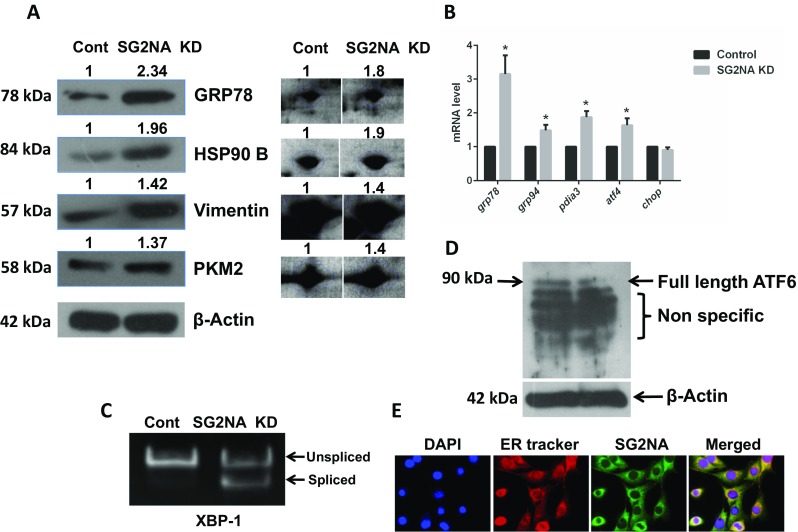
Upregulation of ER stress markers in normal versus SG2NA knockdown NIH 3T3 cells. a Total cell lysates (50 μg) from normal and SG2NA knockdown cells were resolved on SDS-PAGE and immunoblotted for GRP78, HSP90B, vimentin, and PKM2. Their expression levels were quantified using ImageJ software. Spots corresponding to these proteins in the 2D gel (Fig. 1) also showing their upregulation are shown on the right. b Total RNA was isolated from both the cell lines and analyzed for the relative mRNA levels (normalized against β-actin) for grp78, grp94, atf4, pdia3, and chop by real-time PCR. c Splicing of xbp-1, a hallmark of the IRE branch of ER stress, was also assayed by RT-PCR. All values are expressed as the mean ± S.E.M; n = 3; p < 0.05. d Total cell lysates (50 μg) from normal and SG2NA knockdown cells were resolved on SDS-PAGE and immunoblotted for ATF 6. The full-length band of ATF 6 is marked at molecular weight 90 kDa. Several nonspecific bands were also seen below. e Localization of SG2NA in the endoplasmic reticulum is shown by immunocytochemistry. Cells were fixed in chilled methanol and acetone. For staining SG2NA, cells were incubated with the primary antibody and then with FITC-tagged secondary antibody (Green). Nuclear and endoplasmic reticulum staining was done by DAPI and ER Tracker Red E34250 (Invitrogen), respectively. ER localized in SG2NA shows yellow color in merged picture, while non-ER SG2NA remains green (color figure online)
Upon perturbation of ER function, depending upon the intensity and duration of stress, UPR pathways either provide cytoprotection or lead to apoptosis. To check whether SG2NA knockdown cells proliferate normally, cell viability assay was performed using MTT reagents. The rate of proliferation of SG2NA-depleted cells was comparable to that of normal NIH3T3 cells (Supplemental Fig. 3S). Therefore, upon knockdown of SG2NA, although the ER function is disturbed, cells can overcome the stress and proliferate.
ER stressors thapsigargin and tunicamycin induce the expression of SG2NA
We thereafter tested whether the expression of SG2NA is modulated under ER stress. Cells were treated with thapsigargin (TG, 1 and 2 μM), an inhibitor of SERCA calcium pump, and tunicamycin (TM, 1 and 5 μg/ml), an inhibitor of N-linked glycosylation. Both these reagents are widely used for inducing ER stress in cultured cells and experimental animals (Koga et al. 2015). Induction of ER stress response was evident from the increase in the mRNAs for the ER stress-responsive transcription factor CHOP as determined by semi-qRT-PCR (Supplemental Fig. 4S) and real-time PCR (Fig. 3a). Increase in CHOP mRNA was ~20- and ~35-fold, respectively, at 24 h with 1- and 5-μg/ml doses of TM. With TG also, the induction of CHOP was robust to ~30-fold at 1 μM and to ~10-fold at 2 μM until 24 h. There was an increase in sg2na transcript in both TM- and TG-treated cells. The induction was ~2–3-fold with 1 and 5 μg TM at 24 h. With TG, the response was stronger and quicker, to ~7- and ~5-fold for 1- and 2-μM doses, respectively, at 6 h, followed by a decline. For subsequent study, we used the lower doses of TG and TM as the induction of sg2na was more at these doses.
Fig. 3.

Increased expression of SG2NA under ER stress. a After treating the NIH3T3 cells with thapsigargin (1 and 2 μM) and tunicamycin (1 and 5 μg/ml), cells were harvested at different time points and total RNA was isolated. Real-time PCR was done with primers for chop and sg2na (normalized against β-actin) that showed upregulation of Sg2na under ER stress. b NIH3T3 cells were treated with DTT (1 and 2 mM), harvested at different time points, and total RNA was isolated. Real-time PCR was done with primers for chop, grp 78, and sg2na (normalized against β-actin) that showed no change of Sg2na transcript under ER stress induced by DTT. c, d After treating control and SG2NA downregulated NIH3T3 cells with TG (1 μM) and TM (1 μg/ml), cells were harvested at different time points, and total protein was isolated, resolved on SDS-PAGE (50 μg), and probed with SG2NA and beta actin antibody. e After treating with TG (1 μM) and TM (1 μg/ml) for 6 and 24 h, NIH3T3 cells were fractionated by differential centrifugation into cytosol, mitochondria, and microsome. The fractionated samples were analyzed by western blotting using antibody against SG2NA. The equal loading in each lane was represented by Coomassie Brilliant Blue stain gel. Fractions were checked for their authenticity by probing with organelle-specific antibodies. f To check the expression of SG2NA in vivo under ER stress, BALB/c mouse was intraperitoneally injected with TG (0.1 μg/g of body weight). Twenty-four hours after the treatment, brain and liver tissues were extracted and 50 μg of total lysate was separated on 10% SDS-PAGE and blotted with SG2NA, GRP78, and beta actin
We also induced the ER stress by the reductive stressor, i.e., dithiothreitol (DTT), and checked the expression of sg2na. The increased expression of chop and grp 78 mRNA under DTT treatment indicate the induction of ER stress (Fig. 3b). However, there was no substantive change in the transcript level of sg2na at both 1- and 2-mM doses of DTT, so we did not include DTT for further study.
Western analysis of the level of SG2NA in TM- and TG-treated cells corroborated the real-time RT-PCR data. As shown in Fig. 3c, in 1 μM TG-treated cells, SG2NA level increased at 24 h. Similar pattern of induction was also seen in SG2NA knockdown cells, but to a lower extent. In 1 μg/ml TM-treated cells, also there was an increase in SG2NA, but with a late response, seen only at 24 h (Fig. 3d). We finally examined the subcellular distribution of SG2NA under ER stress. As shown in Fig. 3e, in TM-treated cells, increase in SG2NA was seen only in microsomes at 24 h. Under TG treatment, there was a robust increase in mitochondrial SG2NA at 6 h, followed by a decrease at 24 h but still at a level higher than the baseline while the microsomal fraction had a substantial increase at 24 h only. We also checked the SG2NA level after inducing ER stress by TG in mouse. BALB/c mouse was injected with thapsigargin (0.1 μg/g body weight) intraperitoneally (Hiramatsu et al. 2007). Expression of SG2NA was assessed by western blotting of the extracts from the brain and the liver. Consistent with ex vivo data, in TG-treated liver, the expression of 78-kDa SG2NA increased by 1.5-fold as compared to the control while the expression of the 52-kDa isoform decreased by 1.3-fold (Fig. 3f). Induction of ER stress in liver tissue was evident from the upregulation of GRP78. There was no modulation in the level of GRP78 and SG2NA in TG-treated brain (Fig. 3f). These data shows that ER stress modulates the expression of 78- and 52-kDa SG2NAs in vivo as well.
SG2NA is necessary for cell survival under ER stress
As shown above, while depletion of SG2NA induces ER stress, TM and TG regulate its expression. We thus analyzed if SG2NA has any role in cytoprotection against ER stress. Control NIH3T3 cells and those with SG2NA knockdown background were treated with 1 μM TG and 1 μg/μl TM for various time periods and cell viability was measured by MTT reduction assay. Initially, cytotoxicity was seen with both the drugs in normal and SG2NA downregulated cells. However, with the progression of time, control cells recovered and started proliferating, while SG2NA-downregulated cells were unable to cope with the ER stress and died (Fig. 4a). Glucose deprivation also induces unfolded protein response and results in cell death (Palorini et al. 2013; Ding et al. 2016). There was a significant difference in the viability between control and SG2NA-depleted NIH3T3 cells grown under low (1 mM) and moderate (5 mM) concentrations of glucose (Fig. 4a). There was no difference in the proliferation of both types of cells upon DMSO treatment (vehicle control) and under 25 mM glucose (Supplemental Fig. 5S). Thus, SG2NA has a protective role against cytotoxicity induced by ER stress.
Fig. 4.
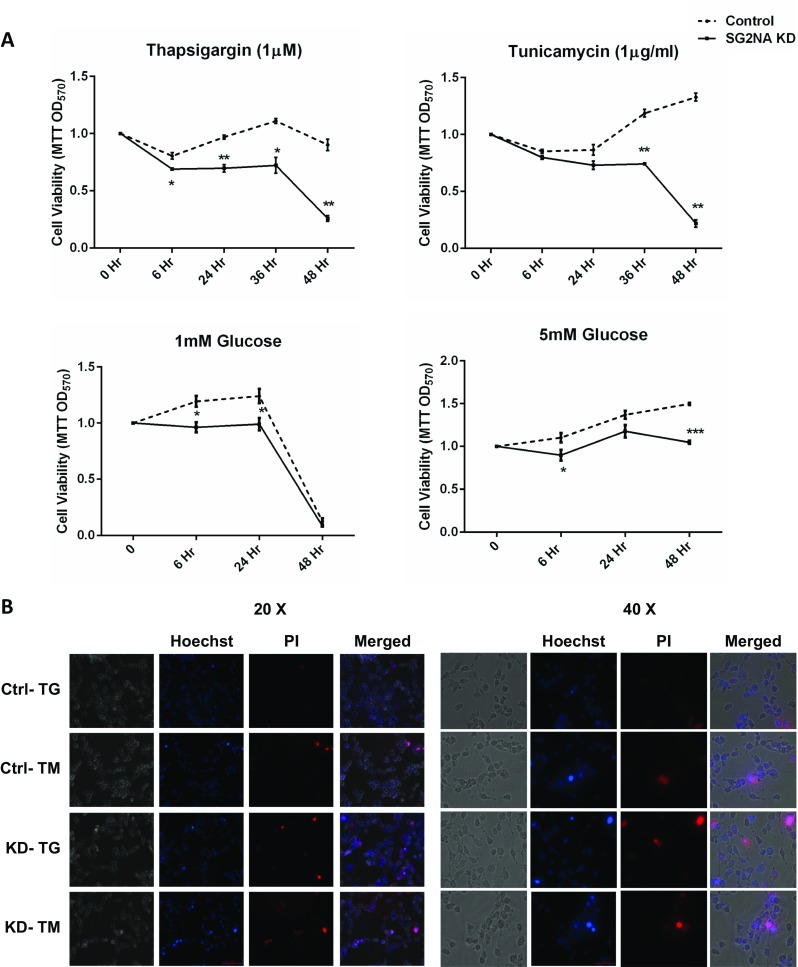
Role of SG2NA in cytoprotection under ER stress. a After inducing ER stress by treating cells with TG and TM, and by low (1 mM) and moderate glucose (5 mM) in control and SG2NA knockdown cells, viability was assayed at indicated hours by MTT reagent. All values are expressed as the mean ± S.E.M; n = 3; p < 0.05. b Representative composite images of cells after dual staining with Hoechst 33342 and PI. Cells were treated with TG and TM for 24 h, stained, and imaged by fluorescence microscope. Cells intensely stained by Hoechst 33342 are apoptotic, cells stained by only PI are dead cells with normal nuclei, and cells which are stained by both Hoechst and PI are dead with apoptotic nuclei (Liu et al. 2012; Syed Abdul Rahman et al. 2013)
We also assessed the extent of apoptosis after TM and TG treatments. Hoechst is a cell-permeable blue fluorescent dye which stains condensed chromatin of apoptotic cells more intensely as compared to normal cells. On the other hand, the red fluorescent dye PI is not permeable to live cells and can only stain cells with loss of membrane integrity. Cells were treated with TG and TM for 24 h and stained with Hoechst 33342 and PI. As shown in Fig. 4b, the cell death was more in SG2NA knockdown conditions as compared to the control. The increased cell death in SG2NA knockdown cells after treating with TG and TM was also evident from cell morphology at different time points (Supplemental Fig. 6S). These findings suggest that SG2NA has a role in cell survival under ER stress.
SG2NA knockdown cells have a different kinetics of cell cycle progression under ER stress
We have observed that in cells with downregulation of SG2NA, the expression of cyclin D1 is reduced and the duration of the G1 phase is extended (Pandey et al., manuscript submitted). It has been reported that induction of UPR pathways by TG and TM treatment leads to the reduction of cyclin D1 and G1 phase arrest (Brewer et al. 1999). We thus analyzed the effects of ER stressors on cell cycle progression in SG2NA-depleted cells. As shown in Fig. 5a and Table 1, after treating SG2NA knockdown cells with TG and TM, the percentage of cells in the sub-G1 phase undergoing apoptosis was increased by ~2-fold. However, in contrast to NIH3T3 cells which on treatment with TG and TM had a higher number of cells in the G1 phase, in SG2NA-depleted cells fewer number of cells remained in the G1 phase as they trend to traverse towards the G2 phase. This effect was more prominent under TM treatment. Therefore, although loss of SG2NA retains a population of cells in the G1 phase, concurrent ER stress facilitates their exit from G1 and traverse forward.
Fig. 5.

Effects of SG2NA depletion on cell cycle progression under ER stress. a Control and SG2NA-downregulated cells were treated with TG and TM for 6 and 24 h and harvested, fixed with ethanol, and stained with PI. The distribution of cells in different phases of the cell cycle was determined by flow cytometry of total DNA content. Red box drawn in each histogram shows the sub-G1 population. The percentage of cells in different phases of the cell cycle is represented in the form of the histogram. Table 1 shows percent distribution of control and SG2NA knockdown cells in different phases of cell cycles after treating with thapsigargin (1 μM) and tunicamycin (1 μg/ml) at different time points. Experiment was repeated three times, and the representative result is shown above. b After TG and TM treatment, the level of cyclin D1 and cyclin D3 was compared between normal and SG2NA-downregulated NIH3T3 cells
Table 1.
Percent distribution of control and SG2NA knockdown cells in different phases of cell cycles after treating with thapsigargin (1 μM) and tunicamycin (1 μg/ml) at different time points
| Sub-G1 phase | G1/S phase | S phase | G2/M phase | |
|---|---|---|---|---|
| NIH3T3 (control) | 1.21 | 60.76 | 19.33 | 16.99 |
| NIH3T3 (Control) (TG 6 h) | 3.91 | 62.82 | 17.13 | 14.12 |
| NIH3T3 (control) (TG 24 h) | 3.20 | 68.48 | 11.09 | 17.62 |
| SG2NA kD | 1.71 | 70.69 | 13.48 | 12.99 |
| SG2NA kD (TG 6 h) | 5.35 | 64.78 | 14.84 | 11.57 |
| SG2NA kD (TG 24 h) | 9.38 | 64.46 | 10.76 | 14.88 |
| NIH3T3 (control) | 1.21 | 60.76 | 19.33 | 16.99 |
| NIH3T3 (control) (TM 6 h) | 1.61 | 60.57 | 19.81 | 15.24 |
| NIH3T3 (control) (TM 24 h) | 3.30 | 71.90 | 9.44 | 13.82 |
| SG2NA kD | 1.71 | 70.69 | 13.48 | 12.99 |
| SG2NA kD (TM 6 h) | 2.73 | 66.14 | 16.84 | 11.81 |
| SG2NA kD (TM 24 h) | 4.43 | 54.18 | 19.38 | 19.19 |
We checked the expression of cyclin D1 and D3 in SG2NA-depleted cells under ER stress. These cyclins are required for G1/S transition, and their levels are modulated under ER stress (Brewer et al. 1999; Wang et al. 2014, 2015). As shown in Fig. 5b, in normal cells under ER stressors, the expression of cyclin D1 decreased with increasing time, leading to G1 phase arrest. However, in the SG2NA knockdown background, although the level of cyclin D1 was less as compared to its normal counterpart at the beginning, upon treatment with ER stressors, its level increased and more so under TG treatment. On the contrary, the expression of cyclin D3 was higher in SG2NA-depleted cells as compared to its normal counterpart but under treatment with both TG and TM, its level was comparable in both cell types.
Discussion
The STRIPAK complexes are versatile in nature, made up of a number of core kinases, subunits of PP2A, and other mutually exclusive proteins of versatile functions (Hwang and Pallas 2014). Also, there are STRIPAK-like complexes that are devoid of PP2A and the core kinases (Hwang and Pallas 2014; Frey et al. 2015). These multiprotein complexes are built upon striatin/SG2NA as platforms and are involved in signaling events in various subcellular regions. But there is no clear evidence of their roles in ER functions. Considering the versatile and the dynamic nature of the ER activities, viz., protein and lipid biosynthesis, post-translational modifications of proteins and their transports, Ca++ storage and signaling, carbohydrate metabolism, etc., STRIPAKs are likely to have roles in ER functions as well.
Unlike few other cell lines and tissues which express multiple variants of SG2NA, NIH3T3 cells express only the 78-kDa isoform (Sanghamitra et al. 2008; Tanti and Goswami 2014; Jain et al. 2015). Modulation of a large number of proteins upon its depletion suggested a wider regulatory effect with both immediate and downstream targets. A comprehensive network analysis was not the objective of our present study, so we randomly picked up 30 protein spots and identified them. Most of those proteins belonged to three distinct categories, viz., those involved in ER function (ten), metabolism (ten), and actin cytoskeleton organization (four). Also, out of eight ER-related proteins that were upregulated, four were protein disulfide isomerases (PDIs). PDIs are required for the formation of disulfide bonds in newly synthesized proteins, and they are upregulated during ER stress (Li et al. 2013). In mammals, there are 19 PDIs, and some of them are likely to have functions other than the isomerization of disulfide bonds (Appenzeller-Herzog and Ellgaard 2008). Recent studies have shown roles other than disulfide bond formation in neurodegenerative diseases through unknown mechanisms (Perri et al. 2015). Unlike PDIs, the expression of peptidyl-prolyl cis-trans isomerase (PPI), another enzyme required for protein folding, was downregulated by the knockdown of SG2NA. Decrease in PPI has also been reported under ER stress (Li et al. 2013). In view of such upregulation of several PDIs and downregulation of PPI upon depletion of SG2NA, we pursued its role in ER functions.
2D gel-based proteomic analysis is semi-quantitative. We thus validated our observations by western blotting for the expression of ER-resident chaperones GRP78 and HSP90B; cytoskeletal protein vimentin, involved in epithelial-to-mesenchymal transition; and the metabolic enzyme PKM2. These proteins are upregulated during ER stress under various experimental conditions (Ulianich et al. 2008; Shah et al. 2015; Sobhakumari et al. 2016; Wu et al. 2016; Cerezo et al. 2016). In agreement with the 2D gel data, immunoblot also showed increase in their levels in SG2NA-depleted cells.
ER plays a critical role in the synthesis, folding, and maturation of transmembrane and secretory proteins. Any disturbances in ER functions lead to stress, and to counter such conditions, cells elicit a remedial response called unfolded protein response (UPR) that is conserved in evolution (Wu et al. 2016). The strong association between SG2NA and ER stress became unequivocal with further demonstration that upon its depletion, the mRNAs for grp78, grp94, pdi3, and atf4 were upregulated, and that xbp1was spliced. These are the benchmarks of ER stress response, which reiterates that knockdown of SG2NA leads to ER stress (Shah and Kumar 2016).
Over the years, studies using pharmacological agents like tunicamycin (TM) and thapsigargin (TG) have established the hallmarks of UPR pathways. TM inhibits the first step of glycoprotein biosynthesis, and TG reduces the calcium levels in ER, thus inhibiting the calcium-dependent chaperones (Oslowski and Urano 2011). When we tested the levels of SG2NA in the presence of these ER stressors, TG turned out to be a robust inducer of sg2na mRNA at the early time point, while TM had a modest effect. Since SG2NA and other members of the striatin family have calcium-dependent calmodulin binding activities, upregulation of SG2NA by TG suggests its role in Ca++ homeostasis in the ER. However, at the protein level, both TM and TG increased the expression of SG2NA only at a later time point which is at 24 h. We have demonstrated earlier that the expression of SG2NA is regulated at multiple levels including protein and mRNA stability (Jain et al. 2015). Noticeably, fractionation of cell lysates showed that the subcellular distribution of SG2NA in TG- and TM-treated cells had a different pattern. While TG increased the level of SG2NA in both mitochondria and microsomes/ER, in TM-treated cells, the increase in SG2NA was primarily in the microsomal fraction. This observation becomes relevant in the context of the role of mitochondria in Ca++ buffering and its cross talk with the ER (Naia et al. 2016). Taken together, it appears that SG2NA has roles in Ca++ homeostasis in mitochondria and ER and any perturbation in its function induces a compensatory response through the UPR pathways. Such interpretation is further strengthened by the observation that the deleterious effects of TM, TG, and glucose deprivation were augmented in SG2NA-depleted cells as evident from the reduced cell viability and apoptosis.
Several studies have shown that ER stress independently arrests at G1 and G2 phases (Bourougaa et al. 2010; Thomas et al. 2013). Our results on the interrelations between the level of SG2NA, ER stress, and cell cycle show that depletion of SG2NA along with ER stress leads to modulation of cyclin D1, but not cyclin D3, with increased propensity to traverse the respective checkpoints followed by apoptosis. It thus appears that while ER stress retains more cells in the G1 phase under normal condition, upon depletion of SG2NA such protective mechanism fails and cells continue to divide and die thereafter.
ER stress has been attributed to various pathophysiological conditions like neurodegeneration, cardiovascular dysfunction, and cancer. Although the role of STRIPAK in these diseases is evident, its role in ER stress, if any, is yet to be shown. Nevertheless, there are reports in which constituents of STRIPAK complexes have been found in the ER. Mammalian sarcolemmal membrane-associated protein (SLMAP), a component of STRIPAK, helps it localize in ER and several other organelles (Couzens et al. 2013). In Sordaria macrospora, model fungi for studying cell differentiation, the SLMAP homolog PRO45 localizes in the nuclear envelope, mitochondria, and ER (Nordzieke et al. 2015). In Saccharomyces cerevisiae, the SLMAP homolog Far9 also localizes to the endoplasmic reticulum and Golgi (Lisa-Santamaría et al. 2012). In Aspergillus nidulans, StrA, the homolog of mammalian striatin, localizes in the ER and nuclear envelope while its deletion leads to defects in germination of conidium, mycelial growth, pigment production, etc. Taken together, although the role of striatin/SG2NA in ER function has been emergent, our present study demonstrating the role of SG2NA in ER function opens new vistas of STRIPAK in the context of ER.
Electronic supplementary material
(DOCX 11 kb)
(PPTX 4457 kb)
Acknowledgements
The authors thankfully acknowledge funding support from the SERB, Department of Science and Technology, Government of India, under the umbrella project DST-PURSE awarded to Jawaharlal Nehru University, as well as DBT-BUILDER, Department of Biotechnology, Government of India, awarded to the Jawaharlal Nehru University. Buddhi P Jain and Shweta Pandey were the recipients of JRF/SRF from CSIR, Government of India.
Abbreviations
- APC
Adenomatous polyposis coli
- ATF
Activating transcription factor 4
- CHOP
CCAAT-enhancer-binding protein homologous protein
- ER
Endoplasmic reticulum stress
- GRP78
Glucose-regulated protein 78
- GRP94
Glucose-regulated protein 94
- HSP90B
Heat shock protein 90B
- MALDI-TOF
Matrix-assisted laser desorption/ionization-time of flight
- PDIA3
Protein disulfide isomerase A3
- PKM2
Protein kinase M2
- STRIPAK
Striatin-interacting phosphatase and kinase
- TG
Thapsigargin
- TM
Tunicamycin
- UPR
Unfolded protein response
- XBP-1
X-box binding protein 1
Authors’ contributions
Buddhi Prakash Jain performed majority of the experiments and data analysis. Shweta Pandey performed the immunoblots shown in Fig. 3d. Nikhat Saleem performed the experiments shown in Figs. 2d, e and 3b. Goutam K Tanti started the work and did the preliminary experiments. Shalini Mishra helped in 2D proteomics. The paper was designed and written by Buddhi Prakash Jain and Shyamal K Goswami.
Compliance with ethical standards
ᅟ
The use of animals was according to the approved protocol of the Animal Ethics committee, Jawaharlal Nehru University, New Delhi.
Conflict of interest
The authors declare that they have no conflict of interest.
Footnotes
Electronic supplementary material
The online version of this article (doi:10.1007/s12192-017-0816-7) contains supplementary material, which is available to authorized users.
References
- Ahmad Y, Sharma NK, Ahmad MF, et al. The proteome of hypobaric induced hypoxic lung: insights from temporal proteomic profiling for biomarker discovery. Sci Rep. 2015;5:10681. doi: 10.1038/srep10681. [DOI] [PMC free article] [PubMed] [Google Scholar]
- Andreazza S, Bouleau S, Martin B, et al. Daytime CLOCK dephosphorylation is controlled by STRIPAK complexes in Drosophila. Cell Rep. 2015;11:1266–1279. doi: 10.1016/j.celrep.2015.04.033. [DOI] [PubMed] [Google Scholar]
- Appenzeller-Herzog C, Ellgaard L. The human PDI family: versatility packed into a single fold. Biochim Biophys Acta. 2008;1783:535–548. doi: 10.1016/j.bbamcr.2007.11.010. [DOI] [PubMed] [Google Scholar]
- Baillat G, Moqrich A, Castets F, et al. Molecular cloning and characterization of phocein, a protein found from the Golgi complex to dendritic spines. Mol Biol Cell. 2001;12:663–673. doi: 10.1091/mbc.12.3.663. [DOI] [PMC free article] [PubMed] [Google Scholar]
- Benoist M, Gaillard S, Castets F. The striatin family: a new signaling platform in dendritic spines. J Physiol Paris. 2006;99:146–153. doi: 10.1016/j.jphysparis.2005.12.006. [DOI] [PubMed] [Google Scholar]
- Boada-Romero E, Serramito-Gómez I, Sacristán MP, et al. The T300A Crohn’s disease risk polymorphism impairs function of the WD40 domain of ATG16L1. Nat Commun. 2016;7:11821. doi: 10.1038/ncomms11821. [DOI] [PMC free article] [PubMed] [Google Scholar]
- Bourougaa K, Naski N, Boularan C, et al. Endoplasmic reticulum stress induces G2 cell-cycle arrest via mRNA translation of the p53 isoform p53/47. Mol Cell. 2010;38:78–88. doi: 10.1016/j.molcel.2010.01.041. [DOI] [PubMed] [Google Scholar]
- Breitman M, Zilberberg A, Caspi M, Rosin-Arbesfeld R. The armadillo repeat domain of the APC tumor suppressor protein interacts with Striatin family members. Biochim Biophys Acta. 2008;1783:1792–1802. doi: 10.1016/j.bbamcr.2008.04.017. [DOI] [PubMed] [Google Scholar]
- Brewer JW, Hendershot LM, Sherr CJ, Diehl JA. Mammalian unfolded protein response inhibits cyclin D1 translation and cell-cycle progression. Proc Natl Acad Sci U S A. 1999;96:8505–8510. doi: 10.1073/pnas.96.15.8505. [DOI] [PMC free article] [PubMed] [Google Scholar]
- Calfon M, Zeng H, Urano F, et al. IRE1 couples endoplasmic reticulum load to secretory capacity by processing the XBP-1 mRNA. Nature. 2002;415:92–96. doi: 10.1038/415092a. [DOI] [PubMed] [Google Scholar]
- Cerezo M, Lehraiki A, Millet A, et al. Compounds triggering ER stress exert anti-melanoma effects and overcome BRAF inhibitor resistance. Cancer Cell. 2016;29:805–819. doi: 10.1016/j.ccell.2016.04.013. [DOI] [PubMed] [Google Scholar]
- Chan KM, Zhang Z. Leucine-rich repeat and WD repeat-containing protein 1 is recruited to pericentric heterochromatin by trimethylated lysine 9 of histone H3 and maintains heterochromatin silencing. J Biol Chem. 2012;287:15024–15033. doi: 10.1074/jbc.M111.337980. [DOI] [PMC free article] [PubMed] [Google Scholar]
- Chen C, Shi Z, Zhang W, et al. Striatins contain a noncanonical coiled coil that binds protein phosphatase 2A A subunit to form a 2:2 heterotetrameric core of striatin-interacting phosphatase and kinase (STRIPAK) complex. J Biol Chem. 2014;289:9651–9661. doi: 10.1074/jbc.M113.529297. [DOI] [PMC free article] [PubMed] [Google Scholar]
- Couzens AL, Knight JDR, Kean MJ, et al. Protein interaction network of the mammalian Hippo pathway reveals mechanisms of kinase-phosphatase interactions. Sci Signal. 2013;6:rs15. doi: 10.1126/scisignal.2004712. [DOI] [PubMed] [Google Scholar]
- Cuchalová L, Kouba T, Herrmannová A, et al. The RNA recognition motif of eukaryotic translation initiation factor 3g (eIF3g) is required for resumption of scanning of posttermination ribosomes for reinitiation on GCN4 and together with eIF3i stimulates linear scanning. Mol Cell Biol. 2010;30:4671–4686. doi: 10.1128/MCB.00430-10. [DOI] [PMC free article] [PubMed] [Google Scholar]
- Ding B, Parmigiani A, Divakaruni AS, et al. Sestrin2 is induced by glucose starvation via the unfolded protein response and protects cells from non-canonical necroptotic cell death. Sci Rep. 2016;6:22538. doi: 10.1038/srep22538. [DOI] [PMC free article] [PubMed] [Google Scholar]
- Frey S, Reschka EJ, Pöggeler S. Germinal center kinases SmKIN3 and SmKIN24 are associated with the Sordaria macrospora striatin-interacting phosphatase and kinase (STRIPAK) complex. PLoS One. 2015;10:e0139163. doi: 10.1371/journal.pone.0139163. [DOI] [PMC free article] [PubMed] [Google Scholar]
- Frost A, Elgort MG, Brandman O, et al. Functional repurposing revealed by comparing S. pombe and S. cerevisiae genetic interactions. Cell. 2012;149:1339–1352. doi: 10.1016/j.cell.2012.04.028. [DOI] [PMC free article] [PubMed] [Google Scholar]
- Gaillard S, Bailly Y, Benoist M, et al. Targeting of proteins of the striatin family to dendritic spines: role of the coiled-coil domain. Traffic Cph Den. 2006;7:74–84. doi: 10.1111/j.1600-0854.2005.00363.x. [DOI] [PubMed] [Google Scholar]
- Gordon J, Hwang J, Carrier KJ, et al. Protein phosphatase 2a (PP2A) binds within the oligomerization domain of striatin and regulates the phosphorylation and activation of the mammalian Ste20-like kinase Mst3. BMC Biochem. 2011;12:54. doi: 10.1186/1471-2091-12-54. [DOI] [PMC free article] [PubMed] [Google Scholar]
- Haze K, Yoshida H, Yanagi H, et al. Mammalian transcription factor ATF6 is synthesized as a transmembrane protein and activated by proteolysis in response to endoplasmic reticulum stress. Mol Biol Cell. 1999;10:3787–3799. doi: 10.1091/mbc.10.11.3787. [DOI] [PMC free article] [PubMed] [Google Scholar]
- Hiramatsu N, Kasai A, Du S, et al. Rapid, transient induction of ER stress in the liver and kidney after acute exposure to heavy metal: evidence from transgenic sensor mice. FEBS Lett. 2007;581:2055–2059. doi: 10.1016/j.febslet.2007.04.040. [DOI] [PubMed] [Google Scholar]
- Hwang J, Pallas DC. STRIPAK complexes: structure, biological function, and involvement in human diseases. Int J Biochem Cell Biol. 2014;47:118–148. doi: 10.1016/j.biocel.2013.11.021. [DOI] [PMC free article] [PubMed] [Google Scholar]
- Hwangbo D-S, Biteau B, Rath S, et al. Control of apoptosis by Drosophila DCAF12. Dev Biol. 2016;413:50–59. doi: 10.1016/j.ydbio.2016.03.003. [DOI] [PMC free article] [PubMed] [Google Scholar]
- Jain BP, Chauhan P, Tanti GK, et al. Tissue specific expression of SG2NA is regulated by differential splicing, RNA editing and differential polyadenylation. Gene. 2015;556:119–126. doi: 10.1016/j.gene.2014.11.045. [DOI] [PubMed] [Google Scholar]
- Koga T, Suico MA, Shimasaki S, et al. Endoplasmic reticulum (ER) stress induces Sirtuin 1 (SIRT1) expression via the PI3K-Akt-GSK3β signaling pathway and promotes hepatocellular injury. J Biol Chem. 2015;290:30366–30374. doi: 10.1074/jbc.M115.664169. [DOI] [PMC free article] [PubMed] [Google Scholar]
- Kück U, Beier AM, Teichert I. The composition and function of the striatin-interacting phosphatases and kinases (STRIPAK) complex in fungi. Fungal Genet Biol FG B. 2016;90:31–38. doi: 10.1016/j.fgb.2015.10.001. [DOI] [PubMed] [Google Scholar]
- Landberg G, Tan EM. Characterization of a DNA-binding nuclear autoantigen mainly associated with S phase and G2 cells. Exp Cell Res. 1994;212:255–261. doi: 10.1006/excr.1994.1141. [DOI] [PubMed] [Google Scholar]
- Li H, Zhang X-Y, Wu T-J, et al. Endoplasmic reticulum stress regulates rat mandibular cartilage thinning under compressive mechanical stress. J Biol Chem. 2013;288:18172–18183. doi: 10.1074/jbc.M112.407296. [DOI] [PMC free article] [PubMed] [Google Scholar]
- Lisa-Santamaría P, Jiménez A, Revuelta JL. The protein factor-arrest 11 (Far11) is essential for the toxicity of human caspase-10 in yeast and participates in the regulation of autophagy and the DNA damage signaling. J Biol Chem. 2012;287:29636–29647. doi: 10.1074/jbc.M112.344192. [DOI] [PMC free article] [PubMed] [Google Scholar]
- Liu R-M, Li Y-B, Zhong J-J. Cytotoxic and pro-apoptotic effects of novel ganoderic acid derivatives on human cervical cancer cells in vitro. Eur J Pharmacol. 2012;681:23–33. doi: 10.1016/j.ejphar.2012.02.007. [DOI] [PubMed] [Google Scholar]
- Liu B, Zheng Y, Yin F, et al. Toll receptor-mediated Hippo signaling controls innate immunity in Drosophila. Cell. 2016;164:406–419. doi: 10.1016/j.cell.2015.12.029. [DOI] [PMC free article] [PubMed] [Google Scholar]
- Lu Q, Pallas DC, Surks HK, et al. Striatin assembles a membrane signaling complex necessary for rapid, nongenomic activation of endothelial NO synthase by estrogen receptor alpha. Proc Natl Acad Sci U S A. 2004;101:17126–17131. doi: 10.1073/pnas.0407492101. [DOI] [PMC free article] [PubMed] [Google Scholar]
- Maheshwari R, Pushpa K, Subramaniam K. A role for post-transcriptional control of endoplasmic reticulum dynamics and function in C. elegans germline stem cell maintenance. Dev Camb Engl. 2016;143:3097–3108. doi: 10.1242/dev.134056. [DOI] [PMC free article] [PubMed] [Google Scholar]
- Miller JC, Chezem WR, Clay NK. Ternary WD40 repeat-containing protein complexes: evolution, composition and roles in plant immunity. Front Plant Sci. 2015;6:1108. doi: 10.3389/fpls.2015.01108. [DOI] [PMC free article] [PubMed] [Google Scholar]
- Moreno CS, Park S, Nelson K, et al. WD40 repeat proteins striatin and S/G(2) nuclear autoantigen are members of a novel family of calmodulin-binding proteins that associate with protein phosphatase 2A. J Biol Chem. 2000;275:5257–5263. doi: 10.1074/jbc.275.8.5257. [DOI] [PMC free article] [PubMed] [Google Scholar]
- Muro Y, Chan EK, Landberg G, Tan EM. A cell-cycle nuclear autoantigen containing WD-40 motifs expressed mainly in S and G2 phase cells. Biochem Biophys Res Commun. 1995;207:1029–1037. doi: 10.1006/bbrc.1995.1288. [DOI] [PubMed] [Google Scholar]
- Naia L, Ferreira IL, Ferreiro E, Rego AC (2016) Mitochondrial Ca(2+) handling in Huntington’s and Alzheimer’s diseases—role of ER-mitochondria crosstalk. Biochem Biophys Res Commun. doi:10.1016/j.bbrc.2016.07.122 [DOI] [PubMed]
- Nordzieke S, Zobel T, Fränzel B, et al. A fungal sarcolemmal membrane-associated protein (SLMAP) homolog plays a fundamental role in development and localizes to the nuclear envelope, endoplasmic reticulum, and mitochondria. Eukaryot Cell. 2015;14:345–358. doi: 10.1128/EC.00241-14. [DOI] [PMC free article] [PubMed] [Google Scholar]
- Oslowski CM, Urano F. Measuring ER stress and the unfolded protein response using mammalian tissue culture system. Methods Enzymol. 2011;490:71–92. doi: 10.1016/B978-0-12-385114-7.00004-0. [DOI] [PMC free article] [PubMed] [Google Scholar]
- Palorini R, Cammarata FP, Cammarata F, et al. Glucose starvation induces cell death in K-ras-transformed cells by interfering with the hexosamine biosynthesis pathway and activating the unfolded protein response. Cell Death Dis. 2013;4:e732. doi: 10.1038/cddis.2013.257. [DOI] [PMC free article] [PubMed] [Google Scholar]
- Perri ER, Thomas CJ, Parakh S, et al. The unfolded protein response and the role of protein disulfide isomerase in neurodegeneration. Front Cell Dev Biol. 2015;3:80. doi: 10.3389/fcell.2015.00080. [DOI] [PMC free article] [PubMed] [Google Scholar]
- Phillips MJ, Voeltz GK. Structure and function of ER membrane contact sites with other organelles. Nat Rev Mol Cell Biol. 2016;17:69–82. doi: 10.1038/nrm.2015.8. [DOI] [PMC free article] [PubMed] [Google Scholar]
- Ritterhoff S, Farah CM, Grabitzki J, et al. The WD40-repeat protein Han11 functions as a scaffold protein to control HIPK2 and MEKK1 kinase functions. EMBO J. 2010;29:3750–3761. doi: 10.1038/emboj.2010.251. [DOI] [PMC free article] [PubMed] [Google Scholar]
- Sakuma C, Okumura M, Umehara T, et al. A STRIPAK component strip regulates neuronal morphogenesis by affecting microtubule stability. Sci Rep. 2015;5:17769. doi: 10.1038/srep17769. [DOI] [PMC free article] [PubMed] [Google Scholar]
- Sanghamitra M, Talukder I, Singarapu N, et al. WD-40 repeat protein SG2NA has multiple splice variants with tissue restricted and growth responsive properties. Gene. 2008;420:48–56. doi: 10.1016/j.gene.2008.04.016. [DOI] [PubMed] [Google Scholar]
- Shah A, Kumar A (2016) Methamphetamine-mediated endoplasmic reticulum (ER) stress induces type-1 programmed cell death in astrocytes via ATF6, IRE1α and PERK pathways. Oncotarget. doi:10.18632/oncotarget.10025 [DOI] [PMC free article] [PubMed]
- Shah PP, Lockwood WW, Saurabh K, et al. Ubiquilin1 represses migration and epithelial-to-mesenchymal transition of human non-small cell lung cancer cells. Oncogene. 2015;34:1709–1717. doi: 10.1038/onc.2014.97. [DOI] [PMC free article] [PubMed] [Google Scholar]
- Shen Z, Sathyan KM, Geng Y, et al. A WD-repeat protein stabilizes ORC binding to chromatin. Mol Cell. 2010;40:99–111. doi: 10.1016/j.molcel.2010.09.021. [DOI] [PMC free article] [PubMed] [Google Scholar]
- Shi Z, Jiao S, Zhou Z. STRIPAK complexes in cell signaling and cancer. Oncogene. 2016;35:4549–4557. doi: 10.1038/onc.2016.9. [DOI] [PubMed] [Google Scholar]
- Sobhakumari A, Orcutt KP, Love-Homan L, et al. 2-Deoxy-d-glucose suppresses the in vivo antitumor efficacy of erlotinib in head and neck squamous cell carcinoma cells. Oncol Res. 2016;24:55–64. doi: 10.3727/096504016X14586627440192. [DOI] [PMC free article] [PubMed] [Google Scholar]
- Soni S, Tyagi C, Grover A, Goswami SK. Molecular modeling and molecular dynamics simulations based structural analysis of the SG2NA protein variants. BMC Res Notes. 2014;7:446. doi: 10.1186/1756-0500-7-446. [DOI] [PMC free article] [PubMed] [Google Scholar]
- Syed Abdul Rahman SN, Abdul Wahab N, Abd Malek SN. In vitro morphological assessment of apoptosis induced by antiproliferative constituents from the rhizomes of Curcuma zedoaria. Evid-Based Complement Altern Med ECAM. 2013;2013:257108. doi: 10.1155/2013/257108. [DOI] [PMC free article] [PubMed] [Google Scholar]
- Tanti GK, Goswami SK. SG2NA recruits DJ-1 and Akt into the mitochondria and membrane to protect cells from oxidative damage. Free Radic Biol Med. 2014;75C:1–13. doi: 10.1016/j.freeradbiomed.2014.07.009. [DOI] [PubMed] [Google Scholar]
- Tanti GK, Singarapu N, Muthuswami R, Goswami SK. Among the three striatin family members, SG2NA was first to arise during evolution. Front Biosci Sch Ed. 2014;6:1–15. doi: 10.2741/s409. [DOI] [PubMed] [Google Scholar]
- Tanti GK, Pandey S, Goswami SK. SG2NA enhances cancer cell survival by stabilizing DJ-1 and thus activating Akt. Biochem Biophys Res Commun. 2015;463:524–531. doi: 10.1016/j.bbrc.2015.05.069. [DOI] [PubMed] [Google Scholar]
- Thomas SE, Malzer E, Ordóñez A, et al. p53 and translation attenuation regulate distinct cell cycle checkpoints during endoplasmic reticulum (ER) stress. J Biol Chem. 2013;288:7606–7617. doi: 10.1074/jbc.M112.424655. [DOI] [PMC free article] [PubMed] [Google Scholar]
- Ulianich L, Garbi C, Treglia AS, et al. ER stress is associated with dedifferentiation and an epithelial-to-mesenchymal transition-like phenotype in PC Cl3 thyroid cells. J Cell Sci. 2008;121:477–486. doi: 10.1242/jcs.017202. [DOI] [PubMed] [Google Scholar]
- Wang A, Midura RJ, Vasanji A, et al. Hyperglycemia diverts dividing osteoblastic precursor cells to an adipogenic pathway and induces synthesis of a hyaluronan matrix that is adhesive for monocytes. J Biol Chem. 2014;289:11410–11420. doi: 10.1074/jbc.M113.541458. [DOI] [PMC free article] [PubMed] [Google Scholar]
- Wang F, Wu Y, Quon MJ, et al. ASK1 mediates the teratogenicity of diabetes in the developing heart by inducing ER stress and inhibiting critical factors essential for cardiac development. Am J Physiol Endocrinol Metab. 2015;309:E487–E499. doi: 10.1152/ajpendo.00121.2015. [DOI] [PMC free article] [PubMed] [Google Scholar]
- Wu BX, Hong F, Zhang Y, et al. GRP94/gp96 in cancer: biology, structure, immunology, and drug development. Adv Cancer Res. 2016;129:165–190. doi: 10.1016/bs.acr.2015.09.001. [DOI] [PubMed] [Google Scholar]
- Zhang C, Zhang F. The multifunctions of WD40 proteins in genome integrity and cell cycle progression. J Genomics. 2015;3:40–50. doi: 10.7150/jgen.11015. [DOI] [PMC free article] [PubMed] [Google Scholar]
Associated Data
This section collects any data citations, data availability statements, or supplementary materials included in this article.
Supplementary Materials
(DOCX 11 kb)
(PPTX 4457 kb)