

Abstract
The data presented in this article are related to the research article entitled “Isobarictags for relative and absolute quantitation (iTRAQ) -based proteomics for the investigation of the effect of HuganQingzhi on non-alcoholic fatty liver disease in rats” (Yao et al., 2017) [1]. This article describes the effect of HuganQingzhi on non-alcoholic fatty liver disease in rats at the level of the proteome (HFD: control, HH: control, HH: HFD, respectively). The field dataset is available to criticize or extended analyzes in public.
Specifications Table
| Subject area | Pharmacology |
| More specific subject area | Ethnopharmacology |
| Type of data | Tables, Text file |
| How data was acquired | iTRAQ, LC-MS/MS |
| Data format | Globally normalized quantitation and analysis |
| Experimental factors | Protein was extracted from each group (control, HFD and HH) and quantified with iTRAQ |
| Experimental features | The difference of protein expression level among three groups (control, HFD and HH) |
| Data source location | Guangzhou, China |
| Data accessibility | The Data are available with this article |
Value of the data
-
1.
The data make us better known about the pathogenesis of NAFLD and could be used by other researchers for further study.
-
2.
It is an urgent need to further investigate the proteins expression changes which are associated with the treatment of HQT in HFD-induced NAFLD rats.
-
3.
The data provide deeper insight into many cellular pathways and elucidate the underlying mechanism of the effects of HQT in NAFLD treatment.
1. Data
The original MS/MS file data were performed using the Paragon algorithm [2] as implemented in ProteinPilot Software v4.5. Supplemtary Table 1 lists the data of protein identification and quantification including Uniport Accession, Protein description, Protein unused, Protein mass, Total peptide matches, Sequence Coverages (95%), Unique Peptide Sequence and average fold change of each pair. Supplemtary Table 2 shows the differentially expressed proteins (DEPs) identified by iTRAQ analysis in HFD: control, HH: control, and HH: HFD, respectively. Supplemtary Table 3 lists the pathways, which are annotated in HFD: control, HH: control, and HH: HFD, respectively.
2. Experimental design, materials and methods
Full methodological details are available in [1]. For data on iTRAQ experiments and subsequent bioinformatics analysis, a flow chart related to the associated research article was shown in Fig. 1.
Fig. 1.
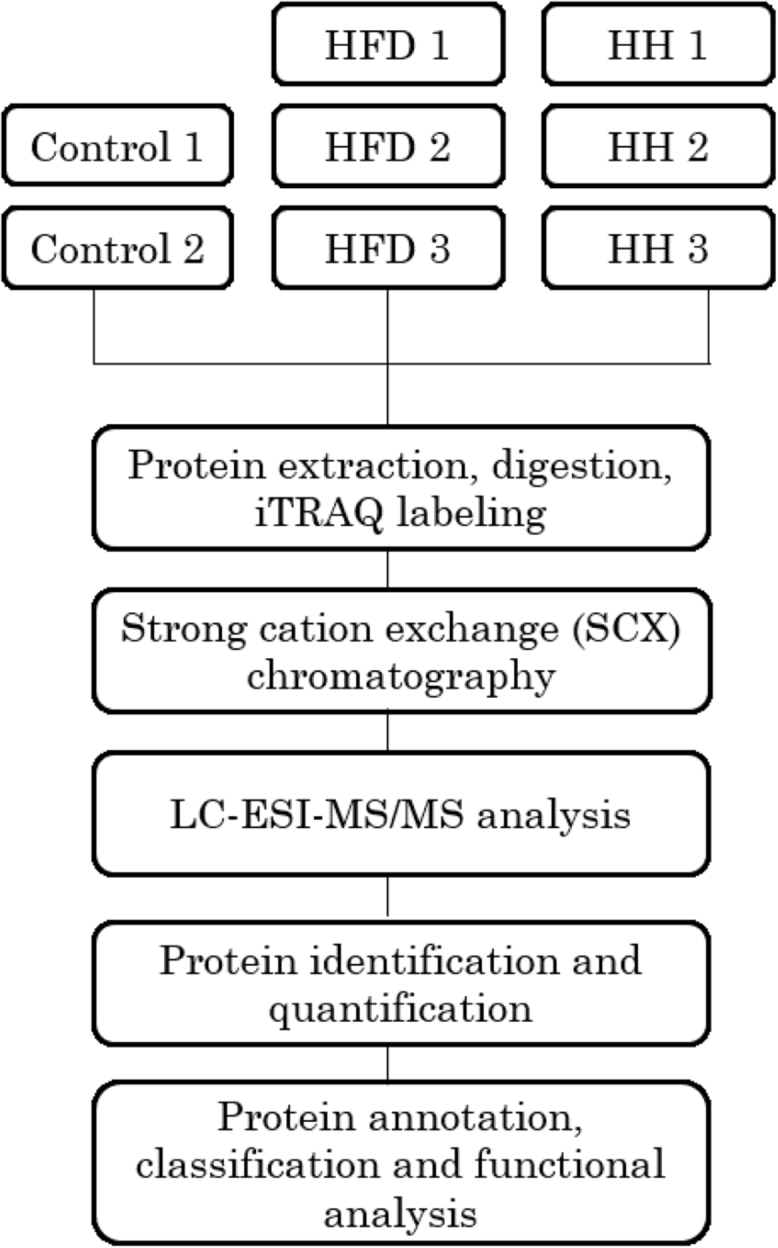
Flow chart of data on iTRAQ experiments and subsequent bioinformatics analysis.
2.1. Research animals and experimental design
All procedures are described in the associated research article [1].
2.2. Protein extraction and digestion and labeling
All procedures are described in the associated research article [1].
2.3. Strong cation exchange (SCX) chromatography
All procedures are described in the associated research article [1].
2.4. Nano-liquid chromatography and mass spectrometry (MS) analysis and data analysis
All procedures are described in the associated research article [1].
Acknowledgements
This research gained support from the National Science Foundation of China (NFSC; No. 81274160), and from the Natural Science Foundation of Guangdong Province (No. S2012010009380).
Footnotes
Transparency data associated with this article can be found in the online version at http://dx.doi.org/10.1016/j.dib.2017.10.027.
Supplementary data associated with this article can be found in the online version at http://dx.doi.org/10.1016/j.dib.2017.10.027.
Transparency document. Supplementary material
Supplementary material
.
Appendix A. Supplementary material
Supplementary material
.
Supplementary material
.
Supplementary material
.
References
- 1.Yao X., Xia F., Tang W., Xiao C., Yang M., Zhou B. Isobarictags for relative and absolute quantitation (iTRAQ) -based proteomics for the investigation of the effect of HuganQingzhi on non-alcoholic fatty liver disease in rats. J. Ethnopharmacol. 2017 doi: 10.1016/j.jep.2017.09.016. In press. [DOI] [PubMed] [Google Scholar]
- 2.Shilov I.V., Seymour S.L., Patel A.A., Loboda A., Tang W.H., Keating S.P., Hunter C.L., Nuwaysir L.M., Schaeffer D.A. The Paragon Algorithm, a next generation search engine that uses sequence temperature values and feature probabilities to identify peptides from tandem mass spectra. Mol. cell Proteom. 2007;6:1638–1655. doi: 10.1074/mcp.T600050-MCP200. [DOI] [PubMed] [Google Scholar]
Associated Data
This section collects any data citations, data availability statements, or supplementary materials included in this article.
Supplementary Materials
Supplementary material
Supplementary material
Supplementary material
Supplementary material