

Abstract
Ertugliflozin is a highly selective and potent inhibitor of the sodium‐glucose cotransporter 2 in development for the treatment of type 2 diabetes mellitus. The glycemic efficacy of sodium‐glucose cotransporter 2 inhibitors such as ertugliflozin depends on glucose filtration through the kidney. This phase 1, open‐label study evaluated the effect of renal impairment on the pharmacokinetics, pharmacodynamics, and tolerability of ertugliflozin (15 mg) in type 2 diabetes mellitus and healthy subjects with normal renal function (estimated glomerular filtration rate not normalized for body surface area ≥90 mL/min) and type 2 diabetes mellitus subjects with mild (60‐89 mL/min), moderate (30‐59 mL/min), or severe (<30 mL/min) renal impairment (n = 36). Blood and urine samples were collected predose and over 96 hours postdose for pharmacokinetic evaluation and measurement of urinary glucose excretion over 24 hours. Log‐linear regression analyses indicated predicted mean area under the concentration‐time curve values for mild, moderate, and severe renal function groups that were ≤70% higher relative to subjects with normal renal function. Generally consistent results were obtained with categorical analysis based on analysis of variance. The increase in ertugliflozin exposure in subjects with renal impairment is not expected to be clinically meaningful. Regression analysis of change from baseline in urinary glucose excretion over 24 hours vs estimated glomerular filtration rate showed a decrease in urinary glucose excretion with declining renal function. A single 15‐mg dose of ertugliflozin was well tolerated in all groups.
Keywords: ertugliflozin, sodium‐glucose cotransporter 2, type 2 diabetes mellitus, renal impairment
Type 2 diabetes mellitus (T2DM) is the leading cause of end‐stage renal disease and carries a significant cost burden, totaling US$20 000 to US$40 000 per person per year.1, 2 A cross‐sectional analysis of multiple United States National Health and Nutrition Examination Survey data from 2007 to 2012 reported an age‐adjusted chronic kidney disease prevalence of 38.3% in adults with T2DM.3
The sodium glucose cotransporter 2 (SGLT2), located in the early section of the proximal tubule, is responsible for the reabsorption of ∼90% of filtered glucose.4 SGLT2 inhibitors reduce renal glucose reabsorption, resulting in increased urinary glucose excretion (UGE), thereby reducing levels of plasma glucose and consequently hemoglobin A1c (HbA1c).5, 6, 7, 8 They also offer additional benefit to subjects with T2DM by reducing blood pressure9 and body weight.10
The glycemic efficacy of SGLT2 inhibitors depends on the amount of glucose filtered through the kidney. Because the filtered glucose load is a function of glomerular filtration rate (GFR) and plasma glucose concentration, impairment of renal function affects the pharmacodynamics (PD) of SGLT2 inhibitors.11 Although phase 3 studies of currently approved SGLT2 inhibitors in patients with stage 3 kidney disease demonstrate a reduction from baseline in HbA1c of approximately 0.3% to 0.4%, this is generally half of the glycemic efficacy observed in patients with normal renal function and a baseline HbA1c of approximately 8%.12, 13, 14 It is uncertain whether the reduced efficacy is solely due to a decrease in filtered glucose load as a function of declining GFR, or whether it is also a result of other underlying comorbidities of renal impairment that may potentially impact treatment response.
Ertugliflozin (PF‐04971729, MK‐8835) is a highly selective and potent SGLT2 inhibitor that is currently being developed for the treatment of patients with T2DM.6, 7, 8 The pharmacokinetics (PK) of ertugliflozin is characterized by rapid absorption following oral administration with median time to maximum concentration (tmax) occurring at approximately 1 hour postdose in the fasted state, dose proportionality in exposure (area under the curve [AUC] and maximum concentration [Cmax]) over the range of 0.5 to 300 mg, and a terminal elimination half‐life (t1/2) of approximately 17 hours (data on file).15, 16 Steady‐state PK was predictable from single‐dose data (data on file), indicating that the PK of ertugliflozin is linear.
Based on human absorption, distribution, metabolism, and excretion studies, the primary clearance of ertugliflozin is known to occur via metabolism.16 Glucuronidation is the major metabolic pathway, with a minor contribution from oxidative metabolism.16 Urinary excretion of unchanged drug accounts for only 1.5% of elimination. The metabolism of ertugliflozin is catalyzed mainly by uridine diphosphate (UDP)‐glucuronosyltransferase‐1A9 (UGT1A9) with additional contribution from UGT2B7.15 The 3‐O‐β‐glucuronide (M5c or PF‐06481944) and 2‐O‐β‐glucuronide (M5a or PF‐06685948) are the major circulating metabolites of ertugliflozin and are pharmacologically inactive.16 As UGT1A9 and UGT2B7 are expressed in renal tubules,17 the kidney is a potential site of ertugliflozin glucuronidation.15 In addition, glucuronide metabolites are excreted renally (approximately 40% of dose).15, 16 Therefore, impairment of renal function could affect the PK as well as the PD of ertugliflozin.
This study sought to evaluate the effect of varying degrees of renal impairment on the PK, PD, safety, and tolerability of ertugliflozin following a single oral dose in subjects with T2DM.
Methods
Study Design
The final protocol and informed consent documentation were reviewed and approved by the New England Institutional Review Board, and all subjects provided signed and dated informed consent. The study was conducted in compliance with the ethical principles originating in, or derived from, the Declaration of Helsinki and in compliance with all International Conference on Harmonisation Good Clinical Practice Guidelines.
This was a phase 1, open‐label, nonrandomized study of a single oral dose of ertugliflozin 15 mg, administered as 3 5‐mg tablets in the fasted state to T2DM and healthy subjects with normal renal function and to T2DM subjects with varying degrees of renal impairment. The 15‐mg dose is the higher of 2 doses (5 mg once daily and 15 mg once daily) evaluated in phase 3 studies.
Eligible subjects were admitted to a clinical research unit in the afternoon/early evening of day –3. All subjects received a single 15‐mg dose of ertugliflozin on day 1 following a 4‐hour fast. While in the clinical research unit, subjects received a standardized diet with a prespecified caloric intake (≤3200 kcal/day) and nutritional composition (approximately 50% carbohydrate, 35% fat, and 15% protein), and maintained water intake of approximately 2 L/day. Healthy subjects abstained from all concomitant medications except those required for the treatment of adverse events. Prior medications for diabetes mellitus were continued throughout the study.
Subjects
A maximum sample size of 40 subjects (8 subjects in each of the mild and moderate renal impairment groups and the healthy subjects group and 6 to 8 subjects in each of the T2DM with severe renal impairment and T2DM with normal renal function groups) was planned. Due to the potential difficulty in recruiting subjects with T2DM with estimated glomerular filtration rate (eGFR) ≥90 mL/min and with eGFR<30 mL/min, the enrollment number in these groups was flexible at 6 to 8 subjects.
Eligible subjects were male or female, aged 18 to 80 years inclusive, with a body mass index of approximately 18 to 40 kg/m2, a total body weight >50 kg, and stable renal function, defined as a ≤20% difference between 2 measurements of serum creatinine obtained on 2 occasions during the screening period, separated by at least 72 hours and up to 14 days.
Subjects were enrolled from 4 centers. Those with T2DM and renal impairment were enrolled first, followed by healthy and T2DM subjects with normal renal function, such that for each subject with normal renal function, age was ±5 years and body weight ±10 kg of the mean of the pooled renal impairment groups. A similar male/female ratio (±2 subjects per sex) was also maintained.
Healthy subjects were defined based on medical history and renal function (mean eGFR ≥90 mL/min at screening) and were demographically comparable with subjects who had impaired renal function. The eGFR value was calculated based on the 4‐variable Modification of Diet in Renal Disease equation18 and was multiplied by each subject's ratio of calculated body surface area (BSA) to a standard BSA of 1.73 m2 to obtain the BSA‐unnormalized eGFR value, in accordance with the European Medicines Agency guidelines on the evaluation of the PK of medicinal products in patients with decreased renal function.19
Subjects with T2DM had a diagnosis per the American Diabetes Association guidelines20 and had an HbA1c measurement <10.5%. They were receiving a stable antihyperglycemic regimen, defined as not starting a new drug or changing dose within 8 weeks prior to administration of ertugliflozin. Antihyperglycemic agents were given 4 hours after ertugliflozin administration on day 1 and at approximately the same time of day during baseline assessment on day –2. Subjects who received other SGLT2 inhibitors within 7 days or 5 half‐lives (whichever was longer) prior to the first dose of ertugliflozin were excluded from this study, and use of these medications during the study was prohibited. For subjects receiving insulin, variations in the daily dose of insulin of up to 10% were permitted. Subjects with T2DM and normal renal function had a mean eGFR ≥90 mL/min at screening. Subjects with T2DM and renal impairment had a reduced eGFR at screening: mild (mean eGFR ≥60 but ≤89 mL/min), moderate (mean eGFR ≥30 but ≤59 mL/min), or severe (mean eGFR <30 mL/min but not requiring dialysis).
Assessments
Pharmacokinetics
Serial blood samples (to obtain plasma) were collected at the following times for measurement of concentrations of ertugliflozin and its metabolites PF‐06481944 and PF‐06685948: predose, then at 0.5, 1, 1.5, 2, 3, 4, 6, 8, 10, 12, 24, 48, 72, and 96 hours postdose, prior to discharge from the clinical research unit on day 5. Plasma samples were analyzed for ertugliflozin, PF‐06481944, and PF‐06685948 concentrations at WuXi Apptec (Shanghai, China) using a validated, sensitive, and specific high‐performance liquid chromatography tandem mass spectrometry (HPLC‐MS/MS) method. The lower limit of quantification was 0.500 ng/mL for ertugliflozin and PF‐06481944, and 0.250 ng/mL for PF‐06685948. Calibration standard responses in plasma were linear over the range of 0.500 to 500 ng/mL for ertugliflozin, 0.500 to 250 ng/mL for PF‐06481944, and 0.250 to 125 ng/mL for PF‐06685948. Analytes were extracted from 100 μL human plasma by protein precipitation with acetonitrile and PF‐05109348, an analogue of ertugliflozin (internal standard). The supernatant was evaporated to dryness under nitrogen and reconstituted with 40% methanol with 2 mg/mL 3‐((3‐cholamidopropyl) dimethylammonio)‐1‐propanesulfonate (CHAPS). The extracted sample was injected into an HPLC column, Kinetex C18, 100 × 2.1 mm, 2.6 μm (Phenomenex, Torrance, California) with gradient mobile phase containing 0.1% formic acid and 2 mM ammonium acetate in water, and 0.1% formic acid in acetonitrile. The retention time was 4.4 minutes, 2.6 minutes, and 3.9 minutes for ertugliflozin, PF‐06481944, and PF‐06685948, respectively. Detection was performed by Sciex API 5000 (SCIEX, Framingham, Massachusetts) in the positive‐ion mode. The multiple reaction‐monitoring ion transition was m/z 437→329 for ertugliflozin, m/z 630→207 for PF‐06481944 and PF‐06685948, and m/z 442→334 for the internal standard. The selectivity of the method toward endogenous compounds, potential interferences, and possible impurities of the internal standard was acceptable, as illustrated by the chromatograms of a blank plasma sample with and without internal standard. The interrun assay accuracy, expressed as percentage relative error for quality control (QC) concentrations, ranged from –2.4% to 3.2% for the low (1.25 ng/mL), geometric medium (12.5 ng/mL), medium (250 ng/mL), high (400 ng/mL), and dilution (2500 ng/mL) QC samples for ertugliflozin, 0.5% to 4.0% for the low (1.25 ng/mL), geometric medium (12.5 ng/mL), medium (125 ng/mL), high (200 ng/mL), and dilution (1250 ng/mL) QC samples for PF‐06481944, and –1.4% to 1.3% for the low (0.625 ng/mL), geometric medium (6.25 ng/mL), medium (62.5 ng/mL), high (100 ng/mL), and dilution (625 ng/mL) QC samples for PF‐06685948. The interrun assay precision, expressed as the between‐day percentage coefficients of variation (%CV) of the mean estimated concentrations of QC samples, was ≤6.8%, ≤7.2%, and ≤7.6% for low, medium, high, and dilution QC concentrations for ertugliflozin, PF‐06481944, and PF‐06685948, respectively. All HPLC‐MS/MS analyses were performed using Analyst Version 1.4.2 (Applied Biosystems, Foster City, California) and Watson Version 7.2.0.02 (Thermo Electron Corporation, Beverly, Massachusetts).
A blood sample (to obtain plasma) was collected at 1 hour postdose for determination of the ertugliflozin unbound fraction using a validated, sensitive, and specific HPLC‐MS/MS method (WuXi AppTec, Shanghai, China), with a lower limit of quantification of 0.250 ng/mL for ertugliflozin. Calibration standard responses in dialysate were linear over the ranges of 0.250 to 250 ng/mL for ertugliflozin. The plasma dialysis was performed using a Thermo Scientific rapid equilibrium dialysis plate (Thermo Fisher Scientific, Waltham, Massachusetts) with 6 hours of incubation. Samples from the equilibrium dialysis (mixture of human plasma and dialysis buffer) were extracted by protein precipitation with acetonitrile and PF‐05109348 (internal standard) for the determination of ertugliflozin. The supernatant was evaporated to dryness under nitrogen and reconstituted with 40% methanol with 2 mg/mL CHAPS then injected on an HPLC‐MS/MS system similar to the conditions previously described for PK plasma concentration measurement of ertugliflozin. The interrun assay accuracy (%RE) for QC concentrations ranged from –0.8% to 3.7% for the low (0.625 ng/mL), geometric medium (6.25 ng/mL), medium (125 ng/mL), and high (200 ng/mL) samples. The interrun assay precision (%CV) of the QC concentrations was ≤7.7% for low, medium, and high dilution QC concentrations.
A urine sample was collected predose (forced void), and during intervals of 0‐4, 4‐8, 8‐12, 12‐24, 24‐48, 48‐72, and 72‐96 hours postdose. Concentrations of ertugliflozin, PF‐06481944, and PF‐06685948 in urine were assayed using a validated, sensitive, and specific HPLC‐MS/MS method (WuXi AppTec, Shanghai, China) with lower limits of quantification of 0.500, 1.00, and 1.00 ng/mL, respectively. Calibration standard responses in urine were linear over the ranges of 0.500 to 250 ng/mL for ertugliflozin, and 1.00 to 500 ng/mL for PF‐06481944 and PF‐06685948. Analytes were extracted from 50 μL human urine by protein precipitation with acetonitrile and PF‐05109348 (internal standard). The supernatant was evaporated to dryness under nitrogen and reconstituted with 40% methanol with 2 mg/mL CHAPS. The extracted sample was injected into an HPLC column, ACQUITY UPLC@BEH130 C18, 100 × 2.1 mm, 1.7 μm (Waters Corp, Milford, Massachusetts) with a gradient mobile phase containing 2 mM ammonium acetate in water, and acetonitrile. The retention time was 4.0 minutes, 10.0 minutes, and 7.4 minutes for ertugliflozin, PF‐06481944, and PF‐06685948, respectively. The internal standard retention time was approximately 9.9 minutes. The mass spectrometry conditions were the same as previously described for the plasma PK samples. The interrun assay accuracy (%RE) for QC concentrations, ranged from –3.5% to 2.0% for the low (1.25 ng/mL), geometric medium (12.5 ng/mL), medium (125 ng/mL), high (200 ng/mL), and dilution (1000 ng/mL) QC samples for ertugliflozin, –0.5% to 5.5% for the low (2.50 ng/mL), geometric medium (25.0 ng/mL), medium (250 ng/mL), high (400 ng/mL), and dilution (2000 ng/mL) QC samples for PF‐06481944 and –4.0% to 3.6% for the low (2.50 ng/mL), geometric medium (25.0 ng/mL), medium (250 ng/mL), high (400 ng/mL), and dilution (2000 ng/mL) QC samples for PF‐06685948. The interrun assay precision (%CV) of the mean estimated concentrations of QC samples, was ≤9.8%, ≤8.5%, and ≤8.0% for low, medium, high, and dilution QC concentrations for ertugliflozin, PF‐06481944, and PF‐06685948, respectively.
The following plasma and urine PK parameters were determined using noncompartmental methods: area under the plasma concentration‐time curve from time 0 to infinity (AUC); peak concentration (Cmax); tmax; terminal‐phase half‐life (t½); apparent oral clearance (CL/F); apparent volume of distribution (Vz/F); and fraction unbound (concentration in buffer at equilibrium/concentration in plasma at equilibrium). The percentage of dose excreted in urine from time 0 to 96 hours postdose (Ae96%) and renal clearance (CLR = Ae96/AUC96, where AUC96 was the area under the plasma concentration‐time profile from time 0 to 96 hours) were also determined. In addition, AUC, Cmax, tmax, t½, CLR, and metabolite‐to‐parent ratio for AUC were determined for the metabolites PF‐06481944 and PF‐06685948. PK parameter values were calculated using a Pfizer‐validated software system, electronic noncompartmental analysis version 2.2.4.
Pharmacodynamics
Urine samples for measurement of glucose concentration were collected predose, then during intervals of 0‐4, 4‐8, 8‐12, 12‐24, 24‐48, 48‐72, and 72‐96 hours postdose. Urine was also collected on day –2 (baseline) during intervals of –48 to –44, –44 to –40, –40 to –36, and –36 to –24 hours prior to dosing. Blood samples were taken for plasma glucose measurements on day –2 (1 hour pre‐ and postfood) at –48, –46, –45, –44, –43, –38, and –37 hours, and then at –24 hours prior to dosing on day 1. Sampling was repeated on day 1 at approximately the same times as on day –2. Urine and plasma glucose were analyzed at a central laboratory (Covance Central Laboratory Services Inc, Indianapolis, Indiana). The PD end point was change from baseline in 24‐hour UGE, determined from timed urine collection. The 24‐hour UGE was calculated as the sum of UGE (0 to 4 hours), UGE (4 to 8 hours), UGE (8 to 12 hours), and UGE (12 to 24 hours). The 24‐hour inhibition of glucose reabsorption (%) was calculated as 100 × UGE (g/24 h)/[eGFR (mL/min) × 24‐hour weighted mean plasma glucose (WMPG) (mg/dL) × 0.0144]. The 24‐hour WMPG was calculated as AUC24/24 h, where AUC24 was area under the plasma glucose concentration‐time curve from 0 to 24 hours postdose using the trapezoidal method. The unit conversion factor 0.0144 was used to make the ratio unitless.
Safety
The safety and tolerability of ertugliflozin were assessed via physical examination, adverse event (AE) monitoring, 12‐lead electrocardiogram, sitting blood pressure and pulse rate, occurrence of hypoglycemic episodes, and measurement of clinical laboratory parameters (hematology, chemistry, and urinalysis). AEs were assessed throughout the study and classified according to the Medical Dictionary for Regulatory Activities, version 17.1, preferred terms. Electrocardiograms were collected at screening, predose on day 1, and postdose on day 5. AEs related to reduced intravascular volume such as hypotension, orthostatic hypotension, and postural dizziness have been observed with administration of other SGLT2 inhibitors, particularly in patients with renal impairment.12 Therefore, both sitting and postural (supine/standing) blood pressure and pulse rate measurements were recorded predose on day 1 and at 1, 2, 4, and 96 hours (day 5) postdose.
Statistical Analysis
Pharmacokinetics
PK parameters for ertugliflozin and its metabolites, PF‐06481944 and PF‐06685948, were summarized descriptively according to renal function group. The potential relationships between ertugliflozin CL/F or AUC and renal function (BSA‐unnormalized and normalized eGFR) were analyzed using regression analysis. Based on the regression analysis, mean AUC (90% confidence interval [CI]) was predicted at the midpoint of the eGFR range for the mild and moderate renal impairment groups (75 mL/min and 45 mL/min, respectively), at 15 mL/min for the severe renal impairment group, and at 105 mL/min (median of the observed values) for the normal renal function groups. In addition, a 1‐way ANOVA was used to compare the natural log–transformed AUC and Cmax for each of the renal impairment groups with that of both T2DM and healthy subjects with normal renal function.
Pharmacodynamics
Urinary glucose excretion and percentage inhibition of glucose reabsorption were summarized and presented according to renal function group. The potential relationship between the change from baseline in 24‐hour UGE and renal function (BSA‐unnormalized eGFR and BSA‐normalized eGFR) in T2DM subjects was analyzed using log‐linear regression. A 1‐way ANOVA was also used to compare the log‐transformed change from baseline in 24‐hour UGE for each of the renal impairment groups (test) to the T2DM with normal renal function group (reference). The change from baseline in 24‐hour UGE values was not corrected for circulating plasma glucose levels in these analyses. Statistical Analysis System (version 9.4) was used for all analyses.
Results
Subject Demographics
All subjects assigned to study treatment received a single 15‐mg dose of ertugliflozin, completed the study, and were analyzed for PK, PD, and safety. Baseline demographics and disease characteristics are presented in Table 1. In total, 36 subjects received ertugliflozin. This included T2DM subjects with normal renal function (n = 6), T2DM subjects with mild (n = 8), moderate (n = 8), and severe (n = 6) renal impairment, and healthy subjects with normal renal function (n = 8). There were 23 male and 13 female subjects, and the majority of subjects were white. Subject age ranged from 49 to 76 years, with mean values in each group ranging from 61.2 to 66.4 years. Subject body mass index ranged from 19.7 to 40.5 kg/m2, with mean values in each group ranging from 28.3 to 35.1 kg/m2.
Table 1.
Baseline Demographics and Disease Characteristics of the Study Population (N = 36)
| T2DM Subjects | |||||
|---|---|---|---|---|---|
| Normal Renal Function (n = 6) | Mild Renal Impairment (n = 8) | Moderate Renal Impairment (n = 8) | Severe Renal Impairment (n = 6) | Healthy Subjects With Normal Renal Function (n = 8) | |
| Sex, n | |||||
| Male | 5 | 3 | 4 | 6 | 5 |
| Female | 1 | 5 | 4 | 0 | 3 |
| Mean age, years (SD) | 63.2 (3.5) | 66.4 (2.4) | 65.8 (7.9) | 61.2 (10.3) | 64.3 (3.9) |
| Range | 60‐68 | 63‐70 | 54‐76 | 49‐76 | 60‐70 |
| Race, n | |||||
| White | 6 | 7 | 8 | 4 | 6 |
| Black | 0 | 1 | 0 | 2 | 2 |
| Mean HbA1c, % (SD) | 7.9 (1.42) | 7.1 (1.49) | 7.1 (0.76) | 7.1 (1.13) | 5.5 (0.19) |
| Range | 6.0‐10.1 | 4.6‐9.1 | 6.1‐8.3 | 6.1‐9.3 | 5.2‐5.8 |
| Mean weight, kg (SD) | 95.2 (4.7) | 87.8 (18.1) | 86.3 (18.8) | 105.5 (19.3) | 86.0 (3.5) |
| Range | 88.6‐102.6 | 58.9‐113.8 | 65.4‐128.2 | 86.2‐132.2 | 82.6‐93.2 |
| Mean BMI,a kg/m2 (SD) | 31.9 (3.9) | 31.9 (5.7) | 32.3 (4.4) | 35.1 (4.7) | 28.3 (2.5) |
| Range | 28.0‐38.6 | 19.7‐37.7 | 26.2‐40.4 | 29.6‐40.5 | 24.0‐32.3 |
| Mean BSA‐unnormalized eGFR at screening,b mL/min (SD) | 111.1 (15.61) | 72.3 (4.52) | 40.3 (4.30) | 20.9 (8.38) | 102.6 (10.04) |
| Range | 94.9‐138.9 | 66.3‐79.4 | 32.9‐46.0 | 9.2‐29.6 | 91.2‐116.8 |
| Prior and concomitant treatments for diabetes mellitus, n | |||||
| Insulin | 0 | 0 | 8 | 7 | … |
| Sulfonylureas | 2 | 1 | 3 | 1 | … |
| Metformin | 6 | 7 | 0 | 0 | … |
| Sitagliptin plus Metforminc | 0 | 1 | 0 | 0 | … |
| Sitagliptin | 0 | 0 | 1 | 0 | … |
Normal renal function, eGFR ≥90 mL/min; mild renal impairment, eGFR 60‐89 mL/min; moderate renal impairment, eGFR 30‐59 mL/min; severe renal impairment eGFR <30 mL/min. BMI, body mass index; BSA, body surface area; eGFR, estimated glomerular filtration rate; HbA1c, hemoglobin A1c; n, number of subjects; …, not applicable; SD, standard deviation; T2DM, type 2 diabetes mellitus.
aBMI was calculated as weight [kg]/(height [cm] × 0.01)2.
bAverage of the 2 screening eGFR values that were based on serum creatinine values obtained on 2 occasions separated by at least 72 hours to 14 days during the screening period.
cAs a fixed‐dose combination.
Pharmacokinetic Results
Ertugliflozin PK parameters were similar in healthy subjects and T2DM subjects with normal renal function (Figure 1 and Table 2). Therefore, for PK analyses, data from both of these normal renal function groups were combined to serve as a pooled reference. After a single oral dose of ertugliflozin 15 mg, Cmax was achieved rapidly, with a median tmax of 1.00 to 1.51 hours across all groups (Table 2). There were no clinically meaningful differences in the geometric mean Cmax values among the different renal function groups. Following attainment of Cmax, plasma concentrations exhibited a multiexponential decline over time. Mean t½ estimates for ertugliflozin were slightly longer in subjects with T2DM and mild, moderate, or severe renal impairment (approximately 23‐26 hours) compared with T2DM and healthy subjects with normal renal function (approximately 15‐18 hours). CL/F and CLR decreased with decreasing renal function for all renal impairment groups. The Ae96% was approximately 1% in subjects with normal renal function and decreased with decreasing renal function. There were no clinically meaningful differences in mean unbound fraction values of ertugliflozin among the various renal function groups (Table 2).
Figure 1.
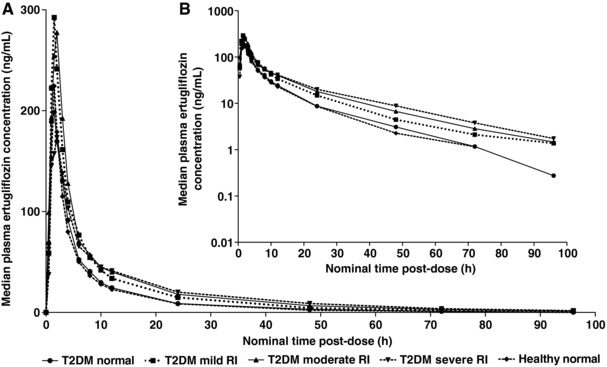
Median plasma ertugliflozin concentration‐time profiles following a single 15‐mg oral dose by renal function group. Plots show linear (A) and semilogarithmic (B) scales, respectively. Summary statistics were calculated by setting concentration values below the LLOQ to 0. The LLOQ was 0.500 ng/mL. Renal function groups were based on BSA‐unnormalized eGFR. Normal renal function, eGFR ≥90 mL/min; mild renal impairment, eGFR 60‐89 mL/min; moderate renal impairment, eGFR 30‐59 mL/min; severe renal impairment eGFR <30 mL/min. BSA indicates body surface area; eGFR, estimated glomerular filtration rate; h, hour; LLOQ, lower limit of quantification; RI, renal impairment; T2DM, type 2 diabetes mellitus.
Table 2.
Descriptive Summarya of Ertugliflozin Pharmacokinetic Parameter Values by Renal Function Group
| T2DM Subjects | |||||
|---|---|---|---|---|---|
| Normal Renal Function | Mild Renal Impairment | Moderate Renal Impairment | Severe Renal Impairment | Healthy Subjects With Normal Renal Function | |
| n | 6 | 8 | 8 | 6 | 8 |
| AUC (ng·h/mL) | 1199 (42) | 1908 (28) | 2075 (19) | 1895 (23) | 1236 (27) |
| CL/F (mL/min) | 209 (42) | 131 (28) | 120 (19) | 132 (23) | 202 (27) |
| Cmax (ng/mL) | 216 (35) | 313 (30) | 306 (23) | 196 (28) | 219 (26) |
| tmax (h) | 1.00 (1.00‐1.50) | 1.50 (1.00‐2.00) | 1.50 (0.50‐2.00) | 1.51 (0.50‐3.02) | 1.00 (1.00‐2.00) |
| t½ (h) | 14.6 ± 6.4 | 25.9 ± 14.0 | 22.9 ± 7.4 | 24.2 ± 6.0 | 17.7± 3.5 |
| Vz/F (L) | 240 (53) | 255 (50) | 228 (27) | 269 (41) | 305 (39) |
| fu | 0.0344 (3) | 0.0346 (8) | 0.0380 (6) | 0.0411 (9) | 0.0348 (4) |
| Ae96 (%) | 0.995 (55) | 0.720 (54) | 0.646 (21) | 0.389 (40) | 0.821 (48) |
| CLR (mL/min) | 2.09 (28) | 0.99 (45) | 0.80 (34) | 0.54 (23) | 1.68 (33) |
Normal renal function, eGFR ≥90 mL/min; mild renal impairment, eGFR 60‐89 mL/min; moderate renal impairment, eGFR 30‐59 mL/min; severe renal impairment eGFR <30 mL/min. %CV, percentage coefficient of variation; Ae96, percentage of dose recovered unchanged in urine from 0 to 96 hours postdose; AUC, area under the plasma concentration‐time profile from time 0 extrapolated to infinite time; CLR, renal clearance; CL/F, apparent clearance; Cmax, maximum observed concentration; fu, fraction unbound; h, hour; n, number of subjects; SD, standard deviation; tmax, time for Cmax, t½, terminal half‐life; Vz/F, apparent volume of distribution following oral administration.
aGeometric mean (geometric %CV) for all except median (range) for tmax; arithmetic mean (±SD) for t½; and arithmetic mean (%CV) for fu.
Regression analyses of ertugliflozin AUC and CL/F vs BSA‐unnormalized eGFR are presented in Figures 2 and 3, respectively. The lack of a strong linear relationship between ertugliflozin CL/F and eGFR was possibly due to the minimal renal clearance of ertugliflozin. Because both plots showed similar scatter in the data, log‐linear regression analyses of AUC vs eGFR were used to estimate the changes in exposure as a function of eGFR. These are presented in Figure 2. The predicted mean (90%CI) AUC values for subjects with normal renal function (eGFR = 105 mL/min), mild (eGFR = 75 mL/min), moderate (eGFR = 45 mL/min), and severe (eGFR = 15 mL/min) renal impairment were 1340 (1194‐1503) ng·h/mL, 1585 (1461‐1719) ng·h/mL, 1875 (1698‐2071) ng·h/mL, and 2219 (1907‐2581) ng·h/mL, respectively. The predicted mean AUC values in renal impairment groups were ≤70% higher relative to the mean AUC from subjects with normal renal function. Additionally, increases in AUC values estimated from predicted CL/F values derived from linear regression analyses of CL/F vs BSA‐unnormalized eGFR were similar to those estimated from log‐linear regression analyses of AUC versus BSA‐unnormalized eGFR (results not shown). Consistent results were also obtained with log‐linear regression analysis of AUC vs BSA‐normalized eGFR (results not shown).
Figure 2.
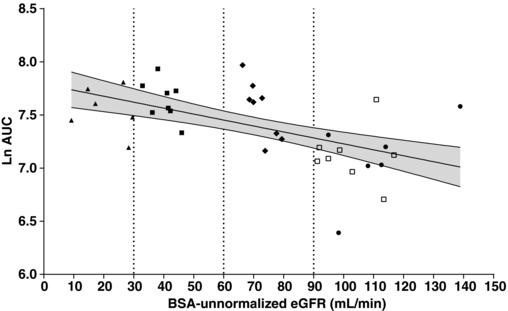
Regression and 90%CI of Ln AUC vs BSA‐unnormalized eGFR after oral administration of ertugliflozin in subjects with varying degrees of renal function. R2 = 0.3142; Slope P‐value = .0004. Vertical lines represent the renal function group cutoff values. The solid line is the predicted line of the response variable. The shadowed area is the 90% confidence region of the response variable. AUC indicates area under the plasma concentration‐time profile from time 0 extrapolated to infinite time; BSA, body surface area; CI, confidence interval; eGFR, estimated glomerular filtration rate; Ln, natural logarithm; RI, renal impairment; T2DM, type 2 diabetes mellitus. Key to symbols: circles, T2DM with normal renal function (eGFR ≥90 mL/min); diamonds, T2DM with mild RI (eGFR 60‐89 mL/min); closed squares, T2DM with moderate RI (eGFR 30‐59 mL/min); triangles, T2DM with severe RI (eGFR <30 mL/min); open squares, healthy normal (eGFR ≥90 mL/min).
Figure 3.
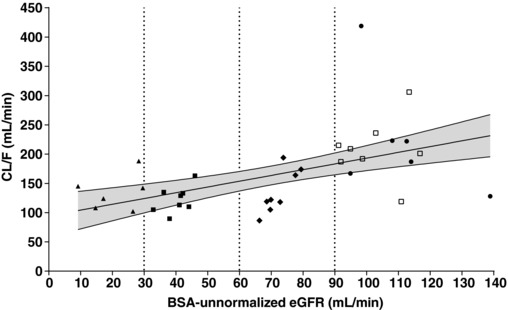
Regression and 90%CI of CL/F vs BSA‐unnormalized eGFR after oral administration of ertugliflozin in subjects with varying degrees of renal function. R2 = 0.2730; Slope P‐value = .0011. Vertical lines represent the renal function group cutoff values. The solid line is the predicted line of the response variable. The shadowed area is the 90% confidence region of the response variable. BSA indicates body surface area; CL/F, apparent clearance; CI, confidence interval; eGFR, estimated glomerular filtration rate; RI, renal impairment; T2DM, type 2 diabetes mellitus. Key to symbols: circles, T2DM with normal renal function (eGFR ≥90 mL/min); diamonds, T2DM with mild RI (eGFR 60‐89 mL/min); closed squares, T2DM with moderate RI (eGFR 30‐59 mL/min); triangles, T2DM with severe RI (eGFR <30 mL/min); open squares, healthy normal (eGFR ≥90 mL/min).
Based on the 1‐way ANOVA, the ratios of test/reference (90%CI), where the reference was the pooled normal renal function group, of ertugliflozin AUC were 1.56 (1.28‐1.91)‐fold for mild renal impairment; 1.70 (1.39‐2.08)‐fold for moderate renal impairment; and 1.55 (1.24‐1.94)‐fold for severe renal impairment. Generally consistent results were obtained with a categorical analysis after reallocation of subjects to renal function groups based on BSA‐normalized eGFR (results not shown). Both regression and categorical analyses indicated that the mean increases in AUC in T2DM subjects with renal impairment were ≤70% higher.
PK parameter values for metabolites PF‐06481944 and PF‐06685948 are summarized in Table 3. After administration of ertugliflozin, plasma concentrations of metabolites peaked rapidly with a median tmax range of 2 to 4 hours across all groups. The AUC values for the glucuronide metabolites were higher in the renal impairment groups than in the normal renal function group. Mean t½ estimates for both metabolites were slightly longer in T2DM subjects with mild, moderate, or severe renal impairment (approximately 22‐25 hours) compared with those in T2DM subjects and healthy subjects with normal renal function (approximately 15‐18 hours). CLR of metabolites decreased with decreasing renal function.
Table 3.
Descriptive Summarya of PF‐06481944 and PF‐06685948 Pharmacokinetic Parameter Values by Renal Function Group
| T2DM Subjects | ||||||
|---|---|---|---|---|---|---|
| PK Parametera | Normal Renal Function | Mild Renal Impairment | Moderate Renal Impairment | Severe Renal Impairment | Healthy Subjects With Normal Renal Function | |
| PF‐06481944 | n | 6 | 8 | 8 | 6 | 8 |
| AUC, ng·h/mL | 1559 (21) | 2620 (34) | 3668 (56) | 2742 (41) | 1113 (32) | |
| Cmax, ng/mL | 218 (18) | 309 (30) | 359 (28) | 219 (33) | 169 (34) | |
| tmax, h | 2.00 (1.00‐3.00) | 2.00 (1.50‐4.00) | 3.00 (1.50‐3.00) | 3.00 (1.50‐4.00) | 2.00 (1.50‐3.00) | |
| t½, h | 16.7 ± 9.5 | 22.0 ± 12.2 | 23.3 ± 6.2 | 22.8 ± 5.9 | 17.5 ± 5.7 | |
| CLR, mL/min | 76.28 (24) | 38.73 (58) | 17.67 (56) | 10.27 (80) | 94.53 (25) | |
| MRAUCinf b | 0.93 (39) | 0.98 (45) | 1.26 (52) | 1.03 (37) | 0.64 (29) | |
| PF‐06685948 | n | 6 | 8 | 8 | 6 | 8 |
| AUC, ng·h/mL | 384 (26) | 604 (39) | 951 (75) | 975 (53) | 338 (27) | |
| Cmax, ng/mL | 44 (22) | 54 (17) | 63 (42) | 46 (35) | 44 (24) | |
| tmax, h | 2.00 (1.50‐3.00) | 3.00 (2.00‐4.03) | 4.00 (2.00‐4.00) | 3.51 (3.00‐4.02) | 2.00 (2.00‐3.00) | |
| t½, h | 14.9 ± 7.8 | 21.7 ± 11.3 | 22.5 ± 5.3 | 25.2 ± 10.4 | 15.7 ± 4.7 | |
| CLR, mL/min | 41.82 (24) | 22.50 (45) | 11.95 (49) | 5.78 (43) | 41.42 (31) | |
| MRAUCinf | 0.23 (34) | 0.23 (35) | 0.33 (82) | 0.37 (36) | 0.19 (25) | |
Normal renal function, eGFR ≥90 mL/min; mild renal impairment, eGFR 60‐89 mL/min; moderate renal impairment, eGFR 30–59 mL/min; severe renal impairment eGFR <30 mL/min. %CV, percentage coefficient of variation; AUC, area under the plasma concentration‐time profile from time 0 extrapolated to infinite time; CLR, renal clearance; Cmax, maximum observed concentration; h, hour; MRAUCinf, metabolite‐to‐parent ratio for AUC; n, number of subjects; SD, standard deviation; tmax, time for Cmax; t½, terminal half‐life.
aGeometric mean (geometric %CV) for all except median (range) for tmax and arithmetic mean (±SD) for t½.
bPF‐06481944 and PF‐06685948 data are corrected for molecular weight (ng to nmol; molecular weight = 613.01 for both). Ertugliflozin data are corrected for molecular weight (ng to nmol; molecular weight = 463.88).
Pharmacodynamic Results
Ertugliflozin, at a dose of 15 mg, induced higher 24‐hour UGE in T2DM subjects with normal renal function (68.1 g) compared with healthy subjects (45.8 g) (Table 4), which was expected given the higher circulating glucose levels in T2DM subjects. The change from baseline in 24‐hour UGE decreased with declining renal function (Table 4, Figure 4). The 24‐hour UGE in T2DM subjects with mild, moderate, and severe renal impairment was approximately 53%, 42%, and 15% of the median 24‐hour UGE in T2DM subjects with normal renal function, respectively. Based on the log‐linear regression of change from baseline in 24‐hour UGE vs BSA‐unnormalized eGFR, the predicted mean change from baseline in 24‐hour UGE values (90%CI) on day 1 for T2DM subjects with normal renal function (eGFR = 105 mL/min), mild (eGFR = 75 mL/min), moderate (eGFR = 45 mL/min), and severe (eGFR = 15 mL/min) renal impairment were 68.8 g (49.05‐96.63), 38.9 g (31.17‐48.53), 22.0 g (17.57‐27.48), and 12.4 g (8.81‐17.50), respectively. Generally similar results were obtained with log‐linear regression analysis of change from baseline in 24‐hour UGE vs BSA‐normalized eGFR (results not shown).
Table 4.
Change From Baseline to Day 1 in 24‐hour Urinary Glucose Excretion (g)
| T2DM Subjects | |||||
|---|---|---|---|---|---|
| Normal Renal Function | Mild Renal Impairment | Moderate Renal Impairment | Severe Renal Impairment | Healthy Subjects With Normal Renal Function | |
| n | 6 | 8 | 8 | 6 | 8 |
| Geometric mean | 72.31 | 35.98 | 27.55 | 10.09 | 46.33 |
| (Geometric %CV) | (30) | (113) | (68) | (57) | (31) |
| Mean (SD) | 75.12 (24.36) | 48.67 (37.72) | 32.64 (21.32) | 11.29 (5.81) | 48.16 (14.04) |
| Median | 68.1 | 36.4 | 28.8 | 10.3 | 45.8 |
| Range | 51.5‐120.5 | 6.3‐119.9 | 13.1‐77.2 | 4.9‐20.7 | 27.4‐70.0 |
Normal renal function, eGFR ≥90 mL/min; mild renal impairment, eGFR 60‐89 mL/min; moderate renal impairment, eGFR 30‐59 mL/min; severe renal impairment eGFR <30 mL/min. %CV, percentage coefficient of variation; n, number of subjects contributing to the summary statistics; SD, standard deviation; T2DM, type 2 diabetes mellitus.
Figure 4.
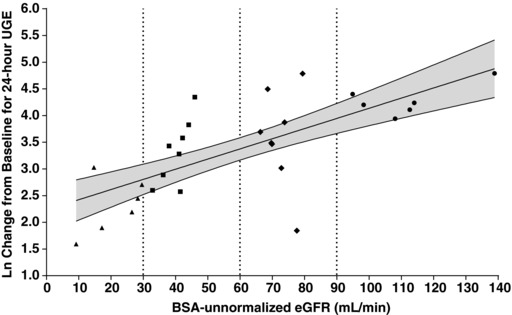
Plot of Ln change from baseline for 24‐hour urinary glucose excretion vs BSA‐unnormalized eGFR in subjects with T2DM after administration of a single 15‐mg oral dose of ertugliflozin. R2 = 0.5036; Slope P‐value < .0001. The solid line is the predicted line of the Ln (change from baseline in 24‐hour UGE). The shadowed area is the 90% confidence region for the Ln (change from baseline in 24‐hour UGE). Vertical lines represent the renal function group cutoff values. BSA indicates body surface area; eGFR, estimated glomerular filtration rate; Ln, natural logarithm; RI, renal impairment; T2DM, type 2 diabetes mellitus; UGE, urinary glucose excretion. Key to symbols: circles, T2DM with normal renal function (eGFR ≥90 mL/min); diamonds, T2DM with mild RI (eGFR 60‐89 mL/min); closed squares, T2DM with moderate RI (eGFR 30‐59 mL/min); triangles, T2DM with severe RI (eGFR <30 mL/min).
Based on the 1‐way ANOVA, the changes from baseline in 24‐hour UGE (90%CI) in the normal, mild, moderate, and severe renal impairment groups were 72.3 g (45.84‐114.07), 36.0 g (24.24‐53.39), 27.6 g (18.56‐40.89), and 10.1 g (6.39‐15.91), respectively. The geometric mean ratios (renal impairment/normal renal function) (90%CI) in the mild, moderate, and severe renal impairment groups were 49.8% (27.22‐90.93), 38.1% (20.85‐69.64), and 14.0% (7.32‐26.58), respectively, of that in the T2DM normal renal function group (72.3 g). The mean baseline HbA1c value and baseline WMPG were higher in T2DM subjects with normal renal function relative to those with renal impairment (baseline HbA1c, 7.9% vs 7.1%; baseline WMPG 183 mg/dL vs 147‐155 mg/dL), which could have resulted in higher UGE in the T2DM subjects with normal renal function. Because the change in 24‐hour UGE results was not corrected for baseline plasma glucose levels, it is possible that the relative ratio of UGE in the renal impairment groups vs the normal‐renal‐function group is slightly lower than would be expected if baseline HbA1c or WMPG values were similar across all groups.
The geometric mean change from baseline in 24‐hour percentage inhibition of glucose reabsorption on day 1 was 29.19% and 33.34% in healthy subjects and subjects with T2DM and normal renal function, respectively, and 25.58%, 28.84%, and 24.25% for the subjects with T2DM and mild, moderate, and severe renal impairment, respectively.
Safety
Ertugliflozin was well tolerated in all renal function groups; there were no deaths, serious AEs, severe AEs, or temporary or permanent discontinuations due to AEs. There were no abnormal laboratory findings or changes in vital signs (including postural changes) or ECG findings of clinical significance, and none was reported as an AE.
All AEs were mild in intensity. Hypoglycemia was experienced by 3 subjects: 1 subject in the T2DM mild renal impairment group and 2 subjects in the T2DM severe renal impairment group. The subject with mild renal impairment was receiving glyburide, and the 2 subjects in the severe renal impairment group were both receiving long‐acting insulin (insulin detemir or insulin glargine). With the exception of hypoglycemia, all other treatment‐emergent AEs were sporadic and experienced by only 1 subject across the various renal function groups.
Discussion
Renal impairment is a common comorbidity in patients with T2DM.3, 21 It is therefore important to investigate if the PK of investigational therapeutic agents is altered among subjects with renal impairment. Moreover, in the case of SGLT2 inhibitors, glycemic efficacy is related to renal function, as this impacts the amount of glucose filtered through the kidney. Therefore, this study evaluated the PK, PD, safety, and tolerability of a single 15‐mg oral dose of ertugliflozin in healthy subjects and in subjects with T2DM with normal renal function or varying degrees of renal impairment.
Ertugliflozin PK was similar between healthy subjects and T2DM subjects with normal renal function. Linear regression and ANOVA analyses indicated that the increase in exposure of ertugliflozin in subjects with mild, moderate, or severe renal impairment is ≤70% higher compared with subjects with normal renal function. The lack of a strong linear relationship between ertugliflozin CL/F vs eGFR is believed to be due to minimal renal clearance of ertugliflozin. Additionally, as plots of CL/F vs eGFR and AUC vs eGFR showed similar scatter in the data, log‐linear regression analysis of AUC vs eGFR was used to estimate the changes in exposure as a function of eGFR. Exposure estimates derived from ANOVA were generally consistent with those from the log‐linear regression analysis. In phase 1 studies (data on file) and phase 2 studies,9, 10 oral doses of ertugliflozin as high as 300 mg (single dose), 100 mg once daily (up to 14 days), and 25 mg once daily (up to 12 weeks) were well tolerated with a safety profile that supported further development. Therefore, based on the current understanding of the safety profile for ertugliflozin, the observed increase in exposure in patients with renal impairment is not anticipated to be clinically meaningful, and thus, no dose adjustment of ertugliflozin based on PK for patients with renal impairment is necessary.
The renal clearance and percentage of ertugliflozin excreted unchanged in urine decreased with decreasing renal function, but the Ae96 was less than 1% in all groups, consistent with previous results demonstrating minimal urinary excretion of unchanged drug.15, 16 Therefore, the increase in ertugliflozin exposure in subjects with impaired renal function cannot be explained solely by an impact on renal excretion of unchanged ertugliflozin. The increased exposure of ertugliflozin with declining renal function may occur due to changes in nonrenal (hepatic) clearance and/or decreased UGT‐mediated renal metabolism of ertugliflozin. The increased exposure of the glucuronide metabolites in the renal impairment groups is likely due to reduced elimination of glucuronides in urine, as reflected by the renal clearance values of the glucuronides.
As expected from the mechanism of action of ertugliflozin, the change from baseline in 24‐hour UGE decreased with declining renal function due to a decrease in the filtered glucose load. However, there was still considerable glucosuria in subjects with mild and moderate renal impairment. The percentage inhibition of glucose reabsorption was similar across the various renal function groups, suggesting that inhibition of SGLT2‐mediated glucose transport was independent of renal function and that the decrease in UGE was driven mainly by a reduction in GFR. For this drug class, the pharmacodynamic response is dependent on the filtered glucose load; therefore, a typical exposure‐response relationship could be established only if renal function remained constant. With changing renal function, the pharmacodynamic response is not driven by exposure, and hence an exposure‐response relationship could not be characterized and was therefore not attempted in this study.
Patients requiring dialysis were excluded from the current study. Although subjects with severe renal impairment were included in the study to characterize the relationship of eGFR with exposure and with UGE, it is unlikely that ertugliflozin will be used in this population because of the expected lack of efficacy of SGLT2 inhibitors in patients with severe renal impairment.12, 22 Use of all currently approved SGLT2 inhibitors is contraindicated in patients with severe renal impairment and end‐stage renal disease or those on dialysis.
In this study, the eGFR was calculated based on the Modification of Diet in Renal Disease equation, which generally adjusts for BSA. However, in accordance with the European Medicines Agency guidelines, eGFR values of subjects in this study were calculated as BSA‐unnormalized values.19 Factors including age, sex, weight, and race can affect eGFR, and estimating equations based on measurement of serum creatinine as a filtration marker incorporate these parameters to reduce their limitations.23 However, irrespective of the estimation method used, there is always a degree of variability in the estimation of GFR.
The results of this study suggest that ertugliflozin may be used without dose modification in T2DM patients with mild and moderate renal impairment. This conclusion is based on the modest (≤70%) increase in ertugliflozin exposure in patients with renal impairment. As this phase 1 study enrolled only a small number of subjects in each of the renal function groups and evaluated a PD end point (24‐hour UGE) instead of the longer‐term efficacy end point of HbA1c, a thorough assessment of the benefit‐risk profile of ertugliflozin in this population awaits the results of a longer‐term phase 3 study in patients with moderate renal impairment (ClinicalTrials.gov Identifier: NCT01986855).
The safety and tolerability of ertugliflozin in this study are comparable with those observed in previous ertugliflozin studies.6, 7, 8, 10, 16, 24, 25, 26, 27 Ertugliflozin was well tolerated in all renal function groups: all AEs were mild in intensity, and the incidence of hypoglycemia was low.
Conclusions
Although systemic exposure of ertugliflozin was higher in T2DM subjects with mild, moderate, or severe renal impairment compared with that in subjects with normal renal function, the mean increases were ≤70% higher and are not anticipated to be clinically meaningful. Compared with subjects with T2DM and normal renal function, the change from baseline in 24‐hour UGE in subjects with T2DM and mild, moderate, or severe renal impairment decreased with declining renal function. The results of this study are particularly pertinent for the treatment of T2DM subjects with mild or moderate renal impairment, in whom substantial UGE was observed despite the presence of renal impairment. A single 15‐mg oral dose of ertugliflozin was well tolerated in both healthy subjects and T2DM subjects with normal renal function and also in T2DM subjects with varying degrees of renal impairment.
Acknowledgments
This study was funded by Merck Sharp & Dohme Corp., a subsidiary of Merck & Co., Inc., Kenilworth, NJ USA and Pfizer Inc. We thank Lata Maganti, PhD, of Merck & Co., Inc., and Kyle Matschke, MAS, of Pfizer for reviewing the design and statistical analysis results. We also thank Robert J. Fountaine for his substantial contributions to the review, analysis, and interpretation of clinical safety data. Medical writing support was provided by Katy Beck, PhD, of Engage Scientific Solutions (Horsham, UK) and was funded by Pfizer.
Disclosures and Conflicts of Interest
V. Sahasrabudhe, S.G. Terra, D. Saur, A. Hickman, H. Shi, and M. O'Gorman are employees of Pfizer and Pfizer stock owners. Z. Zhou is an employee of Merck & Co., Inc., and a Merck & Co., Inc., stock owner. D.L. Cutler was an employee of Merck & Co., Inc., at the time of study conduct and is a Merck & Co., Inc., stock owner. This study was cosponsored by Merck & Co., Inc., Kenilworth, NJ, and Pfizer Inc.
Author Contributions
V. Sahasrabudhe, S.G. Terra, A. Hickman, and D.L. Cutler were involved in the study design, analysis, and interpretation of data, drafting of the article, and provided final approval for publication. D. Saur was involved in acquisition of data, analysis and interpretation of data, drafting of the article, and provided final approval for publication. Z. Zhou made a substantial contribution to the analysis and interpretation of data, was involved in drafting the article, and provided final approval for publication. M. O'Gorman completed the noncompartmental pharmacokinetic analysis of the study, was involved in drafting the article, and provided final approval for publication. H. Shi was involved in the pharmacokinetic assay and data acquisition, drafting of the article, and provided final approval for publication.
ClinicalTrials.gov Identifier: NCT01948986
References
- 1. de Boer IH, Rue TC, Hall YN, et al. Temporal trends in the prevalence of diabetic kidney disease in the United States. JAMA. 2011;305:2532–2539. [DOI] [PMC free article] [PubMed] [Google Scholar]
- 2. Tuttle KR, Bakris GL, Bilous RW, et al. Diabetic kidney disease: a report from an ADA Consensus Conference. Am J Kidney Dis. 2014;64:510–533. [DOI] [PubMed] [Google Scholar]
- 3. Wu B, Bell K, Stanford A, et al. Understanding CKD among patients with T2DM: prevalence, temporal trends, and treatment patterns—NHANES 2007‐2012. BMJ Open Diabetes Res Care. 2016;4:e000154. [DOI] [PMC free article] [PubMed] [Google Scholar]
- 4. Wright EM, Loo DD, Hirayama BA. Biology of human sodium glucose transporters. Physiol Rev. 2011;91:733–794. [DOI] [PubMed] [Google Scholar]
- 5. Abdul‐Ghani MA, Norton L, DeFronzo RA. Renal sodium‐glucose cotransporter inhibition in the management of type 2 diabetes mellitus. Am J Physiol Renal Physiol. 2015;309:F889–F900. [DOI] [PMC free article] [PubMed] [Google Scholar]
- 6. Terra SG, Focht K, Davies M, et al. Phase III, efficacy and safety study of ertugliflozin monotherapy in people with type 2 diabetes mellitus inadequately controlled with diet and exercise alone. Diabetes Obes Metab. 2017;19:721–728. [DOI] [PubMed] [Google Scholar]
- 7. Eldor RR, Golm G, Huyck S, et al. Effect of ertugliflozin plus sitagliptin on glycemic control vs. either treatment alone in subjects with T2DM inadequately controlled with metformin. Paper presented at: 76th Scientific Sessions of the American Diabetes Association (ADA); June 10‐14, 2016; New Orleans, LA.
- 8. Lauring BER, Liu J, DaGogo‐Jack S, et al. Efficacy and safety of ertugliflozin in subjects with T2DM inadequately controlled on the dual combination of metformin and sitagliptin: the VERTIS SITA2 trial. Paper presented at: 52nd Annual Meeting of the European Association for the Study of Diabetes (EASD); September 12‐16, 2016; Munich, Germany.
- 9. Amin NB, Wang X, Mitchell JR, et al. Blood pressure‐lowering effect of the sodium glucose co‐transporter‐2 inhibitor ertugliflozin, assessed via ambulatory blood pressure monitoring in patients with type 2 diabetes and hypertension. Diabetes Obes Metab. 2015;17:805–808. [DOI] [PubMed] [Google Scholar]
- 10. Amin NB, Wang X, Jain SM, et al. Dose‐ranging efficacy and safety study of ertugliflozin, a sodium‐glucose co‐transporter 2 inhibitor, in patients with type 2 diabetes on a background of metformin. Diabetes Obes Metab. 2015;17:591‐598. [DOI] [PubMed] [Google Scholar]
- 11. Gilbert RE. SGLT‐2 inhibition in patients with kidney disease. Diabetes Metab. 2014;40:S23–S27. [DOI] [PubMed] [Google Scholar]
- 12. Yale JF, Bakris G, Cariou B, et al. Efficacy and safety of canagliflozin in subjects with type 2 diabetes and chronic kidney disease. Diabetes Obes Metab. 2013;15:463–473. [DOI] [PMC free article] [PubMed] [Google Scholar]
- 13. Kohan DE, Fioretto P, Tang W, List JF. Long‐term study of patients with type 2 diabetes and moderate renal impairment shows that dapagliflozin reduces weight and blood pressure but does not improve glycemic control. Kidney Int. 2014;85:962–971. [DOI] [PMC free article] [PubMed] [Google Scholar]
- 14. Barnett AH, Mithal A, Manassie J, et al. Efficacy and safety of empagliflozin added to existing antidiabetes treatment in patients with type 2 diabetes and chronic kidney disease: a randomised, double‐blind, placebo‐controlled trial. Lancet Diabetes Endocrinol. 2014;2:369–384. [DOI] [PubMed] [Google Scholar]
- 15. Kalgutkar AS, Tugnait M, Zhu T, et al. Preclinical species and human disposition of PF‐04971729, a selective inhibitor of the sodium‐dependent glucose cotransporter 2 and clinical candidate for the treatment of type 2 diabetes mellitus. Drug Metab Dispos. 2011;39:1609–1619. [DOI] [PubMed] [Google Scholar]
- 16. Miao Z, Nucci G, Amin N, et al. Pharmacokinetics, metabolism, and excretion of the antidiabetic agent ertugliflozin (PF‐04971729) in healthy male subjects. Drug Metab Dispos. 2013;41:445–456. [DOI] [PubMed] [Google Scholar]
- 17. Margaillan G, Rouleau M, Fallon JK, et al. Quantitative profiling of human renal UDP‐glucuronosyltransferases and glucuronidation activity: a comparison of normal and tumoral kidney tissues. Drug Metab Dispos. 2015;43:611–619. [DOI] [PMC free article] [PubMed] [Google Scholar]
- 18. Levey AS, Coresh J, Greene T, et al. Using standardized serum creatinine values in the modification of diet in renal disease study equation for estimating glomerular filtration rate. Ann Intern Med. 2006;145:247–254. [DOI] [PubMed] [Google Scholar]
- 19. European Medicines Agency . Guideline on the evaluation of the pharmacokinetics of medicinal products in patients with decreased renal function. http://www.ema.europa.eu/docs/en_GB/document_library/Scientific_guideline/2016/02/WC500200841.pdf. Accessed June 9, 2017.
- 20. American Diabetes Association . Executive summary: Standards of medical care in diabetes—2012. Diabetes Care. 2012;35 (suppl 1):S4–S10. [DOI] [PMC free article] [PubMed] [Google Scholar]
- 21. Thomas MC, Cooper ME, Zimmet P. Changing epidemiology of type 2 diabetes mellitus and associated chronic kidney disease. Nat Rev Nephrol. 2016;12:73–81. [DOI] [PubMed] [Google Scholar]
- 22. Devineni D, Curtin CR, Marbury TC, et al. Effect of hepatic or renal impairment on the pharmacokinetics of canagliflozin, a sodium glucose co‐transporter 2 inhibitor. Clin Ther. 2015;37:610–628.e614. [DOI] [PubMed] [Google Scholar]
- 23. National Kidney Association . Frequently asked questions about GFR estimates. https://www.kidney.org/sites/default/files/12-10-4004_FAQ-ABE.pdf. Accessed June 9, 2017.
- 24. Kumar V, Sahasrabudhe V, Matschke K, et al. Lack of a pharmacokinetic interaction between ertugliflozin and sitagliptin or metformin in healthy subjects. Paper presented at: 2016 Annual Meeting of the American Society for Clinical Pharmacology and Therapeutics (ASCPT); March 8‐12, 2016; San Diego, CA.
- 25. Kumar V, Sahasrabudhe V, Liang Y, et al. Effect of rifampin on the pharmacokinetics of ertugliflozin in healthy subjects. Paper presented at: 2016 Annual Meeting of the American Society for Clinical Pharmacology and Therapeutics (ASCPT); March 8‐12, 2016; San Diego, CA.
- 26. Sahasrabudhe V, Kumar V, Matschke K, et al. Lack of a clinically meaningful pharmacokinetic interaction between ertugliflozin and glimepiride or simvastatin in healthy subjects. Paper presented at: 2016 Annual Meeting of the American Society for Clinical Pharmacology and Therapeutics (ASCPT); March 8‐12, 2016; San Diego, CA.
- 27. Raje S, Callegari E, Sahasrabudhe V, et al. Determination of absolute oral availability and fraction absorbed of ertugliflozin using a novel microtracer approach. Paper presented at: 2016 Annual Meeting of the American Society for Clinical Pharmacology and Therapeutics (ASCPT); March 8‐12, 2016; San Diego, CA.