

Abstract
An exploratory population pharmacokinetic model for functional dupilumab was developed. Data from healthy volunteers and patients with atopic dermatitis (AD) receiving intravenous or subcutaneous doses were integrated. The data included 197 participants (2,518 measurements of dupilumab in serum) from six phase I and II studies. The data were analyzed using stochastic approximation expectation‐maximization and importance sampling methods. The best structural model was a two‐compartment model with parallel linear and Michaelis–Menten elimination from the central compartment. Estimated parameters were: central volume 2.74 L, elimination rate 0.0459 d−1, central‐to‐peripheral rate 0.0652 d−1, peripheral‐to‐central rate 0.129 d−1, bioavailability 60.7%, maximal target‐mediated elimination rate 0.968 mg/L/d, and Michaelis–Menten constant 0.01 mg/L. Body weight was a significant covariate of the central volume. No gender effect was observed when controlling for weight. No differences between healthy volunteers and patients with AD were found. The model adequately described dupilumab pharmacokinetics for intravenous and subcutaneous routes of administration.
Study Highlights.
WHAT IS THE CURRENT KNOWLEDGE ON THE TOPIC?
☑ Dupilumab is a fully human monoclonal antibody directed against the IL‐4 receptor alpha subunit (IL‐4Rα). Population PK parameters of dupilumab have not been published.
WHAT QUESTION DID THIS STUDY ADDRESS?
☑ The study focused on the determination of a population PK model of dupilumab to support clinical development.
WHAT THIS STUDY ADDS TO OUR KNOWLEDGE
☑ The model determines the PK parameters of dupilumab with weight as a covariate. The model demonstrated that there were no differences in production rate of IL‐4Rα between normal volunteers and AD patients. The model successfully accounted for singularities caused by a pronounced target‐mediated clearance.
HOW MIGHT THIS CHANGE DRUG DISCOVERY, DEVELOPMENT, AND/OR THERAPEUTICS?
☑ The PK models based on human data can be used to predict concentrations of functional dupilumab in future human studies, support regulatory responses, compare PK parameters of dupilumab to PK parameters of other monoclonal antibodies, support dose selection, test for weight, gender and disease as covariates, conduct allometric scaling, and develop a population PD model.
Dupilumab (also known as REGN668) is a fully human monoclonal antibody (mAb) that is directed against the interleukin‐4 receptor alpha subunit (IL‐4Rα), which is a component of IL‐4 receptors Type I and Type II, and the interleukin‐13 (IL‐13) receptor system. The binding of dupilumab to IL‐4Rα results in the inhibition of IL‐4 and IL‐13 signalling.1, 2 Dupilumab is under development as a potential novel treatment for atopic dermatitis (AD), asthma, chronic sinusitis with nasal polyposis, and eosinophilic esophagitis.
The pathophysiology of AD is influenced by a complex interplay between immunoglobulin E (IgE)‐mediated sensitization, the immune system, and environmental factors.1, 3 The primary skin defect may be an immunologic disturbance that leads to sensitization mediated by IgE, with the final epithelial‐barrier dysfunction being the consequence of both genetic mutations and local inflammation.
Dupilumab has been studied in phase I and II trials to evaluate the safety, tolerability, pharmacokinetics (PK), pharmacodynamics (PD), and immunogenicity of single subcutaneous (s.c.) and intravenous (i.v.) doses, as well as multiple s.c. qw, q2w, and q4w doses.1, 4 Single i.v. infusions or s.c. injections were administered during the first‐in‐human (FIH) study of healthy volunteers. The multiple‐dose phase II trials presented in this article were conducted in patients with moderate‐to‐severe AD.1
An initial population PK model based on monkey data was used to predict the concentration–time profile of dupilumab in the FIH study. As clinical studies were completed, new data were integrated and the PK model was updated. This article describes the model results based on data obtained from two studies of healthy volunteers and four studies of patients with AD.
A two‐compartment population PK model with parallel linear and nonlinear elimination was implemented. Michaelis–Menten (MM), quasi‐steady‐state (QSS),5, 6 and target‐mediated drug disposition (TMDD)5, 6 models were tested. The PK models based on human data were used to predict concentrations of functional dupilumab in future human studies, support regulatory responses, compare PK parameters of dupilumab to PK parameters of other mAbs, and develop a population PD model.
METHODS
Study design and population
The studies1, 7 used in this analysis are summarized in Table 1. Predose and placebo samples were excluded from the analysis. Hours were counted postinjection or after the end of infusion. Unscheduled visits were included in the analysis.
Table 1.
Summary of dosing and PK sampling study design
| Study name | Dosing regimens | Participants/patients (n) | Samples (n) and collection time |
|---|---|---|---|
| NCT01015027 (R668‐AS‐0907): Ascending dose study of the safety and tolerability of REGN668 (SAR231893) in normal healthy volunteers7 | Single i.v. infusions of 1, 3, 8, and 12 mg/kg, Single s.c. injections of 150 and 300 mg | 36 | 508, days 1 (hours 0, 1, 2, 4, 8), 2, 4, 8, 11, 15, 22, 29, 43, 57, 85 |
| NCT01259323 (R668‐AD‐0914): Sequential ascending dose study to assess the safety and tolerability of REGN668 (SAR231893) in patients with atopic dermatitis 1 | 4 s.c. injections of 75, 150, or 300 mg qw | 24 | 279, days 4, 8, 15, 22, 25, 29, 36, 43, 50, 57, 64, 71, 85 |
| NCT01385657 (R668‐AD‐1026): Safety and tolerability of REGN668 (SAR231893) in patients with moderate to severe atopic dermatitis1 | 4 s.c. injections 150 or 300 mg qw | 27 | 312, days 4, 8, 15, 22, 25, 29, 36, 43, 50, 57, 64, 71, 85 |
| NCT01484600 (R668‐HV‐1108): Study of the safety, tolerability, pharmacokinetics, and immunogenicity of REGN668 administered subcutaneously to healthy volunteers | Single s.c. injections of 300 mg | 36 | 564, days 1 (hours 0, 1, 2, 4, 8, 12), 2, 4, 8, 11, 15, 22, 29, 36, 43, 50, 57, 64 |
| NCT01548404 (R668‐AD‐1117): Study of REGN668/SAR231893 in adult patients with extrinsic moderate‐to‐severe atopic dermatitis1 | 12 s.c. injections of 300 mg qw | 53 | 693, days 8, 15, 22, 29, 43, 57, 71, 78, 85, 99, 113, 127, 141, 155, 169, 183, 197 |
| NCT01639040 (R668‐AD‐1121): Study to assess the safety of REGN668 (SAR231893) administered concomitantly with topical corticosteroids (TCS) in patients with moderate‐to‐severe atopic dermatitis (AD)1 | 4 s.c. injections of 100 or 300 mg qw | 21 | 162, days 8, 15, 22, 29, 36, 50, 64, 78 |
AD, atopic dermatitis; i.v., intravenous; s.c., subcutaneous.
The data included 197 participants and 2,518 concentrations from two phase I and four phase II studies. There were no missing covariates.
The studies presented in Table 1 were performed in accordance with Good Clinical Practice guidelines and adhered to the Declaration of Helsinki. The study protocols and procedures were approved by the appropriate Institutional Review Boards and Ethics Committees at each study site. All participants provided written informed consent before any study procedure was undertaken.
Assay methodology
Serum samples for the quantitation of functional dupilumab were analyzed using a validated enzyme‐linked immunosorbent assay (ELISA). In this functional assay, dupilumab was used as the assay standard and human IL‐4Rα served as the capture reagent. Concentrations of dupilumab with either one or two available binding sites were measured (functional drug). The assay does not detect dupilumab when both binding sites are occupied by sIL‐4Rα (soluble form), or when at least one site is bound to mIL‐4Rα (membrane‐bound form).
The lower limit of quantitation (LLOQ) of functional dupilumab is 0.078 mg/L in undiluted human serum.
Population PK analysis
Population PK modeling was performed using NONMEM v. 7.3.0 (ICON Development Solutions, Ellicott City, MD) and Monolix (v. 4.3.2, LIXOFT, Orsay, France) software. Graphical analyses were conducted using SAS 9.2 (SAS Institute, Cary, NC).
Outliers were excluded from the analysis based on visual examination of the data and diagnostic plots. A nonlinear mixed‐effect modeling approach was used to analyze the PK data. MM, QSS, and TMDD models were tested.
MM elimination was parameterized in such a way that the unit of maximum target‐mediated elimination rate (Vm) was mg/L/d, which can be interpreted as an assumption of a proportional relationship between the production rate of the target and the volume of the central compartment. In addition, a two‐compartment model with parallel linear and MM elimination from the central compartment was parameterized so that the calculated individual volume of the peripheral compartment was proportional to the volume of the central compartment because intercompartmental rates were used instead of the intercompartmental clearance and volume of the peripheral compartment; this was possible because the relationship between the peripheral and central compartments can be written as V3 = V2·k23/k32, where k23 and k32 are the central‐to‐peripheral and peripheral‐to‐central intercompartmental rates, respectively.
The first human MM and TMDD models were based on allometric scaling and were developed to predict the PK profile in the FIH study using data on i.v. and s.c. routes of administration from the FIH study. Each time another clinical study was completed, the model was updated. The importance‐sampling (IMP) method or IMP combined with Stochastic Approximation Expectation‐Maximization (SAEM) method were used when NONMEM was utilized. With Monolix, SAEM and IMP were used together because only this approach is available. The SAEM method was used to estimate parameters. The IMP method was used to estimate both parameters and calculate log‐likelihood when applied alone, but only to calculate objective function when applied with SAEM.
The values below the LLOQ (BLQ) were utilized in the model applying the M3 method.8 The rationale for using BLQ values in some analyses was to provide additional information in order to enable the model to better describe a steep target‐mediated phase, as few low quantifiable concentration data were available to characterize this attribute.
A series of structural models were evaluated based on objective function value (OFV), standard errors of parameter estimates, plausibility of parameter estimates, and goodness‐of‐fit plots. The model building was carried out using a stepwise forward inclusion with a P value of 0.01. An improvement in the model was assessed based on the reduction in OFV, improvement in goodness‐of‐fit diagnostics, reduction in between‐ and within‐subject variability, and improvement in the precision of parameters.
A complete exploration of variability was not among the primary goals of the modeling as the sample size was insufficient to test for many covariates. A small set of covariates was chosen based on importance for early clinical development, feasibility, literature review, and experience with other monoclonal antibodies.
Population (healthy volunteers vs. AD patients) was tested as a covariate of maximum target‐mediated rate of elimination of dupilumab; this covariate was particularly important for interpreting the results, choosing populations for studies, and making decisions on data integration. Antidrug antibody (ADA) positivity was tested as a covariate of the elimination rate (ke). Body weight and gender were tested as covariates of the central volume of distribution.
When NONMEM software was utilized, the relationship between central volume and weight and between elimination rate and population was modeled using the following equations, respectively:
| (1) |
| (2) |
where Weighti is the individual value of weight, θ1 is the estimate of the central volume for a participant whose weight is 75 kg, θ2 is the effect of weight on the central volume, θ3 is the value of ke for healthy volunteers, IPopulation i is the individual indicator of population (0 for healthy volunteers and 1 for AD patients) and θ4 is the multiplier of ke for AD patients. The values of V2i and kei in Eq. 1 and 2 are population estimates adjusted for covariates.
The impact of ADA was tested similarly to the effect of population. The overall impact of ADA on the entire population was not clinically significant. Also, assays, definitions of ADA, and dupilumab formulations were optimized during clinical development. Thus, ADA‐related results may not necessarily be predictive of phase III studies and are not further discussed in this article. It should be noted that ADA cannot be directly compared across different products as different assays, chemicals, equipment, and procedures are employed.
Population impact on the maximum target‐mediated rate of elimination of dupilumab (Vm) was tested similarly to the population effect on ke. When Monolix was used, essentially the same built‐in formulas were applied to test for covariates.
RESULTS
Data
Data of 197 participants (96 (49%) females and 101 (51%) males) were used in the population PK analyses. The mean weight and age were 76 kg and 37 years, respectively. The population PK data consisted of 2,518 measurements of dupilumab in serum and 2,078 (83%) quantifiable concentrations. The number of samples, participants, and sampling days in each study are presented in Table 1.
Population PK modeling
The MM, QSS, and TMDD models were compared and the MM model was chosen for the following reasons: 1) although the QSS model and TMDD models were more complex, they did not provide useful additional information; 2) even though the TMDD models converged well when applied to the FIH study, the elimination rates of IL‐4R and the dupilumab:IL‐4Rα complex had large standard errors and the model was somewhat overparameterized; this result was expected because both drug and target concentrations may be needed to estimate all parameters of a TMDD model well; as the weak signs of overparameterization exacerbated substantially when multiple‐dose studies with sparse sampling were added, the model was excluded from further analyses; 3) MM, QSS, and TMDD models provided similar predictions, PK parameters, and diagnostic plots; and 4) the MM model had the shortest run time.
The MM, QSS, and TMDD modeling results were similar when rich data were analyzed and the MM and QSS modeling results were similar when integrated rich and sparse data were used in the model, so only the MM model is discussed in detail.
A two‐compartment model with parallel linear and MM elimination from the central compartment was implemented as the base model. This model is depicted in Figure 1.
Figure 1.
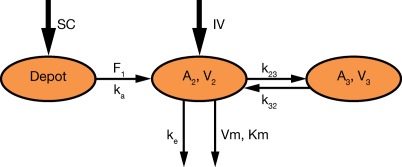
Schematic representation of the population PK model.
The PK model was parameterized using the linear elimination rate (ke), central volume of distribution (V2), central‐to‐peripheral rate (k23), peripheral‐to‐central rate (k32), absorption rate (ka), maximum target‐mediated elimination rate (Vm), and MM constant (Km). The intersubject variability was implemented in V2, ke, ka, and Vm. Population PK parameters are presented in Table 2. When the first few studies were analyzed, the influence of body weight on V2 was estimated. Weight was a statistically significant covariate. When V2 was controlled for weight, ω(V2) decreased markedly while the remaining parameters remained similar.
Table 2.
Population PK parameters
| Parameter estimate (bootstrap 5th, 95th percentiles) | ||
|---|---|---|
| Parameter name | BLQ data included | BLQ data excluded |
| PK parameter (unit) | ||
| V2 (L) | 2.74 (2.61, 2.97) | 2.60 (2.46, 2.79) |
| ke (1/d) | 0.0459 (0.0403, 0.0503) | 0.0488 (0.0422, 0.0566) |
| k23 (1/d) | 0.0652 (0.0431, 0.0917) | 0.104 (0.0755, 0.150) |
| k32 (1/d) | 0.129 (0.101, 0.166) | 0.173 (0.133, 0.234) |
| ka (1/d) | 0.254 (0.226, 0.315) | 0.261 (0.223, 0.303) |
| Vm (mg/L/d) | 0.968 (0.836, 1.09) | 1.06 (0.946, 1.20) |
| Km (mg/L) | 0.01 (fixed) | 0.01 (fixed) |
| F (unitless) | 0.607 (0.537, 0.665) | 0.623 (0.572, 0.678) |
| Covariate influence | ||
| V2 ∼ weight | 0.705 (0.576, 0.840) | 0.737 (0.588, 0.914) |
| Inter‐individual variability | ||
| ω2 (V2)a | 0.0225 (0.0152, 0.0285) | 0.0295 (0.0189, 0.0419) |
| ω2 (ke) | 0.131 (0.0738, 0.191) | 0.131 (0.0733, 0.181) |
| ω2 (ka) | 0.251 (0.187, 0.345) | 0.230 (0.169, 0.293) |
| ω2 (Vm) | 0.0428 (0.0215, 0.0663) | 0.0379 (0.0120, 0.0705) |
| Residual variability (unit) | ||
| σ2 proportional (CV%) | 24.2 (22.1, 27.0) | 18.2 (15.1, 21.1) |
| σ2 additive (mg/L) | 0.03 (fixed) | 0.871 (0.579, 1.32) |
| Derived parametersb | ||
| CL (L/d)b,c | 0.126 | 0.127 |
| Q (L/d) | 0.179 | 0.270 |
| V3 (L) | 1.38 | 1.56 |
aV2 is adjusted for body weight. bLinear clearance calculated as V2·ke. cAs the kinetics are substantially nonlinear, the beta half‐life and linear clearance cannot be used to calculate time to the LLOQ concentration or another concentration of interest. No attempts should be made to do this to predict when patients reach clinically insignificant concentrations. Instead, model‐based predictions should be used, which are proved to be precise.
When controlling the central volume for weight, no meaningful or statistically significant gender effect was observed. When controlling the central volume for weight, no meaningful or statistically significant effect of weight on elimination rate was observed.
The parameters in Table 2 are presented for a global minimum of the OFV. It was noted that when an initial value of the additive error was set to a much larger value, the objective function consistently converged to a local minimum with substantially higher OFV. At this local minimum, the additive error increased ∼30‐fold and the proportional error decreased ∼1.4‐fold. No substantial changes in simulated concentrations were observed. Visual predictive checks indicated that predictions of BLQ frequencies worsen significantly.
A sensitivity analysis was conducted with BLQ measurements removed from the analysis to understand the model behavior. The population PK parameters are presented in Table 2. It appeared that the PK parameters were essentially the same as the values converged to the local minimum, suggesting that increasing additive standard deviation (SD) can have the same effect as removing BLQ measurements from the analysis. No local or global minimum was observed at lower values of additive SD. When Km was estimated in this analysis, it converged to values close to 1 mg/L and significantly improved OFV. An impact on the remaining parameters was minimal and meaningless except for Vm, which increased by ∼25%.
Removing BLQ measurements from the analysis allowed a faster model run time, more stable objective function estimates, and intercompartmental rates estimated closer to that estimated from only i.v. data. However, without these BLQ data, parameter estimates gave less precise predictions of concentrations close to and below 1 mg/L and time of approaching the first BLQ value after drug withdrawal, as well as potentially an estimate of Km, which does not have a physiological meaning. Removing the BLQ values represents a pragmatic compromise rather than a more mechanistic representation of the biology of the drug–target interaction. As keeping BLQ measurements may better support future PK/PD modeling and as removing them helps to solve practical issues, both sets of model parameters may be useful for simulation, depending on the goal of the analysis.
As many IL‐4 receptors are located on white blood cells, the target‐mediated phase is very steep and the predicted instantaneous half‐life approaches zero when concentrations of dupilumab approach LLOQ. Different versions of the model with BLQ measurements persistently estimated the MM constant (Km) at values below ∼0.01 mg/L, with large relative standard errors. Subsequently, Km was fixed to different small positive values. The OFV was not sensitive to the changes in Km below ∼0.01 mg/L, but increased when it was fixed at values above ∼0.01 mg/L. Thus, Km was fixed at 0.01 mg/L.
When BLQ measurements were used in the analysis, the SD of the additive error was fixed at a small value of 0.03 mg/L in most models to reduce the number of evaluated parameters. When the additive SD was estimated in the model, it converged to similar values and the results were almost identical.
The means of the random effects are not significantly different from zero. All PK parameters were estimated with sufficient precision, as reflected by the bootstrap percentiles (Table 2). The results were similar across model runs with 10–20% changes in initial values.
The model was validated by 1) comparing predicted concentrations of dupilumab and data from new studies (external validation); 2) bootstrapping (internal validation); and 3) comparing the results to the published data.
Little change was observed in population PK parameters when data from additional studies were integrated. The single‐dose FIH study predicted multiple‐dose studies very well. Each new study demonstrated very good predictability of the population PK model.
All diagnostic plots are presented for the model with BLQ values (Figures 2 and 3). The linear‐scaled diagnostic plots of observed vs. predicted concentrations of dupilumab (Figure 2 a–d) indicated that the model described the concentration–time profile well. The BLQ values are not presented in the diagnostic plots. Log–log figures of observed vs. predicted concentrations are rarely presented in publications, but are useful to understand the behavior of the model at very low concentrations; such plots are recommended by guidelines.16 In the log–log Figure 2 e, a cluster can be observed when the predicted concentrations are below the LLOQ. The cluster appeared at predicted concentrations below ∼0.01 mg/L. The asymmetry of the cluster in relation to the unit line can be explained by the censored observations below the LLOQ level. The primary reason for the presence of this cluster was a very steep target‐mediated phase with the concentration–time slope approaching negative infinity and instantaneous half‐life approaching zero. Thus, at low concentrations very small differences in population‐predicted and observed times of reaching the LLOQ level led to very large fold differences between the observed (DV) and predicted concentrations (PRED), which may look like outliers in log–log figures. These differences can be observed in Figure 3 a–d. For example, in Figure 3 c there are two detectable concentrations of ∼2 and ∼10 mg/L when the population predicted values are BLQ; in Figure 3 d, the last detectable concentration is ∼3 mg/L when the population predicted value is ∼20 mg/L. Some data points observed during the target‐mediated phase appear in the cluster in the log‐log PRED vs. DV figures described above. The presence of the cluster in the log–log dependent variable (DV) vs. the population predicted (PRED) figure (Figure 2 e) was inevitable and removing related observations from the analysis was inappropriate. The only way to remove this cluster was to eliminate observations collected during the target‐mediated phase. Similar clusters appeared when TMDD and QSS models were tested. A substantially smaller cluster sometimes was also observed in the log–log DV vs. individual predicted (PRED) figure, but was not present in this model run (Figure 2 f). The presence of this small cluster can possibly be explained by outliers, which are difficult to identify looking at the concentration–time profiles, and/or by the inability of the model to provide a perfect fit of the individual data for a very small portion of observations due to the singularity in the concentration–time slope described above. Thus, the clustered observations observed in the log–log DV vs. IPRED figure were left in the analysis for the following reasons: 1) the appearance of a cluster in the log–log DV vs. individual PRED figure was an insufficient justification to remove observations; 2) the parameter estimates were stable; and 3) lastly, there were no signs that the presence of the cluster affected the other diagnostic plots and an ability of the model to make predictions.
Figure 2.
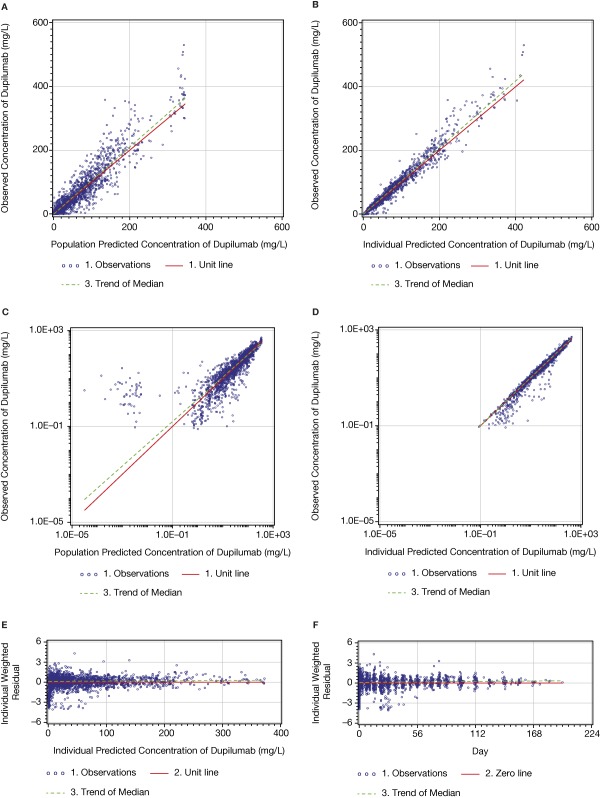
Dupilumab PK model: diagnostic plots of observed vs. predicted concentrations and conditional residuals vs. predicted concentrations.
Figure 3.
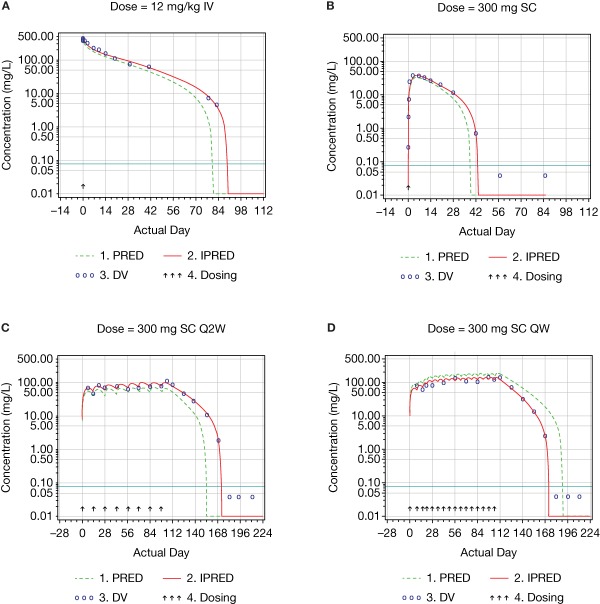
Examples of log‐scaled concentration–time profiles of dupilumab.
The small asymmetry in relation of the zero line (Figure 2 c,d) can be explained by censoring the BLQ values in the figures.
DISCUSSION
The elimination of mAbs may primarily occur via binding to the target, thus leading to complex internalization (target‐mediated clearance), and via nonspecific catabolism by the reticuloendothelial system.9 Functional dupilumab is characterized by target‐mediated clearance and nonlinear kinetics, and the concentration–time profile of dupilumab was consistent with the typical profile of mAbs undergoing target‐mediated clearance. Both the absorption phase after s.c. injection and the distribution phase after i.v. infusion were followed by the beta and target‐mediated phases when doses were high enough to saturate target‐mediated elimination (Figure 3). Otherwise, they were followed by the target‐mediated phase only (Figure 3).
A two‐compartment model with parallel linear and MM elimination from the central compartment adequately described dupilumab concentration–time data in the population PK analysis and provided good predictions for the phase II studies.
Because IL‐4Rα are located to a large extent on white blood cells, the target‐mediated phase was well observed and the predicted and observed concentration–time slopes at low concentrations of dupilumab approached large negative values. To account for the singularity and achieve convergence and stability, the SAEM and IMP methods were utilized.
Overall, population PK parameters were consistent with those reported in the literature. The estimated elimination rate was 0.0459 day−1 (Table 2), which is consistent with other mAbs of the IgG4 isotype.10, 11, 12, 13, 14 Linear clearance, representing the lowest estimate of total clearance at saturating concentrations, was calculated as 0.126 L/d. The 2.74 L volume of the central compartment is approximately equal to the serum volume. The 1.38 L volume of the peripheral compartment suggests a limited distribution outside the vasculature. The maximum target‐mediated elimination rate of 0.968 mg/L/d was very similar to the 1.22 mg/L/d calculated as Rmax·Kint, where Rmax and Kint are reported by Kakkar et al.15 for AMG 317, an anti‐IL‐4Rα mAb; kint and Rmax are the internalization rate constant of the drug:target complex and the concentration of total target at its maximum, respectively. The calculation is done assuming that the maximum target‐mediated clearance can be achieved when concentration of total target achieves its maximum (i.e., the target is mostly bound), as well as that Rmax can be calculated as maximum target‐mediated elimination rate divided by Kint.
As dupilumab has a distinct target‐mediated phase and the instantaneous half‐life decreases over time to values close to zero, its terminal half‐life cannot be calculated or used for any practical purposes. For the same reason, the derived parameters such as linear clearance cannot be used to calculate time to the LLOQ concentration or another concentration of interest. Instead, model‐based predictions should be used, which are proved to be precise.
The impact of population (normal volunteers vs. patients with AD), weight, and gender were tested as covariates in the model. The impact of weight on the central volume was similar to that observed for many other mAbs.10, 15 As dupilumab has a wide therapeutic index1, 2, 4 and weight accounts for a small portion of variance, no dose adjustment for weight appears warranted in the adult population based on the phase I and II clinical data. The absence of a meaningful or statistically significant difference in the maximum target‐mediated elimination rate of dupilumab between normal volunteers and patients with AD may indicate that the production rate of IL‐4, rather than IL‐4Rα, is regulated during inflammatory processes.
CONCLUSION
A two‐compartment model with parallel linear and MM elimination from the central compartment properly described the dupilumab concentration–time data in normal volunteers and patients with AD. No clinically meaningful or statistically significant differences were observed between these populations, indicating that the production rate of IL‐4Rα is similar. No statistically significant or clinically meaningful effect of gender was observed on the volume of the central compartment when controlling for weight.
The estimates for the population PK parameters that describe the linear processes (processes independent of the target‐mediated clearance) were similar to those of other therapeutic mAbs of IgG1, IgG2, and IgG4 isotypes.
Single‐dose kinetics predicted multiple‐dose kinetics of dupilumab well, suggesting that the production rate of IL‐4Rα and overall PK do not change over time.
Although the population analysis identified weight as a statistically significant covariate, no dose adjustment for weight appears warranted based on these phase I and II studies.
Supporting information
Supporting Information
Supporting Information
Supporting Information
Supporting Information
Supporting Information
Acknowledgments
The authors thank the participants in the studies. This research was sponsored by Sanofi and Regeneron Pharmaceuticals, Inc. Editorial assistance was provided by Mihai Surducan, PhD, of Excerpta Medica, funded by Sanofi and Regeneron Pharmaceuticals, Inc.
Conflict of Interest/Disclosure
P.K., T.D., M.A., N.G., and R.S. are employees and shareholders of Regeneron Pharmaceuticals, Inc. J.D.D. is an employee and holds stock options in Regeneron Pharmaceuticals, Inc. M.L. is an employee and shareholder of Sanofi.
Author Contributions
P.K., T.D., J.D.D., M.L., M.A., N.G., and R.S. wrote the article; P.K., T.D., M.A., N.G., and R.S. designed the research; P.K., T.D., J.D.D., M.L., and R.S. performed the research; P.K. analyzed the data.
References
- 1. Beck, L.A. et al Dupilumab treatment in adults with moderate‐to‐severe atopic dermatitis. N. Engl. J. Med. 371, 130–139 (2014). [DOI] [PubMed] [Google Scholar]
- 2. Wenzel, S. et al Dupilumab in persistent asthma with elevated eosinophil levels. N. Engl. J. Med. 368, 2455–2466 (2013). [DOI] [PubMed] [Google Scholar]
- 3. Bieber, T. Mechanisms of disease: atopic dermatitis. N. Engl. J. Med. 358, 1483–1494 (2008). [DOI] [PubMed] [Google Scholar]
- 4. Thaçi D. et al Efficacy and safety of dupilumab in adults with moderate‐to‐severe atopic dermatitis inadequately controlled by topical treatments: a randomised, placebo‐controlled, dose‐ranging phase 2b trial. Lancet 387, 40–52 (2016). [DOI] [PubMed] [Google Scholar]
- 5. Gibiansky, L. , Gibiansky, E. , Kakkar, T. & Ma, P. Approximations of the target‐mediated drug disposition model and identifiability of model parameters. J. Pharmacokinet. Pharmacodyn. 35, 573–591 (2008). [DOI] [PubMed] [Google Scholar]
- 6. Dua, P. , Hawkins, E. & van der Graaf, P.H. A tutorial on target‐mediated drug disposition (TMDD) models. CPT Pharmacometrics Syst. Pharmacol. 4, 324–337 (2015). [DOI] [PMC free article] [PubMed] [Google Scholar]
- 7. Radin, A. et al First‐in‐human study of REGN668/SAR231893 (IL‐4Rα mAb): safety, tolerability and biomarker results of a randomized, double‐blind, placebo‐controlled, single ascending dose study in healthy volunteers. J. Allergy Clin. Immunol. 131, B158 (2013). [Google Scholar]
- 8. Ahn, J.E. , Karlsson, M.O. , Dunne, A. & Ludden, T.M. Likelihood based approaches to handling data below the quantification limit using NONMEM VI. J. Pharmacokinet. Pharmacodyn. 35, 401–421 (2008). [DOI] [PubMed] [Google Scholar]
- 9. Committee for Medicinal Products for Human Use . Guideline on reporting the results of population pharmacokinetic analyses. <http://www.ema.europa.eu/docs/en_GB/document_library/Scientific_guideline/2009/09/WC500003067.pdf.> (2007). Accessed 30 Mar 2014.
- 10. Tabrizi, M. et al Population pharmacokinetic evaluation of a fully human IgG monoclonal antibody in patients with inflammatory diseases. Inflamm. Allergy Drug Targets 9, 229–237 (2010). [DOI] [PubMed] [Google Scholar]
- 11. Dirks, N.L. & Meibohm, B. Population pharmacokinetics of therapeutic monoclonal antibodies. Clin. Pharmacokinet. 49, 633–659 (2010). [DOI] [PubMed] [Google Scholar]
- 12. Ng, C.M. Bruno, R. , Combs, D. & Davies, B. Population pharmacokinetics of rituximab (anti‐CD20 monoclonal antibody) in rheumatoid arthritis patients during a phase II clinical trial. J. Clin. Pharmacol. 45, 792–801 (2005). [DOI] [PubMed] [Google Scholar]
- 13. Oh, C.K. et al An open‐label, single‐dose bioavailability study of the pharmacokinetics of CAT‐354 after subcutaneous and intravenous administration in healthy males. Br. J. Clin. Pharmacol. 69, 645–655 (2010). [DOI] [PMC free article] [PubMed] [Google Scholar]
- 14. White, B. , Leon, F. , White, W. & Robbie, G. Two first‐in‐human, open‐label, phase I dose‐escalation safety trials of MEDI‐528, a monoclonal antibody against interleukin‐9, in healthy adult volunteers. Clin. Ther. 31, 728–740 (2009). [DOI] [PubMed] [Google Scholar]
- 15. Lu, J.F. , Bruno, R. , Eppler, S. , Novotny, W. , Lum, B. & Gaudreault, J. Clinical pharmacokinetics of bevacizumab in patients with solid tumors. Cancer Chemother. Pharmacol. 62, 779–786 (2008). [DOI] [PubMed] [Google Scholar]
- 16. Kakkar, T. et al Population PK and IgE pharmacodynamic analysis of a fully human monoclonal antibody against IL4 receptor. Pharm. Res. 28, 2530–2542 (2011). [DOI] [PubMed] [Google Scholar]
Associated Data
This section collects any data citations, data availability statements, or supplementary materials included in this article.
Supplementary Materials
Supporting Information
Supporting Information
Supporting Information
Supporting Information
Supporting Information