Abstract
Background
Tumor suppressor gene p53 expression has been reported in patients with ulcerative colitis (UC). However, the correlation between p53 expression and UC remains controversial. The aim of this meta-analysis was to investigate the association between p53 expression and different pathological types of UC.
Methods
Publications were searched in the PubMed, Embase, EBSCO, Wangfang, and CNKI databases. The overall odds ratios (ORs) and their corresponding 95% confidence intervals (95% CIs) were summarized in this study.
Results
Final 19 papers were identified in this meta-analysis, including 1068 patients with UC and 130 normal tissue samples. Immunohistochemical p53 expression was significantly higher in UC without dysplasia and carcinoma (UC group) compared to normal tissue samples (OR = 3.14, P = 0.001), higher in UC with dysplasia than in UC group (OR = 10.76, P < 0.001), and higher in UC with colorectal cancer (CRC) than in UC with dysplasia (OR = 1.69, P = 0.035). Subgroup analysis of ethnicity (UC group vs. normal tissues) showed that p53 expression was correlated with UC in Asians, but not in Caucasians. When UC with dysplasia was compared to UC group, p53 expression was linked to UC with dysplasia among both Asians and Caucasians. When UC-CRC was compared to UC with dysplasia, p53 expression was not associated with UC-CRC in both Caucasians and Asians.
Conclusions
p53 expression was closely associated with UC-CRC development. p53 expression showed different ethnic characteristics among different pathological types of UC.
Electronic supplementary material
The online version of this article (10.1186/s12876-017-0665-y) contains supplementary material, which is available to authorized users.
Keywords: p53, Ulcerative colitis, Dysplasia, Carcinoma
Background
As one common pathological type of inflammatory bowel diseases (IBD), ulcerative colitis (UC) is characterized by a relapsing, idiopathic, and chronic inflammatory disease which usually affects the entire colon and rectum [1, 2]. The prevalence of this disease has been rising in the world, patients with UC are correlated with an increased risk of developing colorectal cancer (CRC) [3, 4].
Although the exact mechanism of UC is not fully understood, increasing evidence reports that genetic and environmental factors are important in the pathogenesis of UC [5–7]. Given the increased risk of CRC in UC, dysplasia is precancerous lesions, it is essential to clinical screening of UC patients with dysplasia [8]. The p53, a key tumor-suppressor gene (TSG), is mapped to the short arm of chromosome 17 (17p13) [9]. p53 gene encodes the p53 protein and is responsible for the regulation of cell cycle, DNA repair, and apoptosis [10, 11]. The p53 mutation is the most common event in human carcinomas, due to the accumulation of mutant p53, p53 protein often shows nuclear staining, which makes it easily detected using immunohistochemistry (IHC) method [12, 13]. The expression of p53 protein can be measured by IHC in different histological types of UC [14, 15].
Although Du et al. reported the association between KRAS and TP53 mutations with IBD-associated colorectal cancer [16], the correlation between p53 expression and the risk of dysplasia and cancer in patients with UC remained to be elucidated. Because the sample size of an individual study was small in UC, moreover, there were some inconsistent results with respect to p53 expression in UC. For example, Li 2004 et al. reported that no immunoreactivity for p53 expression was found in UC and normal tissue samples [17]. Klump 1997 et al. reported that p53 expression was noted in UC without dysplasia/carcinoma and UC with dysplasia [15]. Thus, we first conducted this meta-analysis involving more eligible articles to determine the correlation between p53 expression and different histological types of UC, including normal tissue samples, UC without dysplasia/carcinoma, UC with dysplasia, and UC with CRC.
Methods
Search strategy
A systematic literature search was conducted in the PubMed, Embase, EBSCO, Wangfang, and CNKI databases prior to February 13th, 2017. We used the relevant key words and search terms to identify eligible papers: (inflammatory bowel disease OR ulcerative colitis) AND expression AND (TP53 OR p53 OR p53 protein). The references of the included papers were also carefully checked to get other potential studies.
Study selection
The eligible publications should meet the following inclusion criteria: 1) patients were diagnosed with UC by pathological examination; 2) normal tissue samples belonged to normal control group, UC groups included UC without dysplasia/carcinoma, UC with dysplasia, and UC with colorectal cancer; 3) studies on the immunohistochemical determination of p53 protein expression provided sufficient information to determine the relationship between p53 expression and UC. Only the most complete article with more information was selected in this meta-analysis when authors published multiple articles using the same study population.
Data extraction and quality assessment
According to the above inclusion criteria, two independent authors reviewed and extracted information from the eligible articles: first author’s surname, year of publication, country, number of patients, cut-off values, rate of p53 expression, staining location, and the total number of patients in UC and normal control groups. Any controversial issue was discussed by all authors. The quality of the eligible publications was assessed based on the Newcastle-Ottawa Scale (NOS), ranging from 0 to 9. Studies with 6 or more scores were considered to be of high quality [18].
Statistical analysis
Stata software, version 12.0 (STATA Corp., College Station, TX, USA) was used in this meta-analysis. The overall odds ratios (ORs) and their corresponding 95% confidence intervals (95% CIs) were calculated to estimate the strength of the relationship between p53 expression and UC risk. Possible heterogeneity among reported studies was measured using the Cochran’s Q statistic [19]. The random-effects model was chosen in the present study. A P value of <0.1 for the Q-test showed a substantial heterogeneity, a sensitivity analysis was conducted to evaluate the influence of one study on the pooled results by omitting a single study [20]. For the pooled data with more than eight studies, Egger’s test was performed to determine possible publication bias [21].
Results
Characteristics of the eligible studies
As indicated in Fig. 1, 555 potential papers were initially searched from a range of online electronic databases (PubMed, Embase, EBSCO, Wangfang, and CNKI). According to the above study selection, final 19 articles published from 1993 to 2013 [14, 15, 17, 22–37] were identified in the current meta-analysis, including 1068 patients with UC and 130 normal tissue samples. Nine studies evaluated the correlation of p53 expression in UC versus normal tissue samples. 11 studies evaluated the correlation of p53 expression in UC with dysplasia versus UC without dysplasia and carcinoma. 16 studies evaluated the relationship of p53 expression in UC with carcinoma versus UC with dysplasia. All studies met a score of equal to or greater than 6 in this meta-analysis (Additional file 1: Table S1). Table 1 lists the baseline characteristics of the included studies.
Fig. 1.
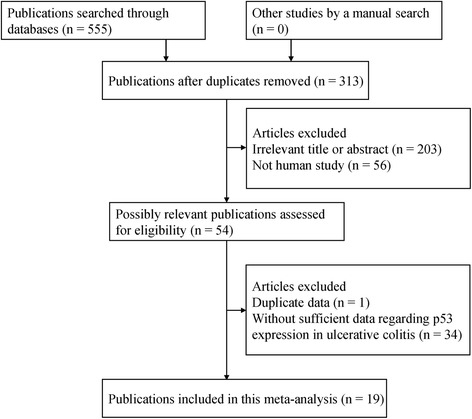
Flowchart summarizing literature search strategy and selection of studies
Table 1.
General characteristics of the eligible publications in this study
| First author | Country | Ethnicity | Age | Cut-off (IHC) | Location | Normal | UC | UC with dysplasia | UC with cancer | NOS |
|---|---|---|---|---|---|---|---|---|---|---|
| N (E%) | N (E%) | N (E%) | N (E%) | |||||||
| Taylor 1993 [29] | UK | Caucasians | NA | NA | Nucleus | 20 (0) | 20 (30) | 21 (52.4) | 9 | |
| Harpaz 1994 [28] | USA | Caucasians | NA | 10% | Nucleus | 40 (62.5) | 56 (60.7) | 7 | ||
| Klump 1997 [15] | Germany | Caucasians | NA | 0% | Nucleus | 68 (2.9) | 27 (63) | 5 (100) | 8 | |
| Fogt 1998 [27] | USA | Caucasians | NA | 0% | Nucleus | 10 (90) | 8 (87.5) | 7 | ||
| Sato 1999 [26] | Japan | Asians | NA | NA | Nucleus | 35 (14.3) | 105 (41) | 55 (67.3) | 11 (90.9) | 6 |
| Hirota 2000 [25] | Japan | Asians | NA | Focal or diffuse | Nucleus | 40 (60) | 13 (92.3) | 6 | ||
| Ishitsuka 2001 [24] | Japan | Asians | NA | Local or diffuse | Nucleus | 23 (0) | 13 (61.5) | 4 (75) | 6 | |
| Brüwer 2002 [23] | Germany | Caucasians | NA | 0% | Nucleus | 10 (0) | 15 (6.7) | 16 (37.5) | 14 (57.1) | 9 |
| Li 2004 [17] | China | Asians | 44 | 10% | Nucleus | 25 (0) | 5 (0) | 14 (21.4) | 2 (50) | 7 |
| Yoshida 2004 [22] | Japan | Asians | NA | Scattered | Nucleus | 7 (28.6) | 19 (26.3) | 46 (63) | 7 (57.1) | 7 |
| Wang 2005 [30] | China | Asians | 44 | 1% | Nucleus | 25 (4) | 7 (42.9) | 8 (50) | 8 | |
| Wang 2008 [31] | China | Asians | 32 | 5% | Nucleus | 10 (10) | 20 (15) | 6 | ||
| Alkim 2009 [37] | Turkey | Caucasians | 46 | 0% | Nucleus | 10 (40) | 26 (88.5) | 7 | ||
| Kawamata 2011 [14] | Japan | Asians | 28–60 | NA | Nucleus | 12 (0) | 8 (12.5) | 8 (62.5) | 8 (75) | 8 |
| Tanaka 2011 [36] | Japan | Asians | 49.5 | Focal | Nucleus | 28 (0) | 81 (59.3) | 10 (90) | 6 | |
| Gushima 2011 [35] | Japan | Asians | 49 | 10% | Nucleus | 11 (72.7) | 14 (21.4) | 8 | ||
| Scarpa 2013 [34] | Italy | Caucasians | 51 | NA | Nucleus | 11 (9.1) | 19 (5.3) | 10 (20) | 7 (57.1) | 8 |
| Shigaki 2013 [32] | Japan | Asians | 26–80 | 5% | Nucleus | 58 (46.6) | 27 (59.3) | 7 | ||
| Wohl 2013 [33] | Czech Republic | Caucasians | NA | 33% | Nucleus | 10 (0) | 16 (6.3) | 7 |
NA not applicable, UC ulcerative colitis, IHC immunohistochemistry, N study population, NOS Newcastle-Ottawa Scale, E expression
Association of p53 expression in UC without dysplasia and carcinoma versus normal tissue samples
The result of 233 patients with UC vs 130 normal tissue samples demonstrated that the level of p53 expression was notably increased in UC compared with normal tissue samples (OR = 3.14, 95% CI = 1.58–6.24, P = 0.001) (Fig. 2).
Fig. 2.
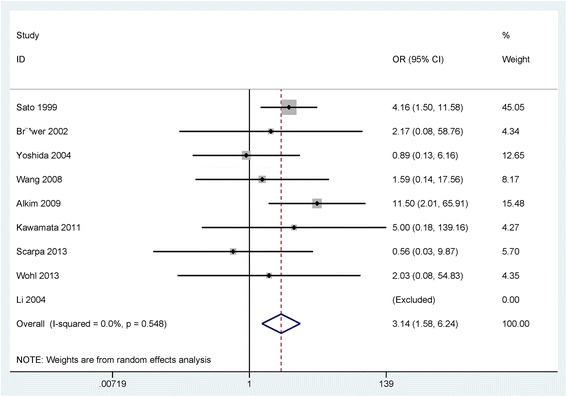
Forest plot of the pooled OR of p53 expression in UC without dysplasia or carcinoma versus normal tissue samples
Subgroup analysis by ethnicity (Asians and Caucasians) showed that p53 expression was linked to Asians with UC (OR = 2.85, 95% CI = 1.25–6.47, P = 0.012), but was not correlated with Caucasians with UC (OR = 3.49, 95% CI = 0.85–14.34, P = 0.083) (Table 2).
Table 2.
Subgroup analysis of ethnicity regarding p53 expression
| Subgroup (ethnicity) | OR (95% CI) | Heterogeneity: P | P value |
|---|---|---|---|
| UC with cancer vs. UC with dysplasia | |||
| Caucasian | 1.60 (0.89–2.86) | 0.459 | 0.116 |
| Asians | 1.65 (0.77–3.56) | 0.104 | 0.198 |
| UC with dysplasia vs. UC | |||
| Caucasian | 18.47 (5.62–60.71) | 0.325 | <0.001 |
| Asians | 8.28 (3.08–22.25) | 0.071 | <0.001 |
| UC vs. normal tissues | |||
| Caucasian | 3.49 (0.85–14.34) | 0.317 | 0.083 |
| Asians | 2.85 (1.25–6.47) | 0.521 | 0.012 |
UC ulcerative colitis, OR odds ratio, 95% CI 95% confidence interval
Association of p53 expression in UC with dysplasia versus UC without dysplasia/carcinoma
The result showed that the frequency of p53 expression was notably higher in UC with dysplasia than in UC without dysplasia/carcinoma (OR = 10.76, 95% CI = 4.63–25.03, P < 0.001), including 297 UC patients with dysplasia and 335 UC patients without dysplasia and carcinoma (Fig. 3).
Fig. 3.
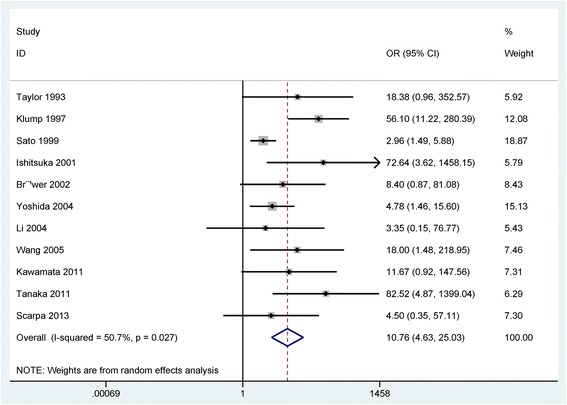
Forest plot of the pooled OR of p53 expression in UC with dysplasia versus without dysplasia or carcinoma
According to ethnic population (Asians and Caucasians) (Table 2), subgroup analysis showed that p53 expression was correlated with UC with dysplasia in the Asian and Caucasian populations (OR = 8.28, 95% CI = 3.08–22.25, P < 0.001; OR = 18.47, 95% CI = 5.62–60.71, P < 0.001).
Association of p53 expression in UC with carcinoma versus UC with dysplasia
The result from the comparison of 215 UC with carcinoma and 456 UC with dysplasia indicated that the frequency of p53 expression in UC with carcinoma was significantly higher than in UC with dysplasia (OR = 1.69, 95% CI = 1.04–2.76, P = 0.035) (Fig. 4).
Fig. 4.
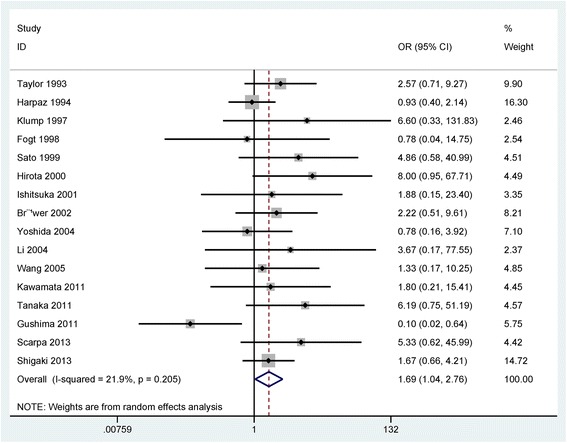
Forest plot of the pooled OR of p53 expression in UC with carcinoma versus with dysplasia
Subgroup analysis based on ethnicity (Asians and Caucasians) showed that p53 expression was not associated with UC-CRC in both Caucasians and Asians (OR = 1.60, 95% CI = 0.89–2.86, P = 0.116; OR = 1.65, 95% CI = 0.77–3.56, P = 0.198; respectively) (Table 2).
Sensitivity analysis in UC with dysplasia versus UC without dysplasia/carcinoma
A slight heterogeneity was found in UC with dysplasia versus UC without dysplasia/carcinoma (P = 0.027). When one study (Klump 1997 et al. [15]) was removed, and the overall OR value was re-calculated (OR = 7.28, 95% CI = 3.48–15.21), P < 0.001), with no evidence of heterogeneity (P = 0.181).
Publication bias
Egger’s test showed that no publication bias was observed in the comparison of UC without dysplasia/carcinoma and normal tissue samples and the comparison of UC with carcinoma and UC with dysplasia (P > 0.1) (Fig. 5). A slight publication bias was found in UC with dysplasia versus UC without dysplasia and carcinoma (P = 0.023 < 0.05) (Fig. 5).
Fig. 5.
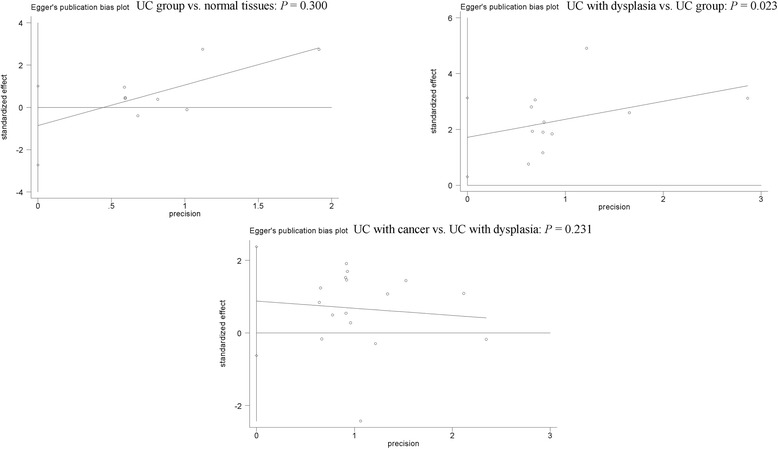
Forest plot of publication bias using Egger’s test
Discussion
TSG p53 expression has been frequently reported in human malignancies [38, 39]. Some studies suggest that positive expression of the p53 gene is linked to the development and progression of tumors [40–42]. Immunohistochemical analysis of p53 protein expression is also found in patients with UC [32, 34]. However, the results regarding p53 expression in different pathological types of UC are still inconsistent and conflicting. The present study was carried out to analyze whether p53 expression was associated with the increased risk of UC with dysplasia and carcinoma.
p53 gene showed different expression levels in UC-associated different pathological types, ranging from 0% [14, 17, 23, 33] to 40% [37] in normal tissue samples, and ranging from 0% [17, 24, 29, 36] to 88.5% [37] in UC without dysplasia and carcinoma. The expression of the p53 gene had different frequencies in UC with dysplasia or carcinoma, with a range from 20% [34] to 90% [27] in UC with dysplasia, and with a range from 21.4% [35] to 100% [15] in UC with CRC. This study integrated all available studies involving a large population showed that immunohistochemical detection of p53 protein expression was significantly higher in UC with CRC than in UC with dysplasia, higher in UC with dysplasia than in UC without dysplasia and carcinoma, and higher in UC without dysplasia and carcinoma than in normal tissue samples, which suggested that p53 expression was closely linked to UC-CRC carcinogenesis and the progression of UC with dysplasia. In addition, a slight heterogeneity was detected in UC with dysplasia versus UC without dysplasia and carcinoma (P = 0.027 < 0.1). Thus, we conducted a sensitivity analysis to assess the change of the pooled OR and heterogeneity based on the omission of one study. We removed one study [15], and a re-calculated OR was not significantly changed, with no evidence of heterogeneity (P = 0.181), suggesting the stability of the current result. The reasons of heterogeneity from this study and other studies were not clear, perhaps due to the use of inappropriate or different conditions in IHC method, which may cause an observed bias.
Subgroup analysis of ethnicity (the Asian and Caucasian populations) was performed to find different correlation among different subgroups. When UC without dysplasia and carcinoma was compared to normal tissue samples, the result of subgroup analysis revealed that only Asians were susceptible to p53 expression. When UC with dysplasia was compared to UC without dysplasia and carcinoma, the result showed that the Asian and Caucasian populations were susceptible to p53 expression. When UC with carcinoma was compared to UC with dysplasia, the result demonstrated that Asians and Caucasians were not susceptible to p53 expression.
Some limitations should be noted in the present meta-analysis. First, although a range of online electronic databases was systematically searched to identify available publications. Egger’s test demonstrated a slight publication bias in UC with dysplasia vs. UC without dysplasia and carcinoma. Only papers published in English or Chinese were included in this meta-analysis. The unpublished articles or conference abstracts were excluded because of insufficient information. Articles with positive conclusions were usually published than these articles with negative conclusions. Second, the main ethnic groups consisted of Asians and Caucasians in this study, but other study populations, such as African population, were lacking. Finally, three eligible studies reported the data between p53 expression and dysplasia and cancer in patients with Crohn’s disease (CD) [37, 43, 44], more studies with large sample sizes are essential to further perform a meta-analysis to assess the correlation of p53 expression in CD in the future.
Conclusions
This study suggests that p53 gene has a notably higher expression frequency in UC-CRC than in UC with dysplasia, higher expression level in UC with dysplasia than in UC without dysplasia and carcinoma, and higher expression rate in UC without dysplasia and carcinoma than in normal tissue samples. Further large-scale clinical trials with large sample sizes are needed to validate our conclusions in the future.
Acknowledgements
Not applicable.
Funding
None.
Availability of data and materials
All data and materials were presented within the manuscript and additional supporting files.
Abbreviations
- Cis
Confidence intervals
- CRC
Colorectal cancer
- IBD
Inflammatory bowel diseases
- IHC
Immunohistochemistry
- NOS
Newcastle-Ottawa Scale
- ORs
Odds ratios
- TSG
Tumor-suppressor gene
- UC
Ulcerative colitis
Additional file
Study quality using Newcastle-Ottawa-Scale (NOS). (DOCX 17 kb)
Authors’ contributions
LXH contributed to the conception and design of the current study, wrote the article and revised it for important intellectual content. YYJ and TSY contributed to the retrieval of articles, the extraction of data, the calculation of data and the design of the figures and tables. All the authors approved the final paper.
Ethics approval and consent to participate
Not applicable.
Consent for publication
Not applicable.
Competing interests
The authors declare that they have no competing interests.
Publisher’s Note
Springer Nature remains neutral with regard to jurisdictional claims in published maps and institutional affiliations.
Footnotes
Electronic supplementary material
The online version of this article (10.1186/s12876-017-0665-y) contains supplementary material, which is available to authorized users.
Contributor Information
Xiaohong Lu, Phone: (027) 88041911, Email: luxiaohong@medmail.com.cn.
Yuanjie Yu, Email: kpo0336644@sina.com.
Shiyun Tan, Email: sche4657057@sina.com.
References
- 1.Feuerstein JD, Cheifetz AS. Ulcerative colitis: epidemiology, diagnosis, and management. Mayo Clin Proc. 2014;89(11):1553–1563. doi: 10.1016/j.mayocp.2014.07.002. [DOI] [PubMed] [Google Scholar]
- 2.Marchioni Beery R, Kane S. Current approaches to the management of new-onset ulcerative colitis. Clin Exp Gastroenterol. 2014;7:111–132. doi: 10.2147/CEG.S35942. [DOI] [PMC free article] [PubMed] [Google Scholar]
- 3.Choi JK, Kim DW, Shin SY, Park EC, Kang JG. Effect of ulcerative colitis on incidence of colorectal cancer: results from the Nationwide population-based cohort study (2003–2013) J Cancer. 2016;7(6):681–686. doi: 10.7150/jca.14264. [DOI] [PMC free article] [PubMed] [Google Scholar]
- 4.Burisch J, Munkholm P. The epidemiology of inflammatory bowel disease. Scand J Gastroenterol. 2015;50(8):942–951. doi: 10.3109/00365521.2015.1014407. [DOI] [PubMed] [Google Scholar]
- 5.Ventham NT, Kennedy NA, Adams AT, Kalla R, Heath S, O'Leary KR, Drummond H, Consortium IB, Consortium IC, Wilson DC, Gut IG, Nimmo ER, Satsangi J. Integrative epigenome-wide analysis demonstrates that DNA methylation may mediate genetic risk in inflammatory bowel disease. Nat Commun. 2016;7:13507. doi: 10.1038/ncomms13507. [DOI] [PMC free article] [PubMed] [Google Scholar]
- 6.Sun M, Zhang L, Shi S. Associations between NRAMP1 polymorphisms and susceptibility to ulcerative colitis/Crohn's disease: a meta-analysis. Immunol Investig. 2016;45(3):255–270. doi: 10.3109/08820139.2016.1149191. [DOI] [PubMed] [Google Scholar]
- 7.Anderson CA, Boucher G, Lees CW, Franke A, D'Amato M, Taylor KD, Lee JC, Goyette P, Imielinski M, Latiano A, Lagace C, Scott R, Amininejad L, Bumpstead S, Baidoo L, Baldassano RN, et al. Meta-analysis identifies 29 additional ulcerative colitis risk loci, increasing the number of confirmed associations to 47. Nat Genet. 2011;43(3):246–252. doi: 10.1038/ng.764. [DOI] [PMC free article] [PubMed] [Google Scholar]
- 8.Van Assche G, Dignass A, Bokemeyer B, Danese S, Gionchetti P, Moser G, Beaugerie L, Gomollon F, Hauser W, Herrlinger K, Oldenburg B, Panes J, Portela F, Rogler G, Stein J, Tilg H, et al. Second European evidence-based consensus on the diagnosis and management of ulcerative colitis part 3: special situations. J Crohns Colitis. 2013;7(1):1–33. doi: 10.1016/j.crohns.2012.09.005. [DOI] [PubMed] [Google Scholar]
- 9.McBride OW, Merry D, Givol D. The gene for human p53 cellular tumor antigen is located on chromosome 17 short arm (17p13) Proc Natl Acad Sci U S A. 1986;83(1):130–134. doi: 10.1073/pnas.83.1.130. [DOI] [PMC free article] [PubMed] [Google Scholar]
- 10.Soussi T. The p53 pathway and human cancer. Br J Surg. 2005;92(11):1331–1332. doi: 10.1002/bjs.5177. [DOI] [PubMed] [Google Scholar]
- 11.Steele RJ, Thompson AM, Hall PA, Lane DP. The p53 tumour suppressor gene. Br J Surg. 1998;85(11):1460–1467. doi: 10.1046/j.1365-2168.1998.00910.x. [DOI] [PubMed] [Google Scholar]
- 12.Davelaar AL, Calpe S, Lau L, Timmer MR, Visser M, Ten Kate FJ, Parikh KB, Meijer SL, Bergman JJ, Fockens P and Krishnadath KK. Aberrant TP53 detected by combining immunohistochemistry and DNA-FISH improves Barrett's esophagus progression prediction: a prospective follow-up study. Genes Chromosomes Cancer 2015; 54(2):82–90. [DOI] [PubMed]
- 13.Hollstein M, Sidransky D, Vogelstein B, Harris CC. p53 mutations in human cancers. Science. 1991;253(5015):49–53. doi: 10.1126/science.1905840. [DOI] [PubMed] [Google Scholar]
- 14.Kawamata S, Matsuzaki K, Murata M, Seki T, Matsuoka K, Iwao Y, Hibi T, Okazaki K. Oncogenic Smad3 signaling induced by chronic inflammation is an early event in ulcerative colitis-associated carcinogenesis. Inflamm Bowel Dis. 2011;17(3):683–695. doi: 10.1002/ibd.21395. [DOI] [PubMed] [Google Scholar]
- 15.Klump B, Holzmann K, Kuhn A, Borchard F, Sarbia M, Gregor M, Porschen R. Distribution of cell populations with DNA aneuploidy and p53 protein expression in ulcerative colitis. Eur J Gastroenterol Hepatol. 1997;9(8):789–794. doi: 10.1097/00042737-199708000-00010. [DOI] [PubMed] [Google Scholar]
- 16.Du L, Kim JJ, Shen J, Chen B, Dai NKRAS. TP53 mutations in inflammatory bowel disease-associated colorectal cancer: a meta-analysis. Oncotarget. 2017;8(13):22175–22186. doi: 10.18632/oncotarget.14549. [DOI] [PMC free article] [PubMed] [Google Scholar]
- 17.Li J, Lai MD, Huang Q. Alterations of p53 gene and microsatellite instability in ulcerative colitis and ulcerative colitis-associated colorectal cancer. Zhejiang Da Xue Xue Bao Yi Xue Ban. 2004;33(2):108–114. doi: 10.3785/j.issn.1008-9292.2004.02.004. [DOI] [PubMed] [Google Scholar]
- 18.Ding Y, Yang Q, Wang B, Ye G, Tong X. The correlation of MGMT promoter methylation and Clinicopathological features in gastric cancer: a systematic review and meta-analysis. PLoS One. 2016;11(11):e0165509. doi: 10.1371/journal.pone.0165509. [DOI] [PMC free article] [PubMed] [Google Scholar]
- 19.Zintzaras E, Ioannidis JPHEGESMA. Genome search meta-analysis and heterogeneity testing. Bioinformatics. 2005;21(18):3672–3673. doi: 10.1093/bioinformatics/bti536. [DOI] [PubMed] [Google Scholar]
- 20.Lau J, Ioannidis JP, Schmid CH. Quantitative synthesis in systematic reviews. Ann Intern Med. 1997;127(9):820–826. doi: 10.7326/0003-4819-127-9-199711010-00008. [DOI] [PubMed] [Google Scholar]
- 21.Egger M, Davey Smith G, Schneider M, Minder C. Bias in meta-analysis detected by a simple, graphical test. BMJ. 1997;315(7109):629–634. doi: 10.1136/bmj.315.7109.629. [DOI] [PMC free article] [PubMed] [Google Scholar]
- 22.Yoshida T, Matsumoto N, Mikami T, Okayasu I. Upregulation of p16(INK4A) and Bax in p53 wild/p53-overexpressing crypts in ulcerative colitis-associated tumours. Br J Cancer. 2004;91(6):1081–1088. doi: 10.1038/sj.bjc.6602050. [DOI] [PMC free article] [PubMed] [Google Scholar]
- 23.Bruwer M, Schmid KW, Senninger N, Schurmann G. Immunohistochemical expression of P53 and oncogenes in ulcerative colitis-associated colorectal carcinoma. World J Surg. 2002;26(3):390–396. doi: 10.1007/s00268-001-0237-7. [DOI] [PubMed] [Google Scholar]
- 24.Ishitsuka T, Kashiwagi H, Konishi F. Microsatellite instability in inflamed and neoplastic epithelium in ulcerative colitis. J Clin Pathol. 2001;54(7):526–532. doi: 10.1136/jcp.54.7.526. [DOI] [PMC free article] [PubMed] [Google Scholar]
- 25.Hirota Y, Tanaka S, Haruma K, Yoshihara M, Sumii K, Kajiyama G, Shimamoto F, Kohno N. pS2 expression as a possible diagnostic marker of colorectal carcinoma in ulcerative colitis. Oncol Rep. 2000;7(2):233–239. [PubMed] [Google Scholar]
- 26.Sato A and MacHinami R. p53 immunohistochemistry of ulcerative colitis-associated with dysplasia and carcinoma. Pathol Int 1999; 49(10):858–868. [DOI] [PubMed]
- 27.Fogt F, Zhuang Z, Poremba C, Dockhorn-Dworniczak B, Vortmeyer A. Comparison of p53 immunoexpression with allelic loss of p53 in ulcerative colitis-associated dysplasia and carcinoma. Oncol Rep. 1998;5(2):477–480. doi: 10.3892/or.5.2.477. [DOI] [PubMed] [Google Scholar]
- 28.Harpaz N, Peck AL, Yin J, Fiel I, Hontanosas M, Tong TR, Laurin JN, Abraham JM, Greenwald BD, Meltzer SJ. p53 protein expression in ulcerative colitis-associated colorectal dysplasia and carcinoma. Hum Pathol. 1994;25(10):1069–1074. doi: 10.1016/0046-8177(94)90067-1. [DOI] [PubMed] [Google Scholar]
- 29.Taylor HW, Boyle M, Smith SC, Bustin S, Williams NS. Expression of p53 in colorectal cancer and dysplasia complicating ulcerative colitis. Br J Surg. 1993;80(4):442–444. doi: 10.1002/bjs.1800800411. [DOI] [PubMed] [Google Scholar]
- 30.Wang H, Yan LI, Zhang WW. The expression of P53,K-ras and hMSH2 in ulcerative colitis-associated colorectal cancer. Chinese Journal of Digestion. 2005;
- 31.Wang YY, QiU B, Yu J, Li XR, Tian YL, Zhang PY, Shi CL, Chen XY. The expression of CD15, myeloperoxidase, P53 and Rb in ulcerative colitis, adenoma, and colorectal cancer. Chin J. Dig. 2008;28(3):194–196. [Google Scholar]
- 32.Shigaki K, Mitomi H, Fujimori T, Ichikawa K, Tomita S, Imura J, Fujii S, Itabashi M, Kameoka S, Sahara R, Takenoshita S. Immunohistochemical analysis of chromogranin a and p53 expressions in ulcerative colitis-associated neoplasia: neuroendocrine differentiation as an early event in the colitis-neoplasia sequence. Hum Pathol. 2013;44(11):2393–2399. doi: 10.1016/j.humpath.2013.06.008. [DOI] [PubMed] [Google Scholar]
- 33.Wohl P, Hucl T, Drastich P, Kamenar D, Spicak J, Honsova E, Sticova E, Lodererova A, Matous J, Hill M, Wohl P, Kucera M. Epithelial markers of colorectal carcinogenesis in ulcerative colitis and primary sclerosing cholangitis. World J Gastroenterol. 2013;19(14):2234–2241. doi: 10.3748/wjg.v19.i14.2234. [DOI] [PMC free article] [PubMed] [Google Scholar]
- 34.Scarpa M, Cardin R, Bortolami M, Kotsafti A, Scarpa MC, Pozza A, Maran G, Picciocchi M, Ruffolo C, D'Inca R, Sturniolo GC, Castagliuolo I, Castoro C, Angriman I. Mucosal immune environment in colonic carcinogenesis: CD80 expression is associated to oxidative DNA damage and TLR4-NFkappaB signalling. Eur J Cancer. 2013;49(1):254–263. doi: 10.1016/j.ejca.2012.05.015. [DOI] [PubMed] [Google Scholar]
- 35.Gushima M, Hirahashi M, Matsumoto T, Fujita K, Ohuchida K, Oda Y, Yao T, Iida M, Tsuneyoshi M. Expression of activation-induced cytidine deaminase in ulcerative colitis-associated carcinogenesis. Histopathology. 2011;59(3):460–469. doi: 10.1111/j.1365-2559.2011.03965.x. [DOI] [PubMed] [Google Scholar]
- 36.Tanaka H, Fukui H, Fujii S, Sekikawa A, Yamagishi H, Ichikawa K, Tomita S, Imura J, Yasuda Y, Chiba T, Fujimori T. Immunohistochemical analysis of REG Ialpha expression in ulcerative colitis-associated neoplastic lesions. Digestion. 2011;83(3):204–209. doi: 10.1159/000321808. [DOI] [PubMed] [Google Scholar]
- 37.Alkim C, Savas B, Ensari A, Alkim H, Dagli U, Parlak E, Ulker A, Sahin B. Expression of p53, VEGF, microvessel density, and cyclin-D1 in noncancerous tissue of inflammatory bowel disease. Dig Dis Sci. 2009;54(9):1979–1984. doi: 10.1007/s10620-008-0554-x. [DOI] [PubMed] [Google Scholar]
- 38.Inoue K, Kurabayashi A, Shuin T, Ohtsuki Y, Furihata M. Overexpression of p53 protein in human tumors. Med Mol Morphol. 2012;45(3):115–123. doi: 10.1007/s00795-012-0575-6. [DOI] [PubMed] [Google Scholar]
- 39.Baas IO, Mulder JW, Offerhaus GJ, Vogelstein B, Hamilton SR. An evaluation of six antibodies for immunohistochemistry of mutant p53 gene product in archival colorectal neoplasms. J Pathol. 1994;172(1):5–12. doi: 10.1002/path.1711720104. [DOI] [PubMed] [Google Scholar]
- 40.Alaizari NA, Tarakji B, Al-Maweri SA, Al-Shamiri HM, Darwish S, Baba F. p53 expression in pleomorphic adenoma of salivary glands: A systematic review and meta-analysis. Arch Oral Biol. 2015;60(9):1437–1441. doi: 10.1016/j.archoralbio.2015.06.019. [DOI] [PubMed] [Google Scholar]
- 41.Mitchell S, Mayer E, Patel A. Expression of p53 in upper urinary tract urothelial carcinoma. Nat Rev Urol. 2011;8(9):516–522. doi: 10.1038/nrurol.2011.92. [DOI] [PubMed] [Google Scholar]
- 42.Junior AT, de Abreu Alves F, Pinto CA, Carvalho AL, Kowalski LP, Lopes MA. Clinicopathological and immunohistochemical analysis of twenty-five head and neck osteosarcomas. Oral Oncol. 2003;39(5):521–530. doi: 10.1016/S1368-8375(03)00017-4. [DOI] [PubMed] [Google Scholar]
- 43.Laurent C, Svrcek M, Flejou JF, Chenard MP, Duclos B, Freund JN, Reimund JM. Immunohistochemical expression of CDX2, beta-catenin, and TP53 in inflammatory bowel disease-associated colorectal cancer. Inflamm Bowel Dis. 2011;17(1):232–240. doi: 10.1002/ibd.21451. [DOI] [PubMed] [Google Scholar]
- 44.Romero M, Artigiani R, Costa H, Oshima CT, Miszputen S, Franco M. Evaluation of the immunoexpression of COX-1, COX-2 and p53 in Crohn's disease. Arq Gastroenterol. 2008;45(4):295–300. doi: 10.1590/S0004-28032008000400007. [DOI] [PubMed] [Google Scholar]
Associated Data
This section collects any data citations, data availability statements, or supplementary materials included in this article.
Data Availability Statement
All data and materials were presented within the manuscript and additional supporting files.


