Abstract
Purpose
Using common datasets, to estimate and compare the diagnostic performance of image‐based denoising techniques or iterative reconstruction algorithms for the task of detecting hepatic metastases.
Methods
Datasets from contrast‐enhanced CT scans of the liver were provided to participants in an NIH‐, AAPM‐ and Mayo Clinic‐sponsored Low Dose CT Grand Challenge. Training data included full‐dose and quarter‐dose scans of the ACR CT accreditation phantom and 10 patient examinations; both images and projections were provided in the training data. Projection data were supplied in a vendor‐neutral standardized format (DICOM‐CT‐PD). Twenty quarter‐dose patient datasets were provided to each participant for testing the performance of their technique. Images were provided to sites intending to perform denoising in the image domain. Fully preprocessed projection data and statistical noise maps were provided to sites intending to perform iterative reconstruction. Upon return of the denoised or iteratively reconstructed quarter‐dose images, randomized, blinded evaluation of the cases was performed using a Latin Square study design by 11 senior radiology residents or fellows, who marked the locations of identified hepatic metastases. Markings were scored against reference locations of clinically or pathologically demonstrated metastases to determine a per‐lesion normalized score and a per‐case normalized score (a faculty abdominal radiologist established the reference location using clinical and pathological information). Scores increased for correct detections; scores decreased for missed or incorrect detections. The winner for the competition was the entry that produced the highest total score (mean of the per‐lesion and per‐case normalized score). Reader confidence was used to compute a Jackknife alternative free‐response receiver operating characteristic (JAFROC) figure of merit, which was used for breaking ties.
Results
103 participants from 90 sites and 26 countries registered to participate. Training data were shared with 77 sites that completed the data sharing agreements. Subsequently, 41 sites downloaded the 20 test cases, which included only the 25% dose data (CTDIvol = 3.0 ± 1.8 mGy, SSDE = 3.5 ± 1.3 mGy). 22 sites submitted results for evaluation. One site provided binary images and one site provided images with severe artifacts; cases from these sites were excluded from review and the participants removed from the challenge. The mean (range) per‐lesion and per‐case normalized scores were −24.2% (−75.8%, 3%) and 47% (10%, 70%), respectively. Compared to reader results for commercially reconstructed quarter‐dose images with no noise reduction, 11 of the 20 sites showed a numeric improvement in the mean JAFROC figure of merit. Notably two sites performed comparably to the reader results for full‐dose commercial images. The study was not designed for these comparisons, so wide confidence intervals surrounded these figures of merit and the results should be used only to motivate future testing.
Conclusion
Infrastructure and methodology were developed to rapidly estimate observer performance for liver metastasis detection in low‐dose CT examinations of the liver after either image‐based denoising or iterative reconstruction. The results demonstrated large differences in detection and classification performance between noise reduction methods, although the majority of methods provided some improvement in performance relative to the commercial quarter‐dose images with no noise reduction applied.
Keywords: CT, denoising, dose reduction, grand challenge, iterative reconstruction
1. Introduction
In spite of the overwhelming benefit to patient care that is associated with CT imaging, there has arisen in recent years a strong concern with regard to the population dose levels associated with CT imaging.1, 2, 3, 4, 5 As a consequence, the number of scientific publications and commercial features related to reducing dose levels in CT has significantly increased. These efforts have included automated methods to adapt the delivered radiation exposure to the patient size (automatic exposure control, tube current modulation, automated tube potential selection), as well as image‐based denoising techniques and projection‐based iterative reconstruction algorithms.6, 7 To reduce the radiation dose delivered per examination, the National Institute of Biomedical Imaging and Bioengineering (NIBIB) initiated a funding program that aimed to reduce the dose levels from CT, if not to sub‐mSv levels, to levels consistent with background radiation (approximately 3 mSv effective dose).8 One of the proposals funded through this mechanism, titled “Critical resources necessary to achieve sub‐mSv CT”, aimed to provide data, metrics, and software tools necessary to demonstrate that any dose reduction achieved is not at the expense of diagnostic performance. With this funding, the investigators developed an enriched library of reference patient datasets containing both negative and positive cases.9 For these cases, the reference 100% dose level images and projection data are available, as well as projection data into which various levels of noise was inserted via a validated and highly accurate technique.10 This resulted in a set of simulated low‐dose patient datasets. The projection data are available to the CT research community using a vendor‐neutral projection data format: DICOM‐CT‐PD, which stands for digital imaging and communications in medicine (DICOM) CT projection data.11
The availability of such a library allows for the evaluation and comparison of proposed denoising and iterative reconstruction techniques on common datasets. The objective of this study, therefore, was to provide a mechanism for estimating and comparing the diagnostic performance of these techniques on common datasets and allowing direct comparison of the various algorithms. An additional objective was to provide an indication of the range of achieved performances for various denoising or iterative reconstruction techniques. In addition, the infrastructure developed for the challenge allowed sharing of patient datasets with algorithm developers and provided feedback on observer performance to a wide variety of institutions. By identifying the range of performance currently achievable, some limitations of currently developed algorithms were identified and baseline performance established to aid in the development or refinement of future algorithms.
The organization of this paper follows the overall study design. First, the library of patient image and projection data is described, including case inclusion criteria, scan protocol and source of reference validation. The DICOM‐like format used to share the projection data and the method used to insert noise into the projection data are also described. Details about the training and testing cases and the radiologist evaluation of the returned test data are provided, as are scoring and statistical considerations. In addition to a percent correct type of scoring, with a penalty for false positive or false negative reader markings, a Jackknife alternative free‐response receiver operating characteristic (JAFROC) figure of merit was calculated to evaluate reader performance on the images from each participating site. These methods together describe the mechanics of conducting the challenge. After summarizing the participation data, the per case and per lesion scores for each site are provided, with a breakdown of results in terms of performance rank order. Additional data are provided that describe the variability of reader scores, and sample images and the JAFROC scores are provided. The results show large differences in performance between noise reduction methods, although the majority of methods provided some improvement relative to the commercial quarter‐dose images with no noise reduction applied. For the same reader pool, the performance of the highest ranked sites were not dissimilar to the full dose results, although the large error bars due to the low number of cases and the specificity of the reader task prevent drawing strong conclusions about the clinical acceptability of the evaluated algorithms.
2. Methods
2.A. Data
The patient images and projection data used in this study were from the library of reference patient datasets described above. These data were retrospectively obtained from clinically indicated examinations after approval by our institutional review board. The library was HIPAA compliant and built with waiver of informed consent. All data shared in the challenge were fully anonymized. (The data are available to users outside of the challenge by contacting the corresponding author.) A unique case number was assigned, and only the host site had the key, which was maintained in a secure fashion at the host institution. The patient data library consisted of image and projection data from contrast‐enhanced abdominal CT examinations in the portal‐venous phase of enhancement selected by the host institution according to the following criteria:
Inclusion criteria for positive cases:
Presence of hepatic metastasis identified by histology (surgery or biopsy), or progression on serial cross‐sectional exams, or regression on serial exams (with treatment), as previously defined.12
Exclusion criteria for positive cases:
-
a.
Any liver metastasis greater than 5 cm
-
b.
More than 10 hepatic metastases in the same patient
Inclusion criteria for negative cases without hepatic metastases:
-
a.
Interpretation of axial and coronal images by two subspecialized abdominal radiologists verifying absence of any intrahepatic lesion, or
-
b.
Identification of proven benign lesion, as previously described,12 confirmed by typical appearance (hemangioma, cyst), and stability over six months as evidenced by cross‐sectional imaging findings, or histology
All data were obtained on similar scanner models (Somatom Definition AS+ or Somatom Definition Flash operated in single‐source mode, Siemens Healthcare, Forchheim, Germany). Following the routine clinical protocol of the host institution, data were acquired with use of automated exposure control (CAREDose 4D, Siemens Healthcare) and automated tube potential selection (CAREkV, Siemens Healthcare). CAREkV determined the appropriate tube potential based on the patient attenuation level. Other scan parameter settings were 64 × 0.6 mm collimation with z‐axis flying focal spot, 0.5 s rotation, and pitch of 0.8. A weight‐based injection of iodinated contrast material (Omnipaque 300, GE Healthcare, Princeton, NJ, USA) was delivered according to the practice of the host institution. Scans were obtained 70 s after contrast injection (portal venous phase). Other scan phases, if obtained, were not included in the data library. Images were reconstructed using a 512 × 512 image matrix, with the reconstruction field of view set to patient size. The reference tube potential and quality reference effective mAs (QRM) used by the automated tube potential and exposure control system for this study were, respectively, 120 kVp and 200 QRM. Due to the use of automated tube potential selection in our practice, 14 out of the 20 case were scanned with a 100 kV tube potential, providing improved iodine signal. For 14 these cases, a low‐dose simulation tool was used to generate datasets with noise equivalent to that from a 120 kV and 200 QRM scan of the same patient; no adjustment of iodine contrast was performed as we purposely sought to determine the maximum noise levels (i.e., dose reductions) in a practice using the automated tube potential feature to increase iodine signal in thin to moderate size patients (where 100 kV was able to be used). For all exams, the 120 kV and 200 QRM technique level was referred to as “full dose”. Images were reconstructed using a medium‐smooth body kernel (B30) and a quantitative sharp kernel (D45), both using the filtered‐backprojection reconstruction (FBP) method. Each kernel was used to reconstruct images at 3 mm thickness and 2 mm overlap and at 1 mm thickness and 0.5 mm overlap.
Cases included in the data library were either negative for findings in the liver or had focal liver lesions. Both benign and metastatic liver lesions were included, and readers were tasked with identifying only liver metastases. Thus, both detection and characterization tasks were performed by the readers. Reference data were gathered for each patient case in order to provide a definitive diagnosis. Prior to the beginning of the study, a faculty abdominal radiologist with over 15 yr of experience marked and annotated all hepatic metastases and benign liver lesions in all cases using a specialized computer workstation (discussed below).
2.B. Noise insertion to simulate reduced dose levels
For patient cases, in addition to the full‐dose projection data acquired at regular clinical dose levels (or generated from higher dose levels), projection data at a quarter dose level were also provided, which were simulated by inserting noise into the regular dose projection data using a verified technique.10
2.C. Projection data conversion to the DICOM‐CT‐PD format
All projection data were converted from the proprietary Siemens raw data format to the DICOM‐CT‐PD format recently developed by our team.11 This raw data format is open to the CT community, uses a modified version of the DICOM standard, and is vendor neutral. The projection data were taken from right before image reconstruction, that is, after all preprocessing and the logarithm operation. For reconstruction algorithms requiring statistical information, a noise map, expressed as an array describing the spatial distribution of noise equivalent quanta along the direction of the detector columns, taking into account the shape of the bowtie filter and automatic tube current modulation, and neglecting the variation across detector rows, was provided. The noise map was generated using the technique described in Ref. 10.
2.D. Training data
Ten patient cases annotated with lesion locations were provided to each participant. Of these cases, 2 cases had no liver lesions; 1 case had benign liver lesions only (n = 5); 3 cases had benign liver lesions with hepatic metastases (benign lesions = 6; hepatic metastases = 11); and 4 cases had only liver metastases (n = 8). These cases were excluded from further analysis in the testing phase. The cases were deemed by the host institution to include both subtle and typical lesions, as well as negative cases. Of the 20 liver metastases in the training dataset, 70% (14/20) were felt by the supervising abdominal radiologist to be subtle (e.g., due to small size or small attenuation differences compared with the surrounding hepatic parenchyma), and 30% (6/20) were felt to be obvious. A typical range of patient sizes was included in the training data set. In addition, an ACR CT accreditation phantom13 was scanned and reconstructed using the same parameters given above, except that automated exposure control and tube potential systems were shut off. The phantom data were collected at 120 kV and 200 effective mAs for full dose and 50 effective mAs for quarter dose.
For the patient and phantom scan data, both the full dose and quarter dose (25% of full dose) data were provided, both as fully preprocessed projection data and as image data. At each dose level, four sets of image data were provided (3 mm thick at B30 and D45 and 1 mm thick at B30 and D45). In addition to the image and projection data, each site was provided with a CT image and reference standard diagnosis for every malignant and benign liver lesion included in the training set.
2.E. Test datasets
Twenty patient cases were selected from the described library by an experienced abdominal radiologist for use as the test cases. The cases, which included a range of patient sizes, included normal exams (no liver lesions), exams with only benign liver lesions (e.g., cysts), exams with only metastatic lesions, and exams with both metastases and benign liver lesions. There were 14 patients with hepatic metastases (primary cancer: colorectal — 5; neuroendocrine — 2; lung — 2; pancreatic, thyroid, melanoma, prostate, cholangiocarcinoma — 1 each). Water equivalent diameter (WED) was calculated for each patient in accordance with the methodology outlined in AAPM Report 220.14 Using WED and the scanner‐reported CTDIvol for each patient, size‐specific dose estimates (SSDE) were also calculated.15 The characteristics of each test case (for the quarter dose setting) are given in Table 1.
Table 1.
Characteristics of the test data sets. WED, water equivalent diameter; SSDE, size specific dose estimate
| Case no. | Tube potential (kV) | WED (cm) | SSDE (mGy) | No. of benign lesions | No. of metastases |
|---|---|---|---|---|---|
| 1 | 120 | 36.4 | 2.9 | 1 | 2 |
| 2 | 100 | 28.2 | 2.7 | 1 | 0 |
| 3 | 100 | 33.6 | 3.8 | 0 | 2 |
| 4 | 100 | 25.2 | 2.6 | 1 | 3 |
| 5 | 100 | 29.1 | 2.9 | 0 | 1 |
| 6 | 120 | 31.9 | 5.2 | 0 | 3 |
| 7 | 120 | 42.6 | 7.0 | 0 | 0 |
| 8 | 100 | 23.4 | 2.6 | 0 | 4 |
| 9 | 100 | 31.2 | 3.2 | 3 | 0 |
| 10 | 100 | 26.9 | 3.1 | 0 | 2 |
| 11 | 100 | 33.9 | 4.7 | 1 | 2 |
| 12 | 120 | 32.1 | 6.0 | 0 | 2 |
| 13 | 100 | 24.1 | 2.3 | 0 | 3 |
| 14 | 100 | 23.5 | 2.1 | 0 | 3 |
| 15 | 120 | 33.2 | 4.7 | 0 | 0 |
| 16 | 100 | 25.1 | 2.2 | 2 | 2 |
| 17 | 100 | 31.0 | 3.4 | 0 | 2 |
| 18 | 100 | 23.6 | 2.6 | 0 | 2 |
| 19 | 100 | 23.5 | 2.2 | 0 | 0 |
| 20 | 120 | 27.9 | 3.6 | 0 | 0 |
| Mean | 29.3 | 3.5 | 0.5 | 1.7 | |
| Median | 28.7 | 3.0 | 0.0 | 2.0 | |
| Std dev | 5.0 | 1.3 | 0.8 | 1.2 | |
| Minimum | 23.4 | 2.1 | 0.0 | 0.0 | |
| Maximum | 42.6 | 7.0 | 3.0 | 4.0 | |
Prior to distribution of the test case data, participants were required to select the type of data desired for their technique: projection data or one of the four types of image data (3 mm thick at B30 or D45 and 1 mm thick at B30 or D45). They were instructed to return the images at 3 mm thickness and 2 mm interval for evaluation.
2.F. Return of test data images and quality assurance testing
Very specific instructions were provided to participants to ensure that the data returned were in the proper format and orientation. Prior to the submission deadline, participants were invited to submit the ACR phantom results to the host institution for evaluation of data format and orientation. An automated piece of custom software evaluated key test objects in the phantom to check orientation, CT number, slice thickness, and slice position. This was an important step, as the majority of sites had some aspect of the formatting or orientation incorrect in their first submission. The host site communicated with participants to resolve any issues found prior to the submission deadline for the patient test cases. This quality assurance testing did not assess noise or spatial resolution, or attempt in any way to evaluate the merits or weaknesses of the noise reduction technique; it was performed for the sole purpose of ensuring that the data being returned were appropriately formatted for us to convert into DICOM images for radiologist review using the host site's image review workstation (Discovery Workstation, Mayo Clinic, Rochester, MN, USA).
2.G. Radiologist evaluation at host institution
A board‐certified abdominal radiologist who has overseen multiple observer performance studies directed the radiologist reading portion of this work. First, he selected senior radiology residents (n = 5) and radiology fellows (n = 6; abdominal imaging — 2, nuclear medicine — 1, breast imaging — 1, musculoskeletal imaging — 1, research — 1) known for their reading acumen to participate as readers for this study. Second, in‐person training sessions were conducted with all readers in an attempt to minimize interobserver variability. During this training, the residents and fellows were familiarized with the dedicated computer workstation used during interpretation of cases, instructed to examine all cases using routine and liver window settings (window width = 400 HU, window level = 40 HU), and shown how to mark lesions and provide a diagnosis. Lesions were marked by drawing across the lesion's widest dimension a line that extended fully across the lesion border. They were instructed how to assign lesion‐level and patient‐level confidence scores for the presence of hepatic metastasis using a 100‐point scale (100 = complete confidence and 0 = no confidence at all that the marked lesion was a metastasis), practiced marking lesions, and discussed assignment of reader confidence for a wide variety of lesions. Training lesions were from non‐grand‐challenge cases from the larger patient data library and sampled the distribution of sizes, shapes and contrast levels observed in the complete data library (> 200 cases). Readers were reminded that they should only mark and score lesions that they deemed to be metastatic; marking of benign lesions was contrary to the assigned task and hence was considered a false positive. Written instructions summarizing these details were provided to each reader. A study coordinator assigned reader‐specific dates and times to perform the reads. All reading was performed using diagnostic quality monitors in a reduced ambient lighting setting. Radiologist readers, who were also considered human subjects, provided written informed consent. They also received a modest remuneration for their participation.
Given the time constraints of the challenge and the high potential of recall if the radiologists reviewed the same patient case repeatedly over a brief period of time, a Latin Square experimental design was used to determine reading assignments (a unique combination of patient cases and participant submissions was developed for each reader) (Fig. 1). As will be noted below, a modification to the Latin Square design was required to account for having fewer readers (11) than the number of patients (20) and participants submitting data (20/22; 2 participants were excluded due to submission of unreadable data). Ideally, the Latin Square design would require each radiologist to review each patient once for a given session, using a randomly selected participant submission, subject to the constraint that each reader would see each of the participant submissions only once. A total of 400 reading impressions were required to read each of the 20 patient cases for the 20 participants with valid data; however, since only 11 radiologists were available to be readers, readers had to read between 1 and 2 sessions in order to completely read all case‐participant combinations. The multiple reading sessions were assigned such that each radiologist read each participant submission once, at the expense of seeing some of the patients again (from a different participant submission) on the second reading session.
Figure 1.
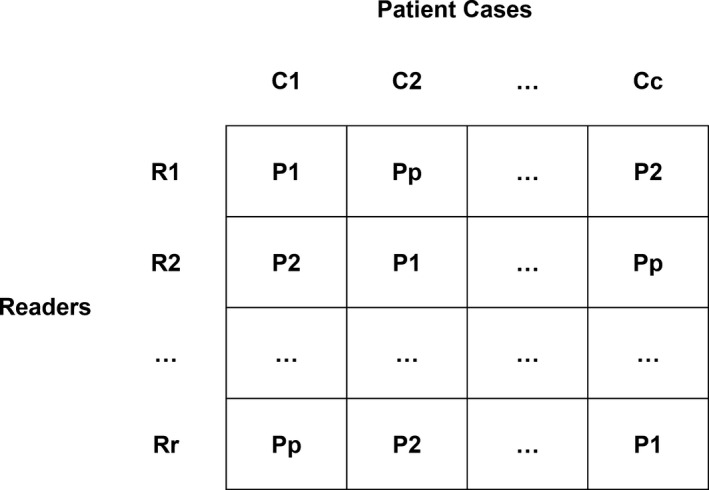
Illustration of a general Latin Square design where R represents readers (r is the number of readers), C represents cases (c is the number of cases), and P represents the participating sites (p is the number of participants). Note that each row contains a unique combination of participating sites and patient cases. In the case of the grand challenge, r < p = c, so readers had to read multiple rows within the randomization to complete the reading impressions (r*c*p). See methods for details.
This design assumes that readers are exchangeable in performance. Any differences in individual reader performance were assumed to be distributed uniformly across the participants’ submissions given the blocking imposed by the Latin Square design. This reduced the impact of reader bias on any one participant. To measure inter‐reader and intra reader reliability as well as to garner performance metrics on commercial FBP reconstruction, an additional reading session was scheduled for all 11 readers. In this third reading session, all readers reviewed the same 10 cases used in prior multireader multicase (MRMC) studies (i.e., not a part of the grand challenge). These cases and reads were used to assess inter‐reader reliability. In addition, all readers reviewed up to seven grand challenge cases (with lesions) that they had already reviewed in a prior reading session (note: given the randomization schedule, readers did not always have a fixed number of cases with lesions). These cases and reads were used to assess intrareader reliability. Finally, the two commercial reconstructions datasets (routine dose FBP and 25% dose FBP, both B30 at 3 mm thickness and 2 mm interval) were randomly distributed amongst the 11 readers in such a way that the commercial FBP images were read after the intra‐ and inter‐reader reliability cases were read.
Readers were instructed to mark regions of interest (ROIs) suspicious for metastatic lesions and assign a lesion level confidence for the primary task (detection of a hepatic metastasis). After reviewing each patient dataset, readers assigned an overall confidence for the presence of at least one hepatic metastasis within each patient. These ratings were used for calculation of the JAFROC figures of merit to be used in tie breaking.
2.H. Scoring and statistical considerations
The experimental design and evaluation plan were shared with interested sites prior to the initiation of the challenge. The key aspects of the evaluation plan are listed here. Reader lesion markings (or notation of the case as normal) were automatically compared to the reference standard for each patient and the data scored on a per lesion and per patient basis. Reader markings were considered correct if the location marked by the reader as the center of the lesion fell anywhere within the true lesion's boundaries.
Scores was tabulated as follows:
Per lesion scoring (includes penalty for false positive and negative markings):
+1 for true positive marking of a metastasis (correctly marking a metastasis)
−1 for false positive marking of a metastasis (no metastasis exists at that location)
−1 for false negative (a metastasis exists that was not marked)
Per case scoring (includes penalty for false positive and negative markings):
+1 for true negative case (no metastasis marked in a case with no metastases)
+1 for true positive case (at least one metastasis was correctly marked in a case with metastases)
−1 for false negative (no metastases marked in a case that had metastases)
−1 for false positive (at least one metastasis marked in a case with no metastases)
The results were summarized for each site using the following definitions:
The per lesion normalized score (NS) = per lesion score/total number of lesions × 100%
The per case normalized score (NS) = per case score/20 × 100%
In both cases, a perfect score would 100%. In both cases, false positive and false negative markings could result in a negative score. The overall performance score for each participant was calculated as:
Total score = [(per lesion NS) + (per case NS)] ÷ 2
A perfect score (all lesions and cases marked correctly) would be 100%.
In the event two or more submissions received the same overall performance score, the per lesion normalized score was to be used as a tiebreaker. If the per lesion score normalized scores were equal (which implies the per case normalized scores are also equal), JAFROC figure of merit values (area under the curve, AUC) were used to take into account reader confidence.16 Estimation of the figure of merit and associated confidence intervals accounts for the clustering of markings within the patient cases using the pseudo‐value approach described first by Dorman, Berbaum, and Metz (i.e., the “DBM model”) and improved upon by Hillis.17, 18 The JAFROC analysis allowed for nonlocalizations in cases with > 1 hepatic metastases to be considered in the figure of merit calculations (“JAFROC1” analysis).9
Inter‐reader reliability was assessed using 10 datasets consisting of 34 lesions using the intraclass correlation (ICC). Lesions were considered the blocking (“subject”) factor for the estimation of the ICC. Failure to detect a lesion was coded with confidence of zero. Given that this might inflate inter‐reader reliability, the reliability statistics were also estimated after excluding lesions that were missed by > 50% of the readers. The intra reader reliability was assessed using a patient‐level summary to address a limitation in the data collection. Namely, while the reader workstation could colocalize reader ROIs with reference lesions, the colocalization of two reader marks (e.g., the pre‐ and post‐markings) was not possible with the existing software. To address this, the mean confidence rating over all primary task ROIs marked within a case was computed. This mean composite score was compared between reading sessions graphically using a Bland–Altman plot.19
To assess whether there was a difference in final ranking position between image‐based and projection‐based methods, a Wilcoxon Rank Sum test and a Runs test were performed on the final rankings.
3. Results
3.A. Participants
Registration opened on December 16, 2015 and closed on January 15, 2016. During that timeframe, 103 participants from 26 countries registered to participate (Fig. 2). After accounting for multiple registrants participating as a single team, this translated in 90 unique participating sites. An executed data sharing agreement was required with the host institution due to the use of patient data, even though the data were fully anonymized. Training data was shared with the 77 sites that completed the necessary data sharing agreements. Subsequently, 41 sites downloaded the 20 test cases. In the end, 22 sites submitted their results for evaluation in the human observer study. One site provided binary images and one site provided images with severe artifacts in all patient cases; these participants’ cases were excluded from reader review and participants removed from the challenge.
Figure 2.
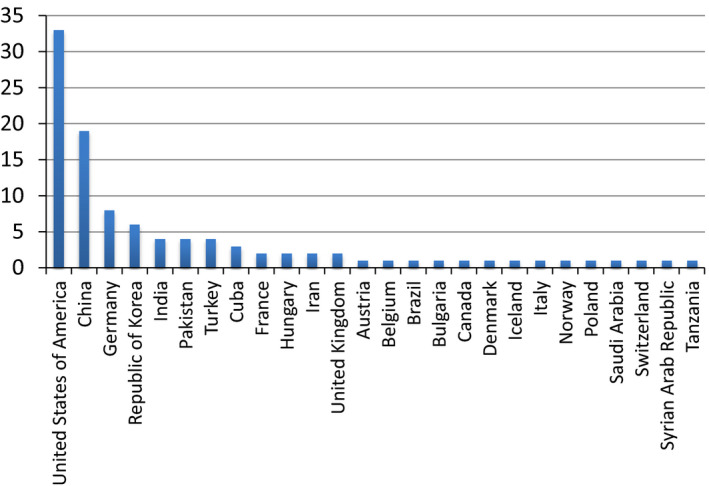
The initial 103 registrants were from a total of 26 countries.
During registration, a number of questions were asked, which resulted in the following data. Of the 103 initial registrants, 26.6% were medical physicists, 23.4% were computer scientists, 23.4% were electrical engineers, 9.6% were physicists, 6.4% were mathematicians, and 10.6% were “other.” Twenty two percent of the registrants had not previously worked with medical CT data sets and a majority of 60.2% had not previously collaborated with a radiologist regarding their algorithm.
3.B. Final participant list
Table 2 lists the final set of 22 participating sites in order of country, institution and contact investigator (i.e., this is not ordered in terms of final performance). Of these, 20 sites submitted evaluable data sets, with 10 sites using projection data, 1 using 3 mm D45 images, 3 using B30 3 mm images, 1 using 1 mm D45 images and 5 sites using 1 mm B30 images (Table 3).
Table 2.
The principal investigator (PI), institute and country of the final 22 participants in alphabetical order of country then PI. One participant, Trzasko, was from the host institution but was not part of the research team hosting the challenge. This participant had no access to any of the resources used in conducting the challenge beyond what was shared with all other participants. Sites were referenced by site number only, thus readers were blinded to the site location
| Principal investigator | Institution | Country |
|---|---|---|
| Chen, Linlin | Xidian University | China |
| Chen, Yang | Southeast University | China |
| Cheng, Licheng | Shanghai United Imaging Healthcare Co, Ltd. | China |
| Liu, Wei | Xidian University | China |
| Mou, Xuanqin | Xi'an Jiaotong University | China |
| Wang, Miao | Xidian University | China |
| Hansen, David | Aarhus University Hospital | Denmark |
| Allner, Sebastian | Technische Universitat Munchen | Germany |
| Kopp, Felix | Technische Universitat Munchen | Germany |
| Taubmann, Oliver | Friedrich‐Alexander‐University Erlangen‐Nuremberg | Germany |
| Balogh, Zsolt | Budapest Business School | Hungary |
| Helgadottir, Bjorgheidur | Raforninn/Image Owl | Iceland |
| Kang, Eunhee | KAIST | Republic of Korea |
| Lee, Nam‐Yong | Inje University | Republic of Korea |
| Wi, Sunhee | KAIST | Republic of Korea |
| Vo, Nghia | Diamond Light Source | United Kingdom |
| Badea, Cristian | Duke University | USA |
| George, Ashvin | Instarecon Inc | USA |
| Kim, Kyungsang | Massachusetts General Hospital | USA |
| Ruan, Dan | UCLA | USA |
| Trzasko, Joshua | Mayo Clinic | USA |
| Zeng, Larry | University of Utah | USA |
Table 3.
The ranking of performance by total score followed by the JAFROC figure of merit (area under the curve, AUC) for tie breaking, as needed, for the 20 participating sites with evaluable data
| Rank | Site # | Data type | Norm. lesion score (%) | Norm. case score (%) | Total score (%) | AUC (%) |
|---|---|---|---|---|---|---|
| 1 | 29 | Projection | 3.0 | 70.0 | 36.5 | 78.4 |
| 2 | 47 | Projection | 3.0 | 70.0 | 36.5 | 74.6 |
| 3 | 11 | 3 mm D45 | −12.1 | 70.0 | 28.9 | 77.9 |
| 4 | 63 | 3 mm B30 | −12.1 | 70.0 | 28.9 | 75.1 |
| 5 | 19 | 1 mm D45 | −12.1 | 70.0 | 28.9 | 71.1 |
| 6 | 13 | Projection | −3.0 | 60.0 | 28.5 | 73.0 |
| 7 | 31 | 3 mm B30 | −9.1 | 60.0 | 25.5 | 76.5 |
| 8 | 14 | 1 mm B30 | −15.2 | 60.0 | 22.4 | 71.7 |
| 9 | 51 | 1 mm B30 | −12.1 | 50.0 | 18.9 | 76.3 |
| 10 | 57 | Projection | −24.2 | 60.0 | 17.9 | 69.6 |
| 11 | 25 | 1 mm B30 | −21.2 | 50.0 | 14.4 | 74.6 |
| 12 | 76 | 1 mm B30 | −12.1 | 40.0 | 13.9 | 74.7 |
| 13 | 10 | Projection | −33.3 | 40.0 | 3.3 | 68.7 |
| 14 | 55 | 1 mm B30 | −33.3 | 30.0 | −1.7 | 66.2 |
| 15 | 44 | Projection | −27.3 | 20.0 | −3.6 | 63.1 |
| 16 | 20 | Projection | −48.5 | 40.0 | −4.2 | 60.0 |
| 17 | 8 | Projection | −42.4 | 30.0 | −6.2 | 61.1 |
| 18 | 26 | Projection | −45.5 | 20.0 | −12.7 | 63.2 |
| 19 | 60 | 3 mm B30 | −51.5 | 10.0 | −20.8 | 63.5 |
| 20 | 3 | Projection | −75.8 | 20.0 | −27.9 | 53.2 |
3.C. Overall performance
Figure 3 shows the overall performance by case. One point was awarded when no lesions were marked in a case with no metastatic lesions or when at least one metastatic lesion was correctly marked in a case with metastases. A negative point was awarded when no lesions were marked in a case that had metastatic lesions or when at least one metastatic lesion was marked in a case with no lesions. Performance ranged from 17/20 cases correct to only 11/20 cases correct, demonstrating the relative difficulty of the task. The overall performance by lesion markings is shown in Fig. 4. Of the 33 total metastases, the number of true positive markings ranged from 11 to 22. The site with 22 true positive markings did not perform best overall, however, due to the high number of false positive markings (n = 12). The number of true positive markings plus the number of false negative markings equaled 33, the total numbers of metastases present. Because each false negative (range 14/33–22/33) or false positive (range 1–14) marking contributed a negative value of 1 to the lesion score, the total lesion score was very low (range 3% to −76%), which brought down the total score (range −28% to 36.5%). Overall, case scores performed much better, because as long as one metastasis was found for a case with one or more metastases, the case was considered to be correct. The range of case scores was from 10% to 70%.
Figure 3.
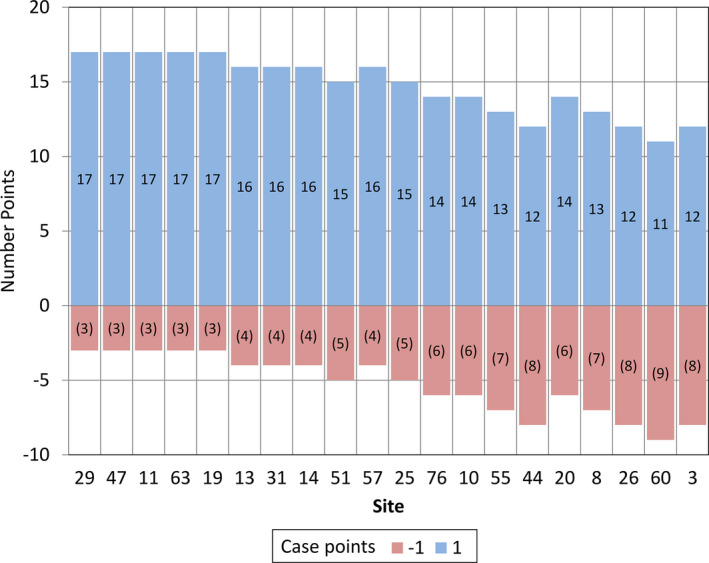
The number of correctly (blue) and incorrectly (red) marked cases are shown for each of the 20 participating sites whose cases were read by the radiologist readers.
Figure 4.
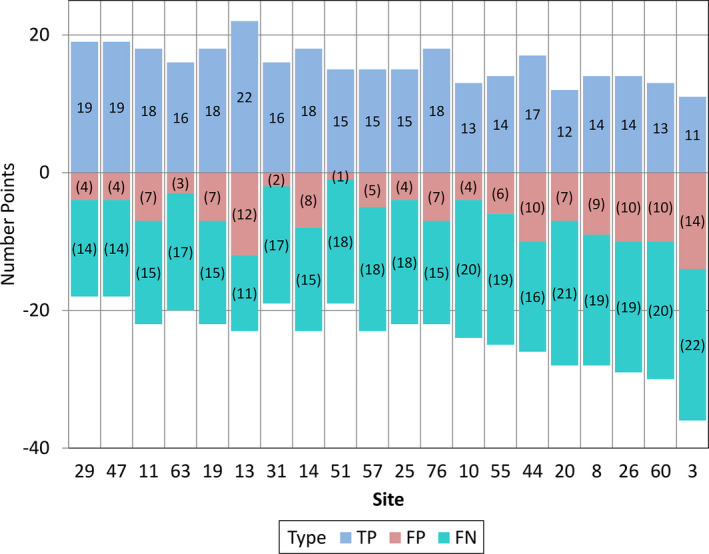
The number of true positive (TP, blue), false positive (FP, red) and false negative (FN, green) lesion markings are shown for each of the 20 participating sites.
The numerical normalized lesion and case scores, as well as the JAFROC figure of merit values (AUC) are also given in Table 3. The JAFROC figure of merit gives a better sense of the readers' performance for this task in these low dose cases. AUC values ranged from 53.2% (a performance near random guessing) to 78.4% (perfect performance would have an AUC = 100%). There was a two‐way tie for first place and a three‐way tie for second place using the total score. The JAFROC figure of merit (AUC) was used to determine the final rank order of these sites. Sites 29, 47 and 11 were declared the first, second, and third place winners, respectively. The 3rd place winner was Dr. Larry Zeng, who is a Professor of Engineering at Weber State University in Ogden, Utah. The 2nd place winner was Eunhee Kang, who is a PhD student at the Korea Advanced Institute of Science and Technology in South Korea, her colleague, Junhong Min, and her advisor, Dr. Jong Chul Ye. The 1st place winner was Dr. Kyungsang Kim, who is a post‐doctoral research fellow at Massachusetts General Hospital in Boston, Massachusetts, and his advisor, Dr. Quanzheng Li.
3.D. Intrarater and inter‐rater reliability
The Bland–Altman plot (Fig. 5) indicated little drift in scores between reading sessions and constant variance over the range of confidence ratings. Inter‐rater reliability for using all 34 lesions was good (ICC 0.78; 95% CI: 0.59–0.92). Figure 6 is a heat map of confidence ratings by lesions and reader. This figure illustrates several key points. First, it illustrates the readers’ consistency at failing to detect subtle lesions (dark blue vertical bands, which represented less obvious lesions, where reader confidence would be low) and consistency of confidence scoring for less subtle lesions (brighter red vertical bands, which represented more obvious lesions, where reader confidence would be high). Dark blue squares (confidence = 0) indicate missed lesions. With the exception of reader 3 on lesions 31–34, the pattern of detection is reasonably consistent across readers. Eliminating subtle lesions (lesions #3–7, 13–17, 27) decreased the inter‐reader reliability (ICC 0.52, 95% 0.29–0.81), but this is expected due to a reduced variation in lesion difficulty. As a whole, the experimental paradigm was considered robust given the challenge constraints.
Figure 5.
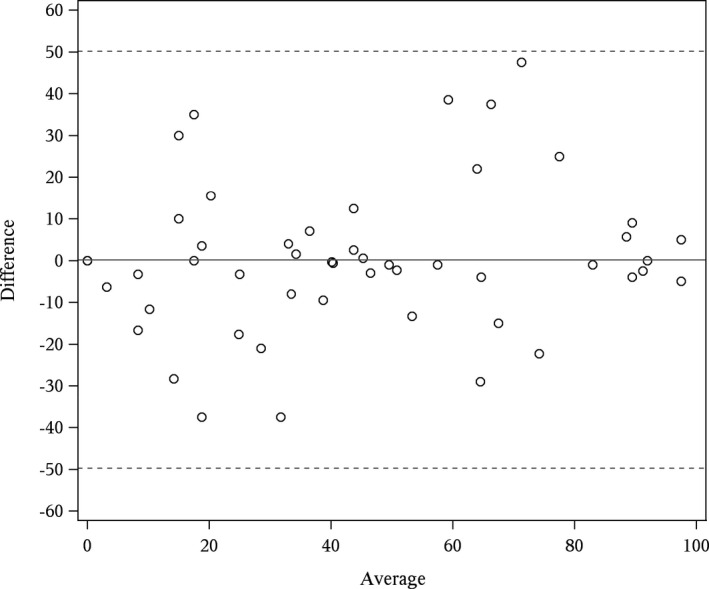
Bland–Altman plot of patient‐level confidence for intrarater readings. The x‐axis is the mean of the two patient‐level confidence scores (e.g., the first and second reading) and the y‐axis is the difference in the two patient‐level confidence scores. The estimated mean difference (bias) in confidence (first reading minus second) was 0.19. Dashed lines are ±2 standard deviations of the difference.
Figure 6.
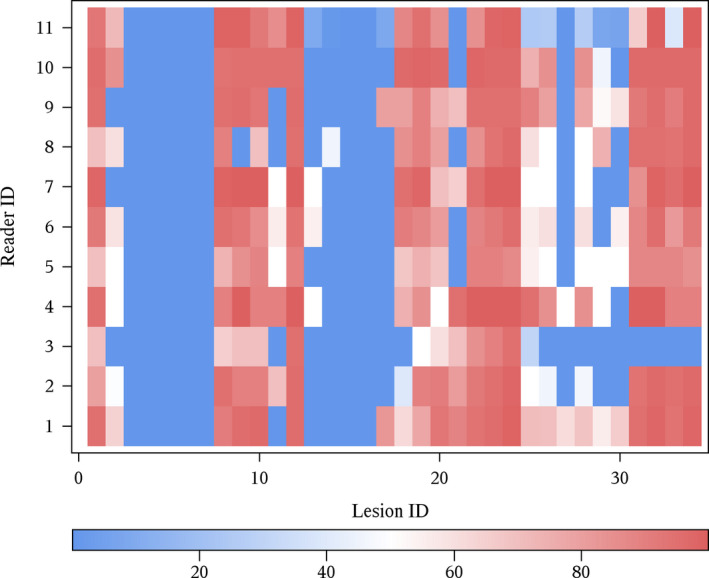
Heat map of confidence ratings for 34 lesions presented to all readers. Cells with more intense red indicate confidence scores approaching 100. Blue cells represent regions with either low reported confidence (shades of blue) or missed lesions (dark blue or 0 confidence).
3.E. Image examples
The range of quality of these 20 participating sites’ images is exemplified in Fig. 7.
Figure 7.
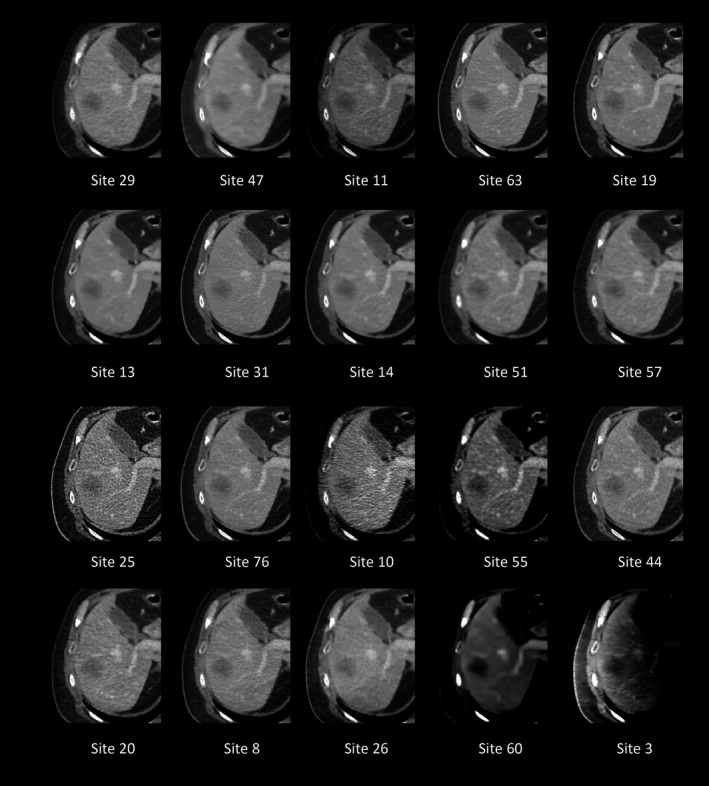
The same image slice is shown for each of the 20 sites. Images are in order of final ranking. This figure demonstrates the range of visual impressions submitted by participants. Of note is the particularly poor quality of some of the lower ranking sites.
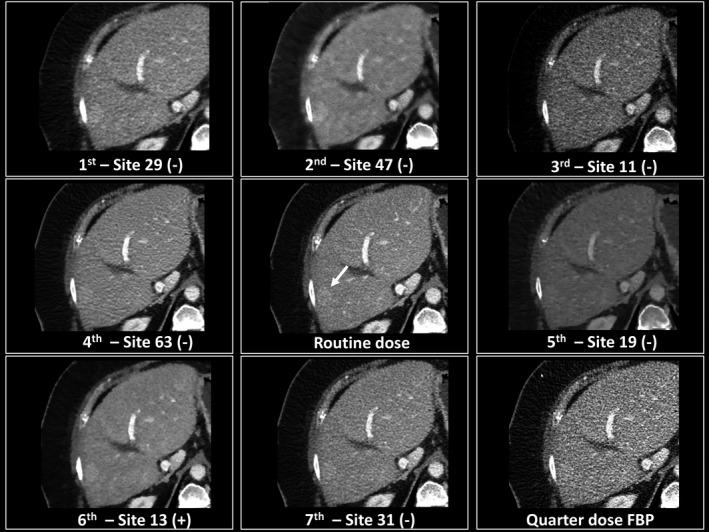
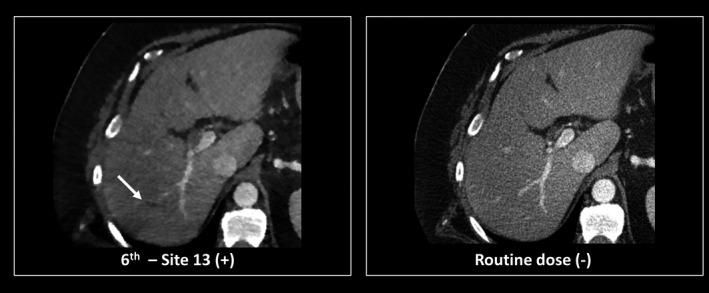
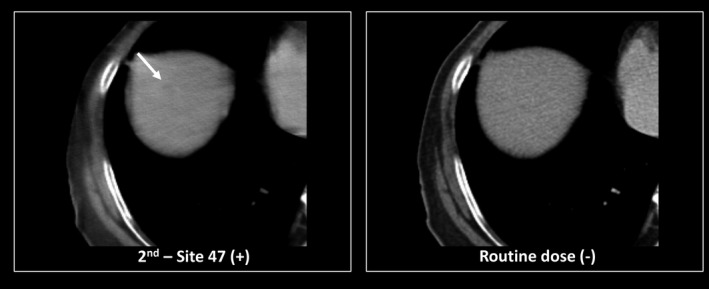
A closer look at images from the top performing seven sites is given in Figs. 8 and 9. These figures show true positive and false negative findings for relatively easy and more difficult cases. Figures 10 and 11 give examples of false positive findings that resulted from artifacts created by the noise reduction algorithms. Each case is coded with + or − according to whether the lesion was marked (+) or not (−).
Figure 8.
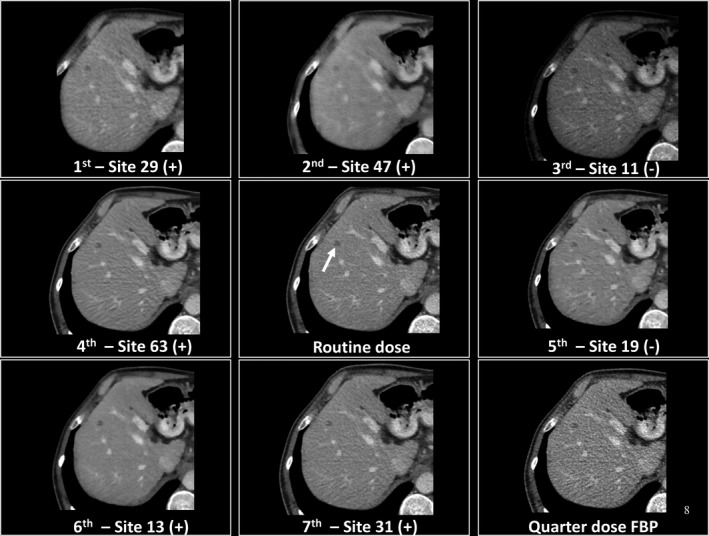
Demonstration of true positive images (+) and false negatives (−) relative to the commercial filtered backprojection (FBP) and quarter dose FBP images. In this example, readers missed a small metastasis (arrow) for sites 11 and 19, potentially because of the number of distracting dark artifacts in the image.
Figure 9.
Demonstration of a true positive image (+) and false negative images (−) for a hyperattenuating metastasis shown with the arrow relative to the commercial filtered backprojection (FBP) and quarter dose FBP images. In this example, readers missed the lesion (arrow) for all sites except one (site 13).
Figure 10.
Demonstration of a false positive finding (arrow) due to the presence of an artifact created by the reconstruction algorithm.
Figure 11.
Demonstration of a false positive finding (arrow) due to the presence of a very subtle artifact created by the reconstruction algorithm.
3.F. JAFROC figure of merit
Using the JAFROC figure of merit, 95% confidence intervals demonstrating the uncertainty associated with the AUC_JAFROC were calculated for each site to allow a better understanding of the final results (Fig. 12). Also included in Fig. 12 are results from a previous study where three subspecialized abdominal radiologists performed the same detection and classification task on the same cases used in the grand challenge but at our routine clinical dose and using filtered back projection reconstruction (Site A). This likely represents the best human observer performance possible for the cases used in this study due to the experience of the readers, both in their subspecialty and in participating in human observer performance trials. The performance of the 11 grand challenge readers using routine dose (Site B) and quarter dose (Site C) with the commercial filtered backprojection images is also provided. The two vertical dashed lines on the figure denote the range of improvement in the mean FOM for moving from 25% dose to the routine dose. Sites 29 and 11 had essentially the same mean FOM score as the full dose images. The lowest ranking eight sites had performance numerically inferior to the quarter dose images, as did site 57, which was barely inferior. All other sites had mean performance somewhere between these two points. The large confidence intervals demonstrate the difficulty in making statistically significant conclusions beyond these trends. The sites that used projection data are noted with “P” and the sites that used images with “I”.
Figure 12.
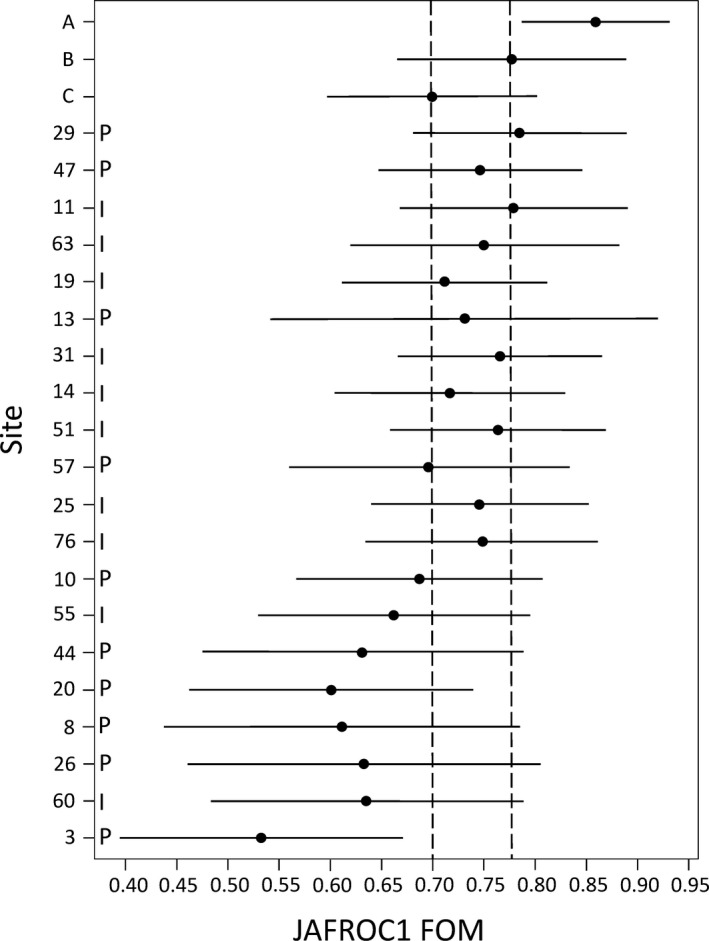
Plot of the JAFROC figure of merit (FOM) values for each participating site. See text for description of Sites A, B and C. Sites using projection data are marked with P and sites using image data are marked with I.
Although 5 of the 6 lowest ranked sites were projection‐based methods, no statistical significance was observed to indicate the rank position was associated with the use of image or projection data (Wilcoxon rank run test P = 0.33 and runs test P = 0.82).
4. Discussion
The administration of a grand challenge is in itself a scientific and logistical challenge. One logistical issue was communication with a large number of participants and ensuring that all communications reached all sites. We attempted to use a Facebook closed group, but several international sites could not access Facebook due to governmental restrictions. Thus, all communications were sent by email and a tracking system was needed to record what was sent to whom and on what date. Another challenge was related to the data sharing agreement, which was required to be signed and returned before patient data could be released. Thirteen sites did not return this agreement and thus data could not be released to them. Further, each site was required to return a data preference form, stating which of the available data sets they wanted to use for the test data (e.g., projection, 3 mm B30); only 41 sites returned these forms. Thus a large percentage of the attrition from the original 90 sites was due to lack of responsiveness from the participant, presumably because they no longer wished to participate. Finally, the quality assurance step implemented to ensure that the submitted test data were correctly formatted was essential, as nearly every site had some error in their data format, in spite of detailed documentation being sent to each site that addressed all of observed errors. Thus, the host site must be prepared to interact frequently with participating sites in order to have a successful challenge.
Despite these logistical hurdles, a wide variety of participating institutions successfully competed in the grand challenge. This grand challenge provided coded projection and image data to participating sites so that they would have exposure to patient data with proven lesions. The majority of denoising and iterative reconstruction approaches improved radiologist performance for detection of hepatic metastases, despite the fact that the majority of participants had not worked with a radiologist prior to participation. This accomplishment by participating sites should not go unnoticed: while many previous studies have demonstrated improved image quality using noise reduction methods in CT, few have actually demonstrated preserved or improved performance at very low doses.12, 20, 21, 22
Images from several of the participating sites, even those that ranked in the top three positions, had a different noise texture to them relative to the commercial FBP images. In particular, site 47 had a blurry appearance. Site 11 had a very high inherent contrast and was somewhat darker than the other images at the same window and level. This additional darkness was later found (after the winners had been identified) to be due to a CT number offset that was subsequently corrected. It is not clear if these different appearances may have helped readers, but they appear not to have hurt reader performance.
Slice thickness interpolation might have played a role in the results. We controlled for this to some extent by requiring that the ACR CT Accreditation phantom data be returned so that we could verify that the slice widths were, in general, about 3 mm, albeit some were slightly wider than others. There were, however, no large differences in slice width, thus slice width is likely to have played only a secondary role in the results.
Reader studies inherently have uncertainty due to reader variation. Figures 5 and 6 show that, in spite of the presence of some variations in performance, overall agreement between readers was good. The data shown in Fig. 12 provide an estimate of the 95% confidence intervals around the JAFROC figure of merit (AUC). It is clear that small differences in the AUC in the top performing sites could have affected the final rank order. The tight grouping of the point AUC estimate for the top 8–10 sites indicates that these sites all did a reasonable job in reconstructing or denoising the quarter dose data, with a few sites’ data yielding reader performance similar to the full dose data. If these results can be verified in a larger trial, this implies that for the diagnostic task of detecting liver metastases, which is a difficult interpretation task, dose reductions of up to 75% may be possible! The algorithms or methods used by the bottom performing sites clearly decreased reader performance, achieving an AUC value lower than the original 25% dose data.
The rank order of performance varied somewhat according to the scoring method used. The normalized scoring approach was selected for its simplicity. It assumed that the clinical impact of a false positive or false negative was the same, and that these would be offset by the clinical benefit of a true positive or true negative. There are paradigms for weighting results by various utilities, but that level of sophistication in the clinical interpretation of the results was not deemed to be warranted considering the very small numbers of cases and independent reads that could be accommodated in a grand challenge scenario. The scoring system focused on whether the noise‐reduced images allowed fewer “errors”, counting any error as equal in weight to one correct answer. To include a somewhat more sophisticated analysis, although still not weighted based on clinical utility, we evaluated the JAFROC figure of merit, as this takes into account confidence, and not just getting a lesion right or wrong. When the challenge was launched, we were not confident that in the very short time window allotted for reading and data analysis that we would be able to do a complete JAFROC analysis, thus the simple scoring approach was selected for use (and advertised on the challenge website), as we were confident that these metrics could be computed in a very short timeframe. In the end, even though we were able to compute and share the JAFROC data, the winners were selected based on what we said that we would do on the challenge website.
There are limitations in this study. The most important limitation was the small number of test cases read. However, due to the time commitment involved in downloading, processing and uploading the large data sets, as well as the time required to read the cases, 20 cases were felt to be an upper limit of what could be accomplished in the 7 month time frame of the challenge. Also, not each reader read all cases from all sites, but again, within the time constraint of the challenge, case recall would have been a substantial problem. The assumption of reader interchangeability was reasonably well demonstrated through the evaluation of inter‐ and intrareader variability; however, the deviation from a standard MRMC study design is a limitation in our approach. Finally, the reader cohort was composed of senior radiology residents and fellows, who had a diminished performance in examining full dose data relative to a group of senior, subspecialized radiologists (Fig. 12). However, in the short time window allotted for case review (2 weeks), there was not enough senior faculty available to participate in the after‐hours reading sessions. Thus performance of data in the grand challenge can be compared only within this reader cohort, and may not represent the performance of a more senior or a more heterogeneous group of radiologists. Further, the performance reported here reflects that readers were assigned a very specific task — detecting and classifying liver metastases. Thus, the results may not be applicable to other tasks involving abdominal CT, for example detection of renal stones.
5. Conclusions
An international grand challenge, sponsored by the AAPM, NIBIB, and Mayo Clinic, was held starting in January of 2016, with the results announced at the annual meeting of the AAPM in August of 2016. The interest in the challenge was very high, with 90 sites registering to participate from over 20 different countries. An infrastructure and methodology was developed to rapidly estimate observer performance of liver metastasis detection for low‐dose CT examinations of the liver. Both image‐based denoising and projection‐based iterative reconstruction techniques were used, according to site preference, with both techniques being nearly equally represented in the upper and lower halves of the final rankings. The results show large differences in detection performance between noise reduction methods, although the majority of methods provided some improvement in performance relative to the commercial quarter‐dose images with no noise reduction applied. With use of the top performing methods, observer performance was comparable to the full dose situation. Confirmation of these findings in a larger fully crossed multireader, multicase study is needed, however, before these findings can be applied to clinical practice due to the limitations imposed by the grand challenge time frame, such as the small case size, the use of a single interpretation per condition, and the use of radiologists in training as readers.
Conflicts of interest
Dr. McCollough receives grant support from Siemens Healthcare. All other authors have no conflicts to disclose.
Acknowledgments
The authors thank Drs. Ann Packard, Eric May, Christin Tiegs‐Heiden, Travis Howard, Neera Malik, Derrick Doolittle, Erica Martin‐Macintosh, Alex Nagelschneider, Nathan Hull, David Aamodt, and Roy Marcus for participating in the human observer performance study and Dr. Jeff Fidler for identifying the reference standards. We thank Ryan Lowe for compiling visual comparisons of reader detections across participating sites. We also especially appreciate all the participants who gave of their time and talents to make this study possible. The project described was supported by Grant numbers EB017095 and EB017185 from the National Institute of Biomedical Imaging and Bioengineering and the American Association of Physicists in Medicine. The content is solely the responsibility of the authors and does not necessarily represent the official views of the National Institutes of Health or the AAPM.
References
- 1. Boone JM, Hendee WR, McNitt‐Gray MF, Seltzer SE. Radiation exposure from CT scans: how to close our knowledge gaps, monitor and safeguard exposure–proceedings and recommendations of the radiation dose summit, sponsored by NIBIB, February 24–25, 2011. Radiology. 2012;265:544–554. [DOI] [PMC free article] [PubMed] [Google Scholar]
- 2. Brenner DJ, Shuryak I, Einstein AJ. Impact of reduced patient life expectancy on potential cancer risks from radiologic imaging. Radiology. 2011;261:193–198. [DOI] [PubMed] [Google Scholar]
- 3. Hricak H, Brenner DJ, Adelstein SJ, et al. Managing radiation use in medical imaging: a multifaceted challenge. Radiology. 2011;258:889–905. [DOI] [PubMed] [Google Scholar]
- 4. McCollough CH, Bushberg JT, Fletcher JG, Eckel LJ. Answers to common questions about the use and safety of CT scans. Mayo Clin Proc. 2015;90:1380–1392. [DOI] [PubMed] [Google Scholar]
- 5. Mettler FA Jr., Bhargavan M, Faulkner K, et al. Radiologic and nuclear medicine studies in the United States and worldwide: frequency, radiation dose, and comparison with other radiation sources – 1950–2007. Radiology. 2009;253:520–531. [DOI] [PubMed] [Google Scholar]
- 6. McCollough CH, Bruesewitz MR, Kofler JM Jr. CT dose reduction and dose management tools: overview of available options. Radiographics. 2006;26:503–512. [DOI] [PubMed] [Google Scholar]
- 7. Yu L, Liu X, Leng S, et al. Radiation dose reduction in computed tomography: techniques and future perspective. Imaging Med. 2009;1:65–84. [DOI] [PMC free article] [PubMed] [Google Scholar]
- 8. McCollough CH, Chen G, Kalender WA, et al. Achieving routine Sub‐mSv CT scanning: report from the summit on management of radiation dose in CT. Radiology. 2012;264:567–580. [DOI] [PMC free article] [PubMed] [Google Scholar]
- 9. Chen B, Leng S, Yu L, Holmes DR III, Fletcher JG, McCollough CH. An open library of CT patient projection data. Proc SPIE. 2016;9783:97831B. [DOI] [PMC free article] [PubMed] [Google Scholar]
- 10. Yu L, Shiung M, Jondal D, McCollough CH. Development and validation of a practical lower‐dose‐simulation tool for optimizing computed tomography scan protocols. J Comput Assist Tomogr. 2012;36:477–487. [DOI] [PubMed] [Google Scholar]
- 11. Chen B, Duan X, Yu Z, Leng S, Yu L, McCollough C. technical note: development and validation of an open data format for CT projection data. Med Phys. 2015;42:6964–6972. [DOI] [PMC free article] [PubMed] [Google Scholar]
- 12. Fletcher JG, Yu L, Li Z, et al. Observer performance in the detection and classification of malignant hepatic nodules and masses with CT image‐space denoising and iterative reconstruction. Radiology. 2015;276:465–478. [DOI] [PMC free article] [PubMed] [Google Scholar]
- 13. McCollough CH, Bruesewitz MR, McNitt‐Gray MF, et al. The phantom portion of the American College of Radiology (ACR) computed tomography (CT) accreditation program: practical tips, artifact examples, and pitfalls to avoid. Med Phys. 2004;31:2423–2442. [DOI] [PubMed] [Google Scholar]
- 14. American Association of Physicists in Medicine . Use of Water Equivalent Diameter for Calculating Patient Size and Size‐Specific Dose Estimates (SSDE) in CT (Task Group 220). College Park, MD: American Association of Physicists in Medicine; 2014. 220. [PMC free article] [PubMed] [Google Scholar]
- 15. American Association of Physicists in Medicine . Size‐Specific Dose Estimates (SSDE) in Pediatric and Adult Body CT Examinations (Task Group 204). College Park, MD: American Association of Physicists in Medicine; 2011. 204. [Google Scholar]
- 16. Chakraborty DP, Berbaum KS. Observer studies involving detection and localization: modeling, analysis, and validation. Med Phys. 2004;31:2313–2330. [DOI] [PubMed] [Google Scholar]
- 17. Dorfman DD, Berbaum KS, Metz CE. Receiver operating characteristic rating analysis. Generalization to the population of readers and patients with the jackknife method. Invest Radiol. 1992;27:723–731. [PubMed] [Google Scholar]
- 18. Hillis SL. A comparison of denominator degrees of freedom methods for multiple observer ROC analysis. Stat Med. 2007;26:596–619. [DOI] [PMC free article] [PubMed] [Google Scholar]
- 19. Bland JM, Altman DG. Statistical methods for assessing agreement between two methods of clinical measurement. Lancet. 1986;1:307–310. [PubMed] [Google Scholar]
- 20. Goenka AH, Herts BR, Obuchowski NA, et al. Effect of reduced radiation exposure and iterative reconstruction on detection of low‐contrast low‐attenuation lesions in an anthropomorphic liver phantom: an 18‐reader study. Radiology. 2014;272:154–163. [DOI] [PubMed] [Google Scholar]
- 21. Marin D, Choudhury KR, Gupta RT, et al. Clinical impact of an adaptive statistical iterative reconstruction algorithm for detection of hypervascular liver tumours using a low tube voltage, high tube current MDCT technique. Eur Radiol. 2013;23:3325–3335. [DOI] [PubMed] [Google Scholar]
- 22. Schindera ST, Odedra D, Raza SA, et al. Iterative reconstruction algorithm for CT: can radiation dose be decreased while low‐contrast detectability is preserved? Radiology. 2013;269:511–518. [DOI] [PubMed] [Google Scholar]


