

Abstract
Recent studies reveal that both phase aberration and reverberation play a major role in degrading ultrasound image quality. We previously developed an algorithm for suppressing clutter, but we have not yet tested it in the context of aberrated wavefronts. In this study, we evaluate our previously reported algorithm, called aperture domain model image reconstruction (ADMIRE), in the presence of phase aberration and in the presence of multipath scattering and phase aberration. We use simulations to investigate phase aberration corruption and correction in the presence of reverberation. As part of this study, we observed that ADMIRE leads to suppressed levels of aberration. In order to accurately characterize aberrated signals of interest, we introduced an adaptive component to ADMIRE to account for aberration, referred to as adaptive ADMIRE. We then use ADMIRE, adaptive ADMIRE and conventional filtering methods to characterize aberration profiles on in vivo liver data. These in vivo results suggest adaptive ADMIRE could be used to better characterize a wider range of aberrated wavefronts. The aberration profiles’ FWHM of ADMIRE, adaptive ADMIRE and post-filtered data with 0.4 mm−1 spatial cutoff frequency are 4.0 ± 0.28 mm, 2.8 ± 1.3 mm and 2.8 ± 0.57 mm, respectively, while the average RMS values in the same order are 16 ± 5.4 ns, 20 ± 6.3 ns and 19 ± 3.9 ns, respectively. Finally, because ADMIRE suppresses aberration, we perform a limited evaluation of image quality using simulations and in vivo data to determine how ADMIRE and adaptive ADMIRE perform with and without aberration correction.
I. Introduction
Ultrasound is a non-invasive, real-time and affordable imaging modality that is widely used as a diagnostic tool. However, image quality can limit the usefulness of ultrasound. There are many potential causes that degrade ultrasound images, including attenuation, gross sound speed error, phase aberration and reverberation clutter [1]–[6]. Over the past few decades, significant attention has been paid to wavefront distortion from sound speed variation throughout inhomogeneous media. The resulting degradation is primarily thought to be arrival time variation called phase aberration. In order to minimize the effects of phase aberration, many methods have been developed to correct distorted wavefronts [4], [7]–[14].
Recent studies reveal that both phase aberration and reverberation are primary contributors to degraded image quality [5]. While phase aberration effects are caused by variations in sound speed due to tissue inhomogeneity, reverberation is caused by multiple reflections within inhomogeneous medium, generating clutter that distorts the appearance of the wavefronts from the region of interest [15]. For our purposes, we consider reverberation and multipath scattering to be identical mechanisms of clutter because they both induce a time delay on the echo arrival time. Along with these effects, off-axis scattering, arising from scatterers located away from the beam’s axis also generates clutter and degrades image quality.
There are early studies of multipath scattering in the field of ultrasound in medicine [16]–[20]. As an example, Nicolas et al. estimated multipath scattering in vivo at approximately −30 dB relative to scattering signals of interest [18]. Generally, multipath scattering was disregarded as a negligible contribution compared to the overall quality of the imaging systems at the time. However, more recent work suggests that on modern systems accounting for multipath scattering may be just as important as correcting aberrated wavefronts [5]. This motivated some to reconsider multipath scattering as a significant source of in vivo image degradation in need of new methods for correction [21]–[24]. Byram et al. introduced an aperture domain model-based algorithm that decomposes and suppresses multipath scattering and off-axis scattering, while preserving signals of interest [6], [25]–[27]. This algorithm is called aperture domain model image reconstruction (ADMIRE). We can use post-ADMIRE channel data to estimate aberration profile characteristics and determine the relative contributions of reverberation and phase aberration on in vivo image quality.
Our motivation for this study is to investigate phase aberration corruption and correction in the presence of reverberation within the context of our ADMIRE algorithm. ADMIRE is useful in this regard because it can declutter the signal while preserving the channel data, which allows us to observe wavefronts before and after decluttering. As part of this, we have previously observed that ADMIRE appears to reduce the aberration in distorted wavefronts [28], but we hypothesized that it would be better to correct for aberrated wavefronts using conventional aberration correction techniques. Therefore, we introduced an adaptive component to the original ADMIRE algorithm, which we refer to as adaptive ADMIRE. The goal of adaptive ADMIRE is to more efficiently suppress clutter, while allowing the aberrated aspects of the signal from the region of interest to pass through the ADMIRE decomposition unaltered so that they can be characterized or corrected using dedicated approaches. Adaptive ADMIRE has two uses. First, it allows us to test our hypothesis regarding the best way to address aberration, and second, it allows us to more accurately classify phase aberration in the presence of strong reverberation or off-axis clutter.
Here, we describe adaptive ADMIRE and use simulations to show adaptive ADMIRE more efficiently preserves the distortions of aberrated wavefronts. Then, we use ADMIRE, adaptive ADMIRE and conventional techniques to characterize phase aberration on in vivo liver data. Finally, because ADMIRE suppresses aberration, we perform a limited evaluation of image quality using simulations and in vivo data to determine how ADMIRE and adaptive ADMIRE perform with and without aberration correction.
II. Methods
A. Aperture Domain Model Image Reconstruction
We quickly review the ADMIRE algorithm laid out by Byram et al. to identify and suppress clutter from off-axis and multipath sources. The basic model used for the ADMIRE algorithm [25], [26] is
| (1) |
where x is the transducer aperture location, t and ω are the time and frequency to localize the signal, k is the wave number, τ(x; xn, zn, τn) is the wavefront delay for a received signal reflecting from point (xn, zn) at time τn and N is the number of scatterers arriving at time t. An(x) is the amplitude modulation term across the transducer aperture induced by a combination of short-time Fourier Transform (STFT) windowing and element sensitivity (ES),
| (2) |
The first-term of (2) is
| (3) |
where Δt is the STFT window size, tc is the middle of the STFT window, wSTFT is the window assigned for the STFT and wenv is the axial pulse envelope function. The second-term of (2) is addressed by Selfridge et al. [29].
In the first step of implementing ADMIRE, dynamic receive delays are applied to RF channel data. The delayed channel data are then short-time Fourier Transformed (STFT). Next, model-fitting is performed on each frequency component of the post-STFT RF channel signals at a given depth. The model relating to the response of y can be written in the following form [25],
| (4) |
where X is the ADMIRE model matrix for that depth and frequency and β is the model coefficient vector. X and y are then expressed with the following matrices, respectively,
where ℜ and ℑ denote the real and imaginary components, respectively, mT is the discrete time index, T is the sampling period of the RF data, ωp is a discrete frequency, Si(mT, ωp) is the post-STFT signal for a single channel of the aperture, i indexes channel and ⊤ is the matrix transpose.
The goal of ADMIRE is to take the pressure, ps(x; t, ω) measured by the aperture elements and solve for the right side of (1). Unfortunately, the problem is ill-posed. Therefore, the model decomposition is performed using elastic-net regularization [30],
| (5) |
where ‖β‖1 and ‖β‖2 denote the L1-norm and the L2-norm, respectively, and α and λ are the parameters used for adjusting the regularization. The parameter of α ranges between 0 and 1 to determine the relative weight of L1 and L2. For an elastic-net regularization solution, the degrees of freedom (DOF) is a function of λ [31], given by
| (6) |
where XA is the active set of the model predictors with nonzero coefficients after model-fitting with a given λ. (We will show that the degrees of freedom play an important role when model mismatch from aberration is present.)
After the model-fit, model predictors within the acceptance region are used to reconstruct decluttered signals. The acceptance zone can be formulated as an ellipse, depending on the lateral and axial resolutions of reslat and resaxl, respectively,
| (7) |
where xr and zr indicate the center of the acceptance zone, and cl and ca are scalable factors to adjust the acceptance region. The signal of interest is reconstructed using
| (8) |
where yROI is a decluttered signal and XB is the model with predictors that are spatially within the acceptance zone. The decluttered signals are then converted into the original time-domain RF channel signals applying the inverse short-time Fourier Transform (ISTFT) [32]. Table I shows ADMIRE parameters applied for this study.
TABLE I.
ADMIRE Parameters
| Parameter | Value |
|---|---|
| Number of elements | 128 |
| Height of element | 2 mm |
| Width of element | 0.254 mm |
| Kerf | 0.003 mm |
| Lateral pitch | 0.257 mm |
| Center frequency (fc) | 3 MHz |
| Sampling frequency (simulation) | 640 MHz |
| Sampling frequency (downsampled) | 40 MHz |
| Bandwidth | 60% |
| Transmit focal depth | 5 cm |
| Transmit/Receive F/# | 1.5 |
B. Aberration Estimation Method
We applied a multi-lag technique to estimate aberration profiles [33]. A window of 14 wavelengths was extracted from the data record of each channel [13]. In this method, a channel signal was compared with five neighboring channels in both directions to estimate relative time delay. The relative time delays were estimated using Loupas’ 2-D autocorrelation algorithm [34].
In order to determine absolute wavefront delays, the relative delay estimates may be combined into a matrix formulation [35].
| (9) |
where M is the design matrix of channel lags, τaber is the estimated aberration profile, and Δτaber are the relative time delay estimates. The estimated aberration profile, τaber, is computed by solving the pseudo-inverse matrix [33],
| (10) |
C. Adaptive ADMIRE
In order to enable ADMIRE to effectively preserve phase aberration while decluttering, we introduce adaptive ADMIRE so that we can address aberration directly using conventional methods. We highlight two key steps in converting ADMIRE into adaptive ADMIRE. First, we apply a spatial low pass filter to obtain an initial estimate of aberration, and second, we adapt the ADMIRE model in the region of interest with the estimated aberration profile. Fig. 1 presents an overview of adaptive ADMIRE.
Fig. 1.

Adaptive ADMIRE data flow is illustrated. Aberration profiles are estimated from the data after spatial filtering (LP filter), while the ADMIRE model-fit is applied to the unfiltered channel data. Estimated aberration profiles are used to adaptively update the original ADMIRE model.
The spatial filter is applied to the delayed RF channel data before estimating the aberration profiles [36]. The filter is a low pass filter laterally and an all-pass filter axially, leading to a one-dimensional (1D) spatial filter. The low pass filter in the lateral dimension is just an N-tap finite impulse response (FIR) filter. In this study, we applied a 20-tap zero-phase FIR filter with a spatial cutoff frequency of 0.4 mm−1 across the aperture dimension unless otherwise specified [36], [37]. The filter removes high frequency spatial information, but low frequency clutter components from reverberation persist, which is what ADMIRE addresses.
Referring to Fig. 1, aberration profiles, τaber, which are estimated from the data after low pass filtering, are used to adaptively update the original model around the region of interest by combining the wavefront delay, τ(x; xn, zn, τn), with the estimated aberration profile,
| (11) |
which also impacts the amplitude modulation term, An(x) in (1).
To show the effect of the cutoff frequency, we performed a simulation study and then compared estimated aberration profiles from the filtered data using 0.2 mm−1, 0.4 mm−1 and 0.6 mm−1 spatial cutoff frequencies, along with applied aberration.
D. Simulations
To evaluate ADMIRE and adaptive ADMIRE, we performed simulation studies using Field II [38], [39] in the presence of phase aberration and in the presence of multipath scattering and phase aberration. We performed simulations for point targets positioned at 5 cm. We also simulated channel data from diffuse scatterers with a density of 25 scatterers per resolution cell to ensure fully developed speckle [40]. We modeled a linear array transducer with 3.0 MHz center frequency and 60% fractional bandwidth. Table 2 indicates simulated transducer parameters, including geometry.
TABLE II.
Field II Simulation Parameters
| Parameter | Value |
|---|---|
| Number of elements | 128 |
| Height of element | 2 mm |
| Width of element | 0.254 mm |
| Kerf | 0.003 mm |
| Lateral pitch | 0.257 mm |
| Center frequency (fc) | 3 MHz |
| Sampling frequency (simulation) | 640 MHz |
| Sampling frequency (downsampled) | 40 MHz |
| Bandwidth | 60% |
| Transmit focal depth | 5 cm |
| Transmit/Receive F/# | 1.5 |
In order to simulate the effects of aberrated wavefronts, a zero-mean, random near-field phase screen was used to model aberration profiles. The aberration model was generated by convolving a Gaussian random process with a Gaussian function [12]. The aberration model was then applied on both transmit and receive to individual mathematical sub-elements, making up the transducer aperture. Aberration levels were characterized by the aberration profile’s autocorrelation full-width at half-maximum (FWHM) and the root-mean-square (RMS). Lower autocorrelation FWHM and higher RMS are indicative of increased aberration levels. In principle, the lower autocorrelation FWHM would come from greater spatial variability in the tissues generating the aberration, whereas higher RMS would be related to larger deviations in the average sound speed relative to 1540 m/s along the path to each transducer element. We generated aberrated wavefronts of FWHM = 5.0 ± 0.1 mm, and RMS = 50 ns [41], and multipath scattering was simulated using a pseudo non-linear adaptation to Field II [42], [43]. We scaled the clutter level of multipath scattering, relative to the signal of interest (SOI) to specified signal-to-clutter ratios (SCR),
| (12) |
When evaluating clutter, we considered three levels of 0, 10 and 20 dB SCR.
E. Error Metrics
We quantified aberration profile errors as a function of degrees of freedom
| (13) |
where τpre is the profile estimated from the original uncluttered data, and τpost is the data after ADMIRE or adaptive ADMIRE.
We also measured FWHM and RMS percent error as a function of degrees of freedom
| (14) |
where κpre is FWHM/RMS values measured on the uncluttered wavefronts, and κpost is measured values after ADMIRE or adaptive ADMIRE.
Along with the above error metrics, we used a root-mean-square error (RMSE) of FWHM/RMS values quantified with aberration profiles from post-filtered and post-adaptive ADMIRE data, as a function of spatial cutoff frequencies
| (15) |
where υapplied are FWHM/RMS values measured on the uncluttered, unfiltered data, υpost are the measured values after spatial filtering or adaptive ADMIRE, respectively. Nrlz is the number of realizations.
F. In Vivo Studies
We measured aberration profiles on in vivo liver data using ADMIRE and adaptive ADMIRE. The data were obtained from a study approved by the Duke University Institutional Review Board (IRB) with written consent provided by all participants. These data were acquired with a Siemens S2000 and 4C-1 curvilinear array (Siemens Healthcare, Ultrasound Business Unit, Mountain View, CA). Table 3 summarizes the in vivo data acquisition parameters.
TABLE III.
in vivo Study Design
| Data Measurement Parameters
| |
|---|---|
| Parameter | Value |
| Transducer | 4C-1 curvilinear array |
| Aperture length | 3.05 cm |
| Center frequency (fc) | 4 MHz |
| Sampling frequency (fs) | 40 MHz |
| Speed of sound (c) | 1540 m/s |
Additionally, we computed contrast and contrast-to-noise ratio (CNR) on the B-mode images. Contrast and CNR were computed using
| (16) |
| (17) |
where (μl, σ2l) and (μb, σ2b) are the value of (mean, variance) of the enveloped but uncompressed data inside and outside hypoechoic structure, respectively.
G. Resolution Target and Contrast Target Simulations
Field II was used to perform resolution target simulations in the presence of phase aberration, in order to investigate and clarify the effect of ADMIRE and adaptive ADMIRE with and without aberration correction on image quality. We used the parameters in Table 2 for the simulations. We simulated two cases: one with resolution targets at the transmit focal depth, and the other with targets shallow to the focus. In the first case, the focal depth for transmit was fixed at a 3.0 cm depth, with a F/1.5 for transmit and receive aperture. Channel data were acquired from a simulated resolution phantom containing five point targets, located at the focal depth with lateral intervals 4, 3, 2 and 1 mm. In the second case the scatterers were fixed, but the focus was moved to 5.0 cm. Other parameters such as F/# and frequency remained constant. We generated two sets of control data from the simulated resolution phantom with no aberration—one using standard delay-and-sum (DAS) beamforming (referred to as DAS only), and the other by applying ADMIRE.
Apart from these unaberrated data, aberrated data were also simulated. We simulated aberrators from a combination of FWHM = 5.0 and 2.5 mm and RMS = 25 and 50 ns, modeled as zero-mean, random near-field phase screens [12]. The selected aberrator levels were consistent with those in the literature for liver and abdominal imaging [44]–[47]. As previously described, twelve realizations were simulated for each aberrator case. We then applied normal DAS, ADMIRE and adaptive ADMIRE with and without phase aberration correction. To implement aberration correction, we used the time-shift compensation method with estimated aberration profile for each A-line channel data at a 3.0 cm depth in a 3.6 mm window (4.7 μs) [33]. Unless stated, aberration profiles are estimated from the filtered data using a spatial cutoff frequency of 0.4 mm−1 [36], [37].
For a metric of image quality, energy suppression was quantified with the enveloped but uncompressed B-mode data, by computing the ratio of the average intensity from adjacent point targets specified as the sum of power above −10 dB normalized by area and off-axis clutter energy specified as the sum of power below −10 dB normalized by area between the two points (Iclutter), expressed by clutter ratio (CR),
| (18) |
We then determined clutter ratios with different lateral separation lengths from DAS only and ADMIRE without aberration. We also measured the following in the presence of aberration: DAS, ADMIRE and adaptive ADMIRE with and without aberration correction. These simulations allowed us to test whether the suppression of phase aberration using ADMIRE has a positive effect on image quality.
We also simulated anechoic cyst phantoms in Field II to further evaluate the performance of ADMIRE and adaptive ADMIRE in highly aberrated wavefronts with and without reverberation clutter. The anechoic cyst was a 5 mm diameter circle 3 cm deep, while the background speckle was fully developed with a density of 25 scatterers per resolution cell [40], as indicated in the above section.
The aberration strength applied to this simulation was FWHM = 2.5 mm and RMS = 50 ns, which is modeled by a zero-mean and random near-field phase screen. We also added reverberation clutter at an SCR of 0 dB using our pseudo non-linear simulation method [42]. We then performed image quality metrics—contrast and CNR measurements indicated in (16) and (17). The contrast and CNR values obtained after applying ADMIRE and adaptive ADMIRE were compared to those of DAS, respectively. We also corrected aberrated wavefronts using the same correction method we applied in resolution target simulation. We then measured contrast and CNR from aberration corrected data for DAS, ADMIRE and adaptive ADMIRE, respectively. There are 6 independent speckle realizations prepared for the speckle-based target simulation.
III. RESULTS
A. Aberration Profile Measurements in Simulations
Fig. 2 (a) and (b) show two examples of wavefronts and estimated aberration profiles from a point target and diffuse scattering simulations in the presence of phase aberration and in the presence of multipath scattering and phase aberration. The results suggest reverberation clutter could distort the appearance of wavefronts from the region of interest. Both estimated aberration profiles with 0 and 10 dB signal-to-clutter ratios were distorted in the point target and diffuse scattering simulations. Aberration profiles in simulations with a lower clutter level (SCR = 20 dB) are comparable to cases without additional clutter. These results reveal how multipath scattering could impact aberration profile measurements.
Fig. 2.

Simulations in the presence of phase aberration (No Clutter), and in the presence of multipath scattering and phase aberration with three different clutter levels (SCR = 0, 10 and 20 dB), having (a) a point target and (b) diffuse scattering. Four wavefronts (left) in each case of simulations, with corresponding estimated aberration profiles (right), are shown.
B. Aberration Profile Errors from Simulations
Figs. 3 and 4 show measured aberration profile errors, including wavefront reconstructions for three different degrees of freedom for the ADMIRE decomposition. Fig. 3 shows the first set of results. The first set of results from a point target and diffuse scattering simulations derived from ADMIRE and adaptive ADMIRE in the presence of phase aberration are shown. Results in Figs. 3 (a) and (b) suggest ADMIRE suppresses phase aberration when the degrees of freedom are low. In contrast, Figs. 3 (b) and (d) show that adaptive ADMIRE preserves phase aberration based wavefront distortion even at low degrees of freedom indicating that adaptive ADMIRE produces a more parsimonious model in the presence of phase aberration, meaning that the model produces a better fit with fewer degrees of freedom.
Fig. 3.

Simulations in the presence of phase aberration for a point target using (a) ADMIRE and (c) adaptive ADMIRE, and for diffuse scattering using (b) ADMIRE and (d) adaptive ADMIRE. Three wavefront reconstructions are shown for three different degrees of freedom in the model-fit (left). The error of measured aberration profiles is quantified as a function of degrees of freedom (right).
Fig. 4.

Simulation in the presence of multipath scattering and phase aberration with three different clutter levels (SCR = 0, 10 and 20 dB) for a point target using (a) ADMIRE and (c) adaptive ADMIRE, and for diffuse scattering using (b) ADMIRE and (d) adaptive ADMIRE. Each clutter level shows three wavefront reconstructions for three different degrees of freedom in the model-fit. The errors of measured aberration profiles as a function of degrees of freedom are illustrated (lower right).
Fig. 4 illustrates a point target and diffuse scattering simulations, using ADMIRE and adaptive ADMIRE, in the presence of multipath scattering and phase aberration. Fig. 4 qualitatively demonstrates that ADMIRE and adaptive ADMIRE suppress most clutter. Fig. 4 (b) and (d) also show that adaptive ADMIRE better preserves phase aberration in the presence of multipath scattering because aberration errors converge with lower degrees of freedom. These findings suggest that adaptive ADMIRE enables us to better characterize reverberation clutter effects and phase aberration by separating these two effects.
Comparing results from a point target and diffuse scattering simulations in the presence of phase aberration (Fig. 3) and in the presence of multipath scattering and phase aberration (Fig. 4), shows that aberration profiles estimated from diffuse scatterers have larger errors than those in a point target with the same degrees of freedom.
C. FWHM and RMS Errors from Simulations
Fig. 5 presents the results from diffuse scattering simulations in the presence of multipath scattering and phase aberration, using (a) ADMIRE and (b) adaptive ADMIRE. Comparing the results of RMS errors, the RMS errors resulting from adaptive ADMIRE decrease and converge quickly with lower degrees of freedom, relative to ADMIRE. These results indicate that ADMIRE does not efficiently reproduce aberrated wavefronts with low degrees of freedom, while adaptive ADMIRE reasonably preserves the phase aberration profile. These findings are consistent with those observed with the aberration profile errors.
Fig. 5.

FWHM (left) and RMS (right) errors from diffuse scattering simulations in the presence of multipath scattering and phase aberration with SCR = 0, 10 and 20 dB, using (a) ADMIRE and (b) adaptive ADMIRE. The aberration level is FWHM = 5.0 ± 0.1 mm and RMS = 50 ns.
D. Root-Mean-Square Errors of FWHM and RMS from Simulations
Fig. 6 shows the results of computing RMSE of aberration profiles’ FWHM and RMS values, from several different scenarios, as a function of three spatial filter cutoffs including an unfiltered case. These scenarios included aberrated wavefronts that are uncluttered, and aberrated wavefronts that are cluttered with 0 and 10 dB SCR, but not including 20 dB SCR case because of minimal differences from the uncluttered case. The results of spatial filtering are consistent with the literature [36], [37]. We also observe that spatial cutoff frequencies of 0.4 mm−1 and 0.6 mm−1 may not make much of a difference in the presence of moderate clutter when comparing wavefronts obtained after filtering and adaptive ADMIRE. These findings suggest that adaptive ADMIRE is effective in preserving the distortion of aberrated wavefronts in the presence of strong clutter environments, in conjunction with spatial filtering with appropriate cutoff frequencies.
Fig. 6.

Root-mean-square errors (RMSE) of FWHM (left) and RMS (right) quantified with aberration profiles estimated from post-filter and post-adaptive ADMIRE channel data in the presence of aberration and in the presence of clutter and aberration, using (a) a point target and (b) diffuse scattering simulations. The level of aberrated wavefronts are FWHM = 5.0 ± 0.1 mm and RMS = 50 ns. The RMSE values of FWHM/RMS are compared with three various spatial cutoff frequencies of 0.2 mm−1, 0.4 mm−1 and 0.6 mm−1 including an unfiltered case. The degrees of freedom when implementing ADMIRE and adaptive ADMIRE are in a range between 50 and 70.
E. Energy Suppression from Resolution Simulations
Because we observed that ADMIRE leads to suppressed levels of aberration, we report some simple results related to image quality. Figs. 7 and 8 present the simulated resolution phantom and the measured energy suppression with four lateral separation intervals and four sets of different aberration levels at (a) focus at the target depth, (b) focus past the target depth. The simulated data include DAS only, ADMIRE with no aberration, 12 realizations for DAS with aberration, post-ADMIRE and post-adaptive ADMIRE with and without phase aberration correction at (a) focus at the target depth, (b) focus past the target depth, respectively. The simulations reveal several points. First, as expected, phase aberration lowers spatial resolution and degrades image quality due to higher side-lobes. Second, phase aberration correction applied to post-ADMIRE data provides little additional improvement, while DAS and post-adaptive ADMIRE with aberration correction shows some improvement, particularly in the cases with higher aberration levels. Lastly, adaptive ADMIRE plus aberration correction has the most benefit on image quality when the targets are close and at the focus. The results also indicate that the suppression of phase aberration as a result of ADMIRE is useful and beneficial to image quality improvement, but these results are most compelling when targets are far apart.
Fig. 7.
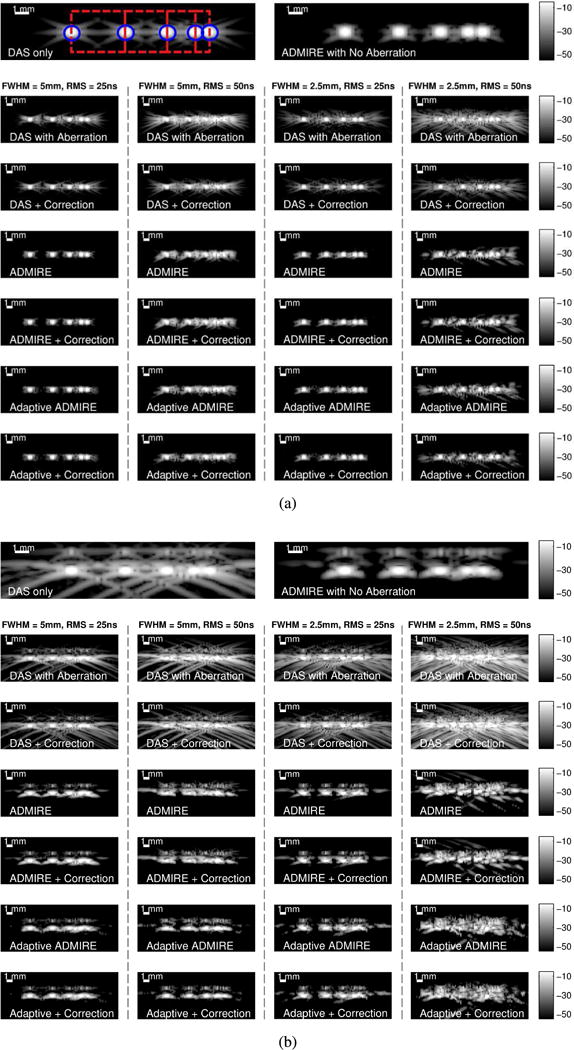
The simulated wire phantom images on resolution target simulations are presented. Four blue circles are the areas used to measure power of enveloped signal, while four sections enclosed by the red dashed lines are the areas used to measure off-axis clutter energy, for lateral separation intervals of 4, 3, 2 and 1 mm, respectively. Two images on the top row are the resolution phantoms of normal delay-and-sum (DAS) and ADMIRE with no phase aberration, respectively. Four sets of the simulated resolution phantom images with different aberrator strengths at (a) focus at the target depth, (b) focus past the target depth are also shown.
Fig. 8.

The results of measured energy suppression for several lateral separation lengths are shown as boxplots, including four sets of different aberration levels. Each set of results from the cases at (a) focus at the target depth, (b) focus past the target depth includes DAS only, ADMIRE with no aberration, 12 realizations for DAS with aberration, post-ADMIRE and post-adaptive ADMIRE with and without phase aberration correction applied. Aberration profiles are estimated from the filtered data using a spatial cutoff frequency of 0.4 mm−1.
F. Simulated Anechoic Cyst Image Quality
Along with the resolution target simulation, we performed contrast target simulations. Fig. 9 demonstrates the matched simulated anechoic cyst phantom images formed after applying DAS, ADMIRE and adaptive ADMIRE, with and without aberration correction. When compared to DAS images, ADMIRE and adaptive ADMIRE recover image quality and provide better contrast in and around the cyst region, suppressing image degradation sources (i.e., clutter). Accounting for images after applying aberration correction method, there is no significant improvement before and after correction with qualitative measures, but we still identify small improvement in background speckle patterns in the cases of DAS and adaptive ADMIRE.
Fig. 9.
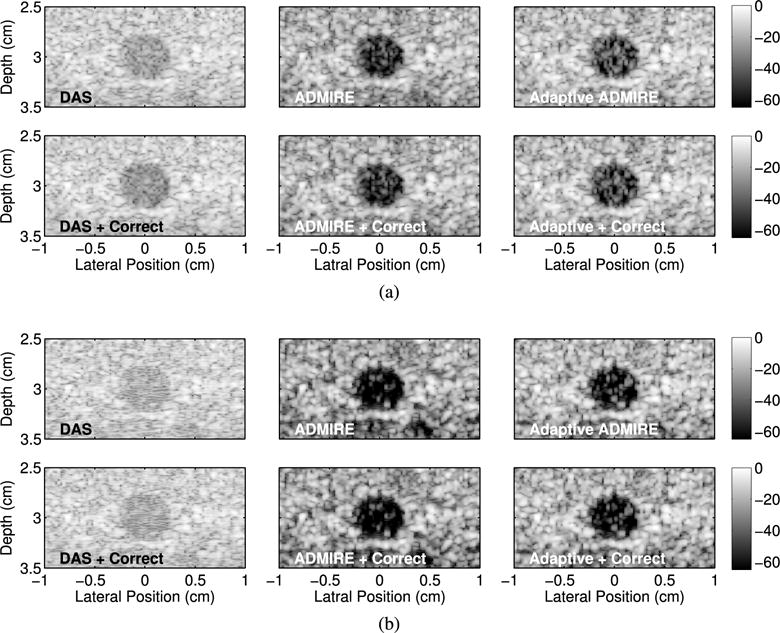
The matched simulated anechoic cyst phantom images formed after applying DAS, ADMIRE and adaptive ADMIRE with and without aberration correction in the presence of aberrated wavefronts with FWHM = 2.5 mm and RMS = 50 ns strength, in the cases of (a) uncluttered and (b) SCR = 0 dB cluttered environments, respectively.
To quantify the image data in Fig. 9, we computed the values of contrast and CNR, as reported in Fig. 10. In the case of DAS with uncluttered and SCR 0 dB clutter environments, aberration correction significantly improves image quality, particularly in CNR. In principle, since adaptive ADMIRE preserves phase aberration during decluttering, we observe that ADMIRE images may have higher contrast than the images formed after applying adaptive ADMIRE, but aberration correction processed after adaptive ADMIRE may recover degraded image quality caused by wavefront distortion. Results obtained from adaptive ADMIRE with aberration correction indicates image quality improvement in contrast and CNR when compared with those values of adaptive ADMIRE. It is also interesting to note that ADMIRE and adaptive ADMIRE may be more robust in the presence of higher clutter environments, together with higher aberrated wavefronts. Additionally, these findings from the contrast target simulations are consistent with the resolution target simulation results in Fig. 8.
Fig. 10.

The results of simulated anechoic cyst image quality metrics quantifying (a) contrast and (b) CNR for uncluttered and SCR = 0 dB clutter scenarios, respectively. There are 6 independent speckle realizations prepared for this simulation.
G. Characterization of Aberration Profiles from In Vivo Data
We used 13 sets of in vivo liver data to characterize aberration profiles. The aberration profiles’ FWHM and RMS were quantified. Fig. 11 demonstrates wavefronts and B-mode images obtained from one example case and the matched data after applying ADMIRE, 1D spatial filter (0.4 mm−1 cutoff) and adaptive ADMIRE, along with the corresponding estimated aberration profiles. The results indicate that ADMIRE smooths the aberrated wavefronts and suppresses aberration, compared with the wavefronts obtained from post-adaptive ADMIRE data. It is also worth noting that the resulting B-mode images from ADMIRE and adaptive ADMIRE are qualitatively better than other images obtained from the original in vivo data and the post-filtered data.
Fig. 11.
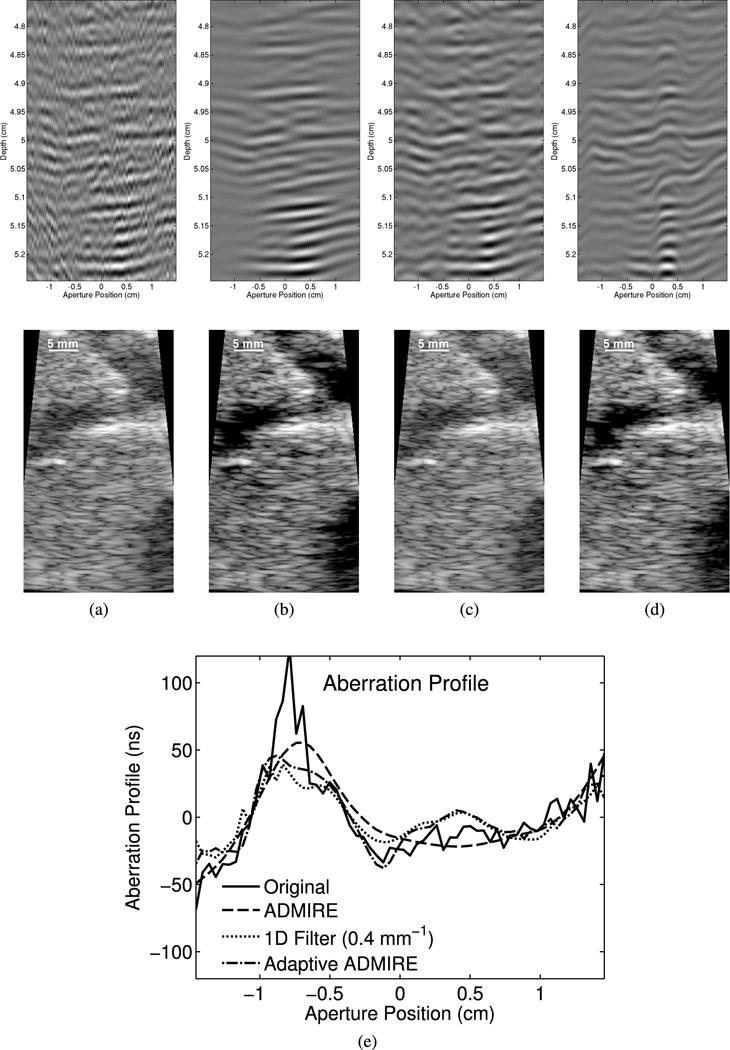
The wavefronts and corresponding B-mode images of (a) the original in vivo data, (b) ADMIRE, (c) 1D Filter (0.4 mm−1cutoff) and (d) adaptive ADMIRE are shown, along with (i) the corresponding estimated aberration profiles. The results indicate that ADMIRE, specifically, appears to smooth the wavefront and suppresses aberration while adaptive ADMIRE seems to preserve aberration so it can be characterized more accurately.
Fig. 12 demonstrates effect of the spatial filter on in vivo data. Low cutoff frequencies may remove aberrated signals containing high spatial frequency components along with clutter. While, aberration estimation may be less accurate when using high cutoff frequencies due to unsuppressed off-axis or reverberation clutter corrupting aberration measurements. Fig. 12 also indicates that there is potential for significant bias based on the spatial filter that is chosen. This trend is particularly noticeable in Fig. 12 (a). However, with adaptive ADMIRE, which only uses the spatial filters as an initial estimate of the aberration profile, we observe that adaptive ADMIRE has a much wider range of estimated aberration levels. These in vivo results highlight a shortcoming of conventional method and demonstrate the potential role of adaptive ADMIRE for better characterizing aberrated wavefronts when there is little prior knowledge of the degree of wavefront distortion.
Fig. 12.

The results of characterization of estimated aberration profiles from in vivo data are shown as boxplots. Results are shown for the original in vivo data, post-ADMIRE, post-adaptive ADMIRE and post-filtered data with three various spatial cutoff frequencies (0.6, 0.4 and 0.2 mm−1). Aberration profiles are characterized by (a) the autocorrelation length full-width at half-maximum (FWHM) and (b) the root-mean square (RMS).
H. In Vivo Image Quality
We compare three algorithms—aberration correction, ADMIRE and adaptive ADMIRE. The aberration correction method was applied to post-ADMIRE and post-adaptive ADMIRE data. Results, as shown in Fig. 13, demonstrate that ADMIRE and adaptive ADMIRE improved both contrast and CNR from normal B-mode images. Table IV also summarizes the relative improvements of the contrast and CNR. These results may be based towards ADMIRE because anechoic regions visible in normal B-mode were used to quantify image quality.
Fig. 13.

Contrast and contrast-to-noise ratio (CNR) with algorithms are plotted as a function of contrast and CNR of the normal B-mode image. There are 13 contrast and CNR measurements obtained from each algorithm. (a) Contrast, (b) CNR
TABLE IV.
Relative Improvement from Original B-mode (In Vivo)
| Algorithm | Contrast Improvement (dB) | CNR Improvement (dB) |
|---|---|---|
| Aberration Correction | 0.090 ± 0.27 | 0.076 ± 0.23 |
| ADMIRE | 7.1 ± 2.5 | 0.86 ± 0.92 |
| ADMIRE+Correction | 6.8 ± 2.3 | 0.90 ± 0.89 |
| Adaptive ADMIRE | 6.6 ± 2.7 | 0.87 ± 1.1 |
| Adaptive+Correction | 6.5 ± 2.7 | 0.72 ± 1.1 |
IV. Discussion and Conclusions
Here we considered the role of model-based methods in the presence of aberration. The results show that ADMIRE only preserves phase aberration when the degrees of freedom are high. To make the model more parsimonious in the presence of aberration, we introduced adaptive ADMIRE.
Simulations that included both multipath scattering and phase aberration showed multipath scattering distorts estimates of wavefront aberration, as illustrated in Fig. 2. Specifically, aberration levels in the presence of clutter are estimated to be higher than the simulated level of aberration.
We then evaluated ADMIRE and adaptive ADMIRE performance in vivo, quantifying aberration profiles. The results, as shown in Fig. 7 and 8, highlight a shortcoming of conventional filters and demonstrate the potential role of adaptive ADMIRE for better charactering aberrated wavefronts when there is little prior knowledge of the degree of wavefront distortion. These in vivo data results are restricted to abdominal imaging and are consistent with related literature [44], and it is known that levels of aberration are different in other scenarios like breast imaging and echocardiography. Additionally, in this study we applied aberration estimation and correction methods that are simple and basic with fundamental limitations [48]. It is possible that more sophisticated algorithms may yield better results.
As stated above, adaptive ADMIRE has two major aims. The first aim is to establish a tool to test the best way to address aberration, while the second aim is to effectively differentiate aberrated signals of interest from other forms of clutter, and these aberrations are well addressed by aberration correction methods. Based on the findings from simulations, adaptive ADMIRE shows an ability to preserve aberration while decluttering. For instance, results in Fig. 4 and Fig. 5 demonstrate that adaptive ADMIRE can reproduce original aberrated wavefronts with very low degrees of freedom, compared to ADMIRE. Fig. 6 also reveals that adaptive ADMIRE can identify phase aberration effects in the presence of clutter and aberration. These results indicate that adaptive ADMIRE may be useful to accomplish the second aim. However, to increase performance, adaptive ADMIRE should be implemented with a suitable spatial filter. One possible explanation for the benefit seen by ADMIRE and adaptive ADMIRE is the reduction of aberrator integration error after reconstruction.
Finally, we briefly examined the role that ADMIRE and adaptive ADMIRE play on image quality in the presence of wavefront aberration. The results in Figs. 8 and 10 suggest that ADMIRE plus aberration correction does not provide any additional improvement, but that use of adaptive ADMIRE followed by conventional aberration estimation and correction methods could be the best way to address aberration effects when targets are at the focus. The suggested approach may be more effective in higher aberrated environments, as indicated in Fig. 8 with FWHM = 2.5 mm, RMS = 50 ns and FWHM = 5 mm, RMS = 50 ns. The findings are also indicated in the speckle-based target simulation results demonstrated in Fig. 10. While the image quality metrics show that contrast in images obtained from ADMIRE with and without correction is similar to the image contrast from adaptive ADMIRE plus correction, but the ADMIRE CNR values are lower than those of adaptive ADMIRE plus correction. A possible explanation for this may be that we selected low degrees of freedom when implementing ADMIRE with model-mismatch due to local sound speed variation (i.e., phase aberration). ADMIRE with higher degrees of freedom loses contrast but increases CNR. The in vivo results (Fig. 13) are consistent with those of simulations because most of the features of interest in vivo images may be outside of the transmit focus’ depth of field, but in some cases adaptive ADMIRE plus correction improves contrast and CNR compared to adaptive ADMIRE. The image quality results also demonstrate that ADMIRE by itself suppresses phase aberration effects along with clutter, providing benefits to image quality compared to conventional methods.
Acknowledgments
The authors would like to thank the staff of the Vanderbilt University ACCRE computing resource. We would also like to thank Jeremy Dahl for insightful suggestions. This work was supported by NIH grants R01EB020040 and S10OD016216-01.
Biographies

Kazuyuki Dei was born and raised in Saitama, Japan. He received the B.S. degree in mechanical engineering from the University of California, Berkeley, CA, in 2000. He worked for Fujitsu Limited and Fujitsu Semiconductor America Inc. as an electrical design and development engineer over 12 years. He is currently pursuing the Ph.D. degree in biomedical engineering at Vanderbilt University, Nashville, TN. His research interests include a model-based clutter suppression and phase-aberration measurements, beamforming and signal processing.

Brett Byram received the B.S. degree in biomedical engineering and math from Vanderbilt University, Nashville, TN, in 2004. He received the Ph.D. degree in biomedical engineering from Duke University, Durham, NC, where he then stayed as a research assistant professor. In August 2013, Brett joined the Biomedical Engineering department at Vanderbilt University, Nashville, TN, as an assistant professor. He has spent time working in Jørgen Jensen’s Center for Fast Ultrasound, Lyngby, Denmark, and also in Siemens Healthcare’s ultrasound division, Mountain View, CA. He currently runs the Biomedical Elasticity and Acoustic Measurement (BEAM) Laboratory, where he and others in the lab pursue solutions to clinical problems using ultrasound. He is affiliated with the Vanderbilt Initiative in Surgery and Engineering (ViSE) and the Vanderbilt University Institute of Imaging Science (VUIIS). His research interests include beamforming, motion estimation, and other related signal processing and hardware development tasks.
References
- 1.Bushberg JT, Boone JM. The essential physics of medical imaging. Lippincott Williams & Wilkins; 2011. [Google Scholar]
- 2.Anderson ME, Trahey GE. The direct estimation of sound speed using pulse–echo ultrasound. The Journal of the Acoustical Society of America. 1998;104(5):3099–3106. doi: 10.1121/1.423889. [DOI] [PubMed] [Google Scholar]
- 3.Anderson M, McKeag M, Trahey G. The impact of sound speed errors on medical ultrasound imaging. The Journal of the Acoustical Society of America. 2000;107(6):3540–3548. doi: 10.1121/1.429422. [DOI] [PubMed] [Google Scholar]
- 4.Flax S, O’Donnell M. Phase-aberration correction using signals from point reflectors and diffuse scatterers: Basic principles. Ultrasonics, Ferroelectrics, and Frequency Control, IEEE Transactions on. 1988;35(6):758–767. doi: 10.1109/58.9333. [DOI] [PubMed] [Google Scholar]
- 5.Pinton G, Trahey GE, Dahl J. Erratum: Sources of image degradation in fundamental and harmonic ultrasound imaging using nonlinear, full-wave simulations. Ultrasonics, Ferroelectrics, and Frequency Control, IEEE Transactions on. 2011;58(6):1272–1283. doi: 10.1109/TUFFC.2011.1938. [DOI] [PMC free article] [PubMed] [Google Scholar]
- 6.Byram B, Jakovljevic M. Ultrasonic multipath and beamforming clutter reduction: a chirp model approach. Ultrasonics, Ferroelectrics, and Frequency Control, IEEE Transactions on. 2014;61(3):428–440. doi: 10.1109/TUFFC.2014.2928. [DOI] [PMC free article] [PubMed] [Google Scholar]
- 7.O’Donnell M, Flax S. Phase aberration measurements in medical ultrasound: human studies. Ultrasonic Imaging. 1988;10(1):1–11. doi: 10.1177/016173468801000101. [DOI] [PubMed] [Google Scholar]
- 8.Karaman M, Atalar A, Köymen H, O’Donnell M. A phase aberration correction method for ultrasound imaging. Ultrasonics, Ferroelectrics, and Frequency Control, IEEE Transactions on. 1993;40(4):275–282. doi: 10.1109/58.251275. [DOI] [PubMed] [Google Scholar]
- 9.Liu DL, Waag RC. Correction of ultrasonic wavefront distortion using backpropagation and a reference waveform method for time-shift compensation. The Journal of the Acoustical Society of America. 1994;96(2):649–660. doi: 10.1121/1.410304. [DOI] [PubMed] [Google Scholar]
- 10.Hinkelman LM, Liu D-L, Waag RC, Zhu Q, Steinberg BD. Measurement and correction of ultrasonic pulse distortion produced by the human breast. The Journal of the Acoustical Society of America. 1995;97(3):1958–1969. doi: 10.1121/1.412069. [DOI] [PubMed] [Google Scholar]
- 11.Tabei M, Mast TD, Waag RC. Simulation of ultrasonic focus aberration and correction through human tissue. The Journal of the Acoustical Society of America. 2003;113(2):1166–1176. doi: 10.1121/1.1531986. [DOI] [PubMed] [Google Scholar]
- 12.Dahl JJ, Guenther D, Trahey GE, et al. Adaptive imaging and spatial compounding in the presence of aberration. Ultrasonics, Ferroelectrics, and Frequency Control, IEEE Transactions on. 2005;52(7):1131–1144. doi: 10.1109/tuffc.2005.1503999. [DOI] [PubMed] [Google Scholar]
- 13.Dahl JJ, McAleavey S, Pinton GF, Soo MS, Trahey GE, et al. Adaptive imaging on a diagnostic ultrasound scanner at quasi real-time rates. Ultrasonics, Ferroelectrics, and Frequency Control, IEEE Transactions on. 2006;53(10):1832–1843. doi: 10.1109/tuffc.2006.115. [DOI] [PubMed] [Google Scholar]
- 14.Tillett JC, Astheimer JP, Waag RC. A model of distributed phase aberration for deblurring phase estimated from scattering. Ultrasonics, Ferroelectrics, and Frequency Control, IEEE Transactions on. 2010;57(1):214–228. doi: 10.1109/TUFFC.2010.1400. [DOI] [PMC free article] [PubMed] [Google Scholar]
- 15.Dahl JJ, Sheth NM. Reverberation clutter from subcutaneous tissue layers: Simulation and in vivo demonstrations. Ultrasound in medicine & biology. 2014;40(4):714–726. doi: 10.1016/j.ultrasmedbio.2013.11.029. [DOI] [PMC free article] [PubMed] [Google Scholar]
- 16.Foldy LL. The multiple scattering of waves. i. general theory of isotropic scattering by randomly distributed scatterers. Physical Review. 1945;67(3–4):107. [Google Scholar]
- 17.Chivers R. The scattering of ultrasound by human tissues⣔ some theoretical models. Ultrasound in medicine & biology. 1977;3(1):1–13. doi: 10.1016/0301-5629(77)90115-6. [DOI] [PubMed] [Google Scholar]
- 18.Nicholas D, Hill C, Nassiri D. Evaluation of backscattering coefficients for excised human tissues: principles and techniques. Ultrasound in Medicine & Biology. 1982;8(1):7–15. [Google Scholar]
- 19.Nicholas D. Evaluation of backscattering coefficients for excised human tissues: results, interpretation and associated measurements. Ultrasound in Medicine & Biology. 1982;8(1):17–28. [Google Scholar]
- 20.Bly S, Foster F, Patterson M, Foster D, Hunt J. Artifactual echoes in b-mode images due to multiple scattering. Ultrasound in medicine & biology. 1985;11(1):99–111. doi: 10.1016/0301-5629(85)90012-2. [DOI] [PubMed] [Google Scholar]
- 21.Fink M. Time reversal of ultrasonic fields. i. basic principles. Ultrasonics, Ferroelectrics, and Frequency Control, IEEE Transactions on. 1992;39(5):555–566. doi: 10.1109/58.156174. [DOI] [PubMed] [Google Scholar]
- 22.Lediju MA, Pihl MJ, Dahl JJ, Trahey GE. Quantitative assessment of the magnitude, impact and spatial extent of ultrasonic clutter. Ultrasonic imaging. 2008;30(3):151–168. doi: 10.1177/016173460803000302. [DOI] [PMC free article] [PubMed] [Google Scholar]
- 23.Dahl JJ, Jakovljevic M, Pinton GF, Trahey GE. Harmonic spatial coherence imaging: an ultrasonic imaging method based on backscatter coherence. Ultrasonics, Ferroelectrics, and Frequency Control, IEEE Transactions on. 2012;59(4):648–659. doi: 10.1109/TUFFC.2012.2243. [DOI] [PMC free article] [PubMed] [Google Scholar]
- 24.Nasholm SP, Angelsen BA. Surf imaging beams in an aberrative medium: generation and postprocessing enhancement. Ultrasonics, Ferroelectrics, and Frequency Control, IEEE Transactions on. 2012;59(11) doi: 10.1109/TUFFC.2012.2494. [DOI] [PubMed] [Google Scholar]
- 25.Byram B, Dei K, Tierney J, Dumont D. A model and regularization scheme for ultrasonic beamforming clutter reduction. Ultrasonics, Ferroelectrics, and Frequency Control, IEEE Transactions on. 2015;62(11):1913–1927. doi: 10.1109/TUFFC.2015.007004. [DOI] [PMC free article] [PubMed] [Google Scholar]
- 26.Byram B, Dei K, Dumont D. An improved acoustic clutter model and direct in vivo assessment of off-axis and multipath clutter energy in the liver,” in. Ultrasonics Symposium (IUS), 2014 IEEE International IEEE. 2014:531–534. [Google Scholar]
- 27.Byram B. Ultrasonic reverberation and off-axis clutter suppression using aperture domain signal decomposition. SPIE Medical Imaging International Society for Optics and Photonics. 2013:86750T–86750T. [Google Scholar]
- 28.Dei K, Byram B. Model-based clutter suppression in the presence of phase-aberration from in vivo data and simulations. Ultrasonics Symposium (IUS), 2015 IEEE International. 2015 Oct;:1–4. [Google Scholar]
- 29.Selfridge A, Kino G, Khuri-Yakub B. A theory for the radiation pattern of a narrow-strip acoustic transducer. Applied Physics Letters. 1980;37(1):35–36. [Google Scholar]
- 30.Zou H, Hastie T. Regularization and variable selection via the elastic net. Journal of the Royal Statistical Society: Series B (Statistical Methodology) 2005;67(2):301–320. [Google Scholar]
- 31.Tibshirani RJ, Taylor J, et al. Degrees of freedom in lasso problems. The Annals of Statistics. 2012;40(2):1198–1232. [Google Scholar]
- 32.Yang B. A study of inverse short-time fourier transform. 2008 IEEE International Conference on Acoustics, Speech and Signal Processing. 2008:3541–3544. [Google Scholar]
- 33.Liu DL, Waag RC. Time-shift compensation of ultrasonic pulse focus degradation using least-mean-square error estimates of arrival time. The Journal of the Acoustical Society of America. 1994;95(1):542–555. doi: 10.1121/1.408348. [DOI] [PubMed] [Google Scholar]
- 34.Loupas T, Powers J, Gill RW. An axial velocity estimator for ultrasound blood flow imaging, based on a full evaluation of the doppler equation by means of a two-dimensional autocorrelation approach. Ultrasonics, Ferroelectrics, and Frequency Control, IEEE Transactions on. 1995;42(4):672–688. [Google Scholar]
- 35.Gauss RC, Trahey GE, Soo MS. Wavefront estimation in the human breast.” International Society for Optics and Photonics. 2001:172–181. [Google Scholar]
- 36.Dahl JJ, Feehan TJ. Direction of arrival filters for improved aberration estimation. Ultrasonic imaging. 2008;30(1):1–20. doi: 10.1177/016173460803000103. [DOI] [PubMed] [Google Scholar]
- 37.Dahl JJ, Trahey GE. Ultrasonics, 2003 IEEE Symposium on. Vol. 2. IEEE; 2003. Off-axis scatterer filters for improved aberration measurements; pp. 1094–1098. [Google Scholar]
- 38.Jensen JA, Svendsen NB. Calculation of pressure fields from arbitrarily shaped, apodized, and excited ultrasound transducers. Ultrasonics, Ferroelectrics, and Frequency Control, IEEE Transactions on. 1992;39(2):262–267. doi: 10.1109/58.139123. [DOI] [PubMed] [Google Scholar]
- 39.Jensen JA. Field: A program for simulating ultrasound systems. 10th Nordic-Baltic Conference on Biomedical Imaging. 1996;4(Supplement 1, Part 1):351–353. [Google Scholar]
- 40.Wagner RF, Smith SW, Sandrik JM, Lopez H. Statistics of speckle in ultrasound b-scans. Sonics and Ultrasonics, IEEE Transactions on. 1983;30(3):156–163. [Google Scholar]
- 41.Seo CH, Yen JT. Evaluating the robustness of dual apodization with cross-correlation. Ultrasonics, Ferroelectrics, and Frequency Control, IEEE Transactions on. 2009;56(2):291–303. doi: 10.1109/TUFFC.2009.1038. [DOI] [PMC free article] [PubMed] [Google Scholar]
- 42.Byram B, Shu J. Pseudononlinear ultrasound simulation approach for reverberation clutter. Journal of Medical Imaging. 2016;3(4):046005–046005. doi: 10.1117/1.JMI.3.4.046005. [DOI] [PMC free article] [PubMed] [Google Scholar]
- 43.Byram B, Shu J. A pseudo non-linear method for fast simulations of ultrasonic reverberation. SPIE Proceedings Vol 9790: Medical Imaging 2016: Ultrasonic Imaging and Tomography. 2016 [Google Scholar]
- 44.Fernandez A, Dahl JJ, Dumont DM, Trahey GE. Ultrasonics Symposium, 2001 IEEE. Vol. 2. IEEE; 2001. Aberration measurement and correction with a high resolution 1.75 d array; pp. 1489–1494. [Google Scholar]
- 45.Lacefield JC, Pilkington WC, Waag RC. Distributed aberrators for emulation of ultrasonic pulse distortion by abdominal wall. Acoustics Research Letters Online. 2002;3(2):47–52. [Google Scholar]
- 46.Hinkelman LM, Liu D-L, Metlay LA, Waag RC. Measurements of ultrasonic pulse arrival time and energy level variations produced by propagation through abdominal wall. The Journal of the Acoustical Society of America. 1994;95(1):530–541. doi: 10.1121/1.408347. [DOI] [PubMed] [Google Scholar]
- 47.Sumino Y, Waag RC. Measurements of ultrasonic pulse arrival time differences produced by abdominal wall specimens. The Journal of the Acoustical Society of America. 1991;90(6):2924–2930. doi: 10.1121/1.401766. [DOI] [PubMed] [Google Scholar]
- 48.Walker WF, Trahey GE. Aberrator integration error in adaptive imaging. IEEE transactions on ultrasonics, ferroelectrics, and frequency control. 1997;44(4):780–791. doi: 10.1109/58.585209. [DOI] [PubMed] [Google Scholar]