Abstract
Mitochondria cannot be generated de novo; they must grow, replicate their genome, and divide in order to be inherited to each daughter cell during mitosis. Mitochondrial division is a structural challenge that requires a massive remodeling of membrane morphology 1–3. Although division factors differ across organisms, the need for multiple constriction steps and a dynamin-related protein (Drp1, Dnm1 in yeast) has been conserved 4–6. In mammalian cells, mitochondrial division has been shown to proceed with at least two sequential constriction steps: 1. endoplasmic reticulum (ER) and actin collaborate to generate constrictions suitable for Drp1 assembly; 2. Drp1 further constricts membranes until fission occurs 2,7–9. However, in vitro experiments argue that Drp1 does not have the dynamic range to complete membrane fission per se 7. In contrast to Drp1, the neuronal-specific classical Dynamin-1 (Dyn1) has been shown to assemble on narrower lipid profiles and facilitates spontaneous membrane fission upon GTP hydrolysis 10,11. Here we discovered that the ubiquitously-expressed classical Dynamin-2 (Dyn2) is a fundamental component of the mitochondrial division machinery. A combination of live-cell and electron microscopy reveals that Dyn2 works in concert with Drp1 to orchestrate sequential constriction events leading up to division. Our work underscores the biophysical limitations of Drp1 and positions Dyn2, which has intrinsic membrane fission properties, at the final step of mitochondrial division.
Mitochondria are organelles with ancestral roots to α-proteobacterium that have been adapted by eukaryotic cells to execute a broad range of cellular functions from ATP production to apoptosis 6,12. The divergence of mitochondria in higher order eukaryotes from those of primitive eukaryotes is marked by the loss of a functioning remnant of the bacterial cell division machinery, the FtsZ-ring 6. In contrast, the Dynamin family of large GTPases, which regulates membrane dynamics in all eukaryotes, expanded to accommodate the growing demands of more complex organisms 6,13. For example, mitochondria in mammalian cells have a set of dynamin-related proteins that regulate mitochondrial dynamics; Drp1 for fission, and mitofusins (Mfn1/2) and optic atrophy-1 (Opa1) for fusion 13. Despite an apparent drive toward the specialization of dynamins, the classical Dyn2 in mammalian cells, which is best known for its role in driving endocytosis at the plasma membrane (PM), is more promiscuous and facilitates membrane fission events at multiple organelles, while also mediating the final stages of cytokinesis 13. Thus, we explored the possibility that Dyn2 could play a role in mitochondrial dynamics.
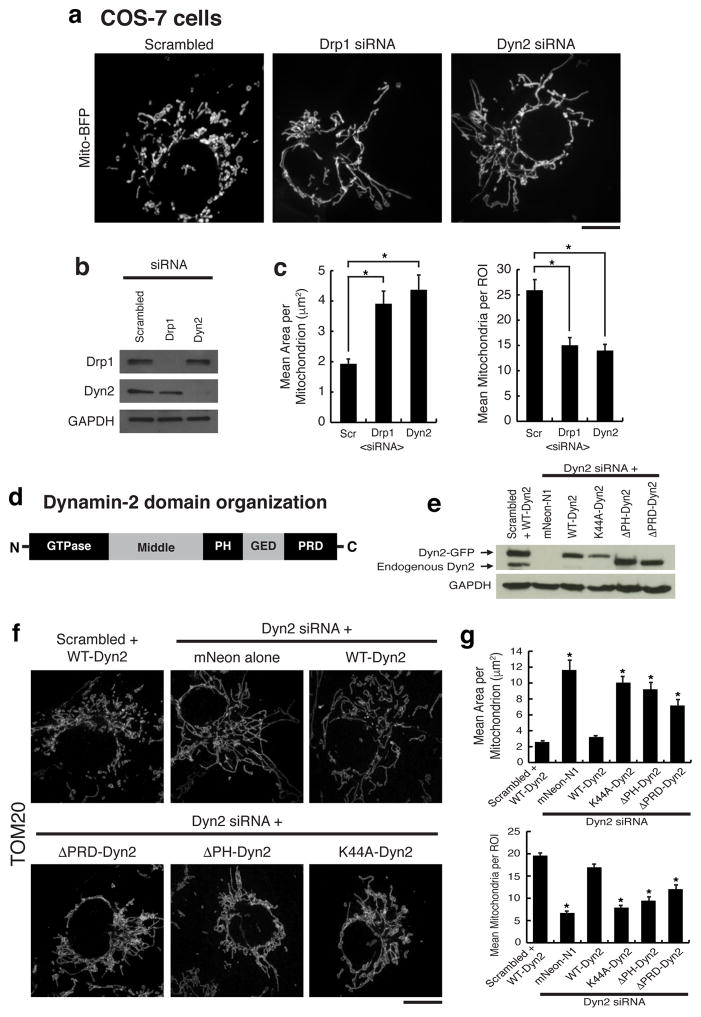
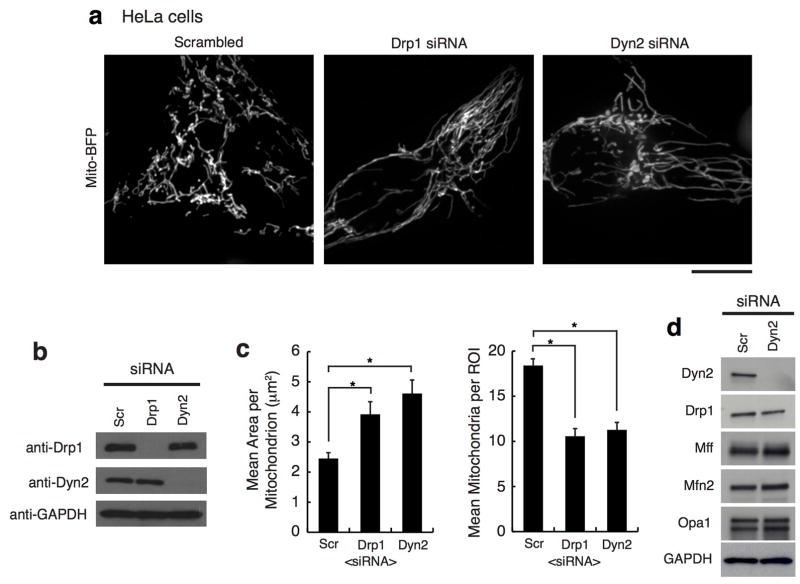
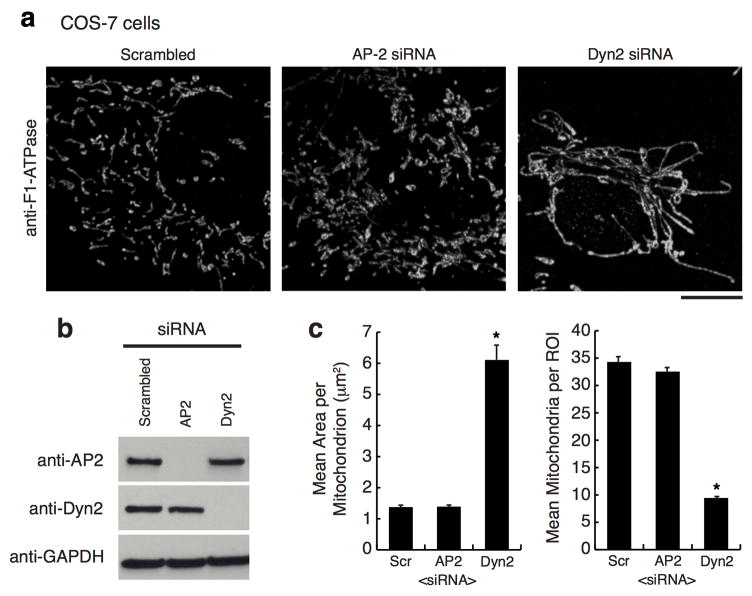
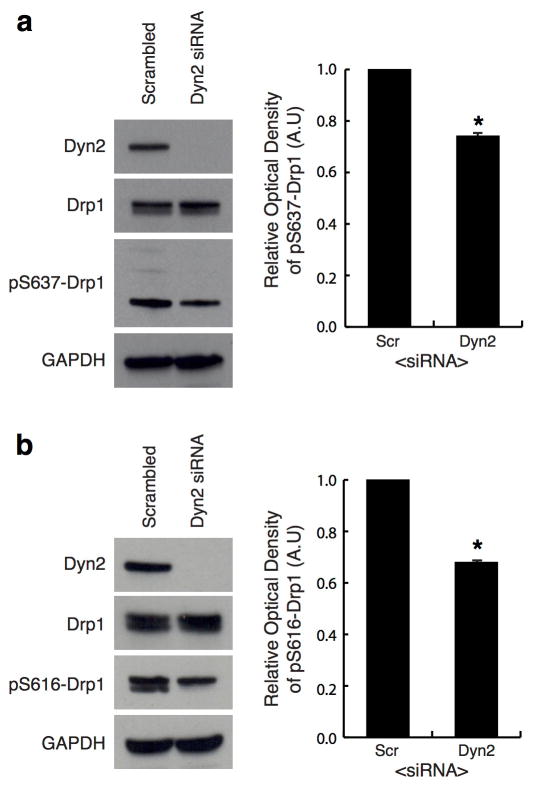
The depletion of Drp1 halts mitochondrial division and shifts dynamics towards fusion resulting in an elongated, hyperfused mitochondrial network 14. COS-7 and human HeLa cells were depleted of Dyn2 and compared to scrambled siRNA-treated (control) and Drp1-depleted cells (Fig. 1a, ED Fig. 1, respectively). Dyn2-depleted cells displayed a hyperfused mitochondrial network that was similar to mitochondria in Drp1-depleted cells (Fig. 1a–c). Dyn2 depletion did not affect the steady state levels of other fission and fusion factors, including Drp1, Mff, Opa1 or Mfn2 (ED Fig. 1d). We tested whether mitochondrial elongation was a secondary effect to blocking clathrin-mediated endocytosis (CME) by depleting an adaptor protein, AP-2, that is required for CME 13. AP-2 depleted cells displayed normal mitochondrial morphology (ED Fig. 2). Thus, the mitochondrial phenotype induced by Dyn2 depletion is not a consequence of inhibiting endocytosis. Alternatively, an endocytosis blockade could deplete nutrients from the cell. Therefore, we measured whether Dyn2 depletion triggers starvation-induced phosphorylation of Drp1 at serine637-Drp1 15. Dyn2 depletion slightly decreases phosphorylation at this inhibitory site, suggesting that it does not phenocopy the effects of starvation (ED Fig. 3a). We do measure a reduction in mitosis-induced phosphorylation at the activating serine616-Drp1 site 16, however this could be due to a Dyn2-dependent mitotic block 17 (ED Fig. 3b). Overall, these data are consistent with a direct role for Dyn2 in mitochondrial fission.
Figure 1. Dynamin-2 is required for mitochondrial division.
a, Representative images of mito-BFP in n = 42, 42, 43 cells for scrambled, Drp1, and Dyn2 siRNA cells, respectively. b, Immuno-blot of Drp1, Dyn2, and GAPDH in siRNA-treated cells. c, Mitochondrial morphology was quantitated for mean area per mitochondria and mean mitochondria per region of interest (ROI). d, The domain organization of Dynamin-2. e, Immuno-blot of endogenous and exogenous Dynamin expression levels in rescue experiments. f, Representative images of TOM20 immunofluorescence in n = 40, 40, 45, 40, 44, 41 cells transfected with scrambled siRNA+WT-Dyn2, Dyn2 siRNA+mNeon-N1, Dyn2 siRNA+variants (WT, K44A, ΔPH, ΔPRD), respectively. g, Mitochondrial morphology was assessed as in (c). (c,g) Error bars represent the standard error of the mean (s.e.m.). *p<0.01 statistical significance calculated by ANOVA and obtained from three biological replicate experiments. a,f, Scale bars = 10 μm.
Dyn2 and Drp1 have structural differences that translate into differences in behavior between the two proteins 18,19. Dyn2 has a Pleckstrin homology (PH) domain important for membrane insertion and a proline-rich domain (PRD) responsible for localization (Fig. 1d). Drp1 lacks both domains and instead requires an InsertB domain to interact with adaptors, such as Mff, which are responsible for recruiting Drp1 to mitochondria 19. To gain mechanistic insight into the relationship between Dyn2 and mitochondria, wild-type, the GTP-binding defective K44A mutant, PH deletion (ΔPH), and PRD deletion (ΔPRD) variants of Dyn2 were tested for their ability to rescue mitochondrial morphology post-Dyn2 depletion. Simultaneous depletion of endogenous Dyn2 and unabated expression of exogenous siRNA-resistant Dyn2-mNeon variants was verified by immunoblot analysis (Fig. 1e). Control cells expressing both endogenous Dyn2 and exogenous wild-type Dyn2-mNeon displayed normal mitochondrial morphology. In contrast, Dyn2 siRNA-treated cells expressing mNeon alone were depleted of Dyn2 and displayed predominantly long mitochondria. Expression of exogenous wild-type Dyn2, but not the K44A, ΔPH, ΔPRD mutants, was sufficient to reverse the elongated mitochondria phenotype that was induced by Dyn2 depletion. (Fig. 1f,g). Thus, the classical features of GTP binding, recruitment, and lipid association, which are essential for Dyn2 functions at other organelles 13, are also required for mitochondrial division.
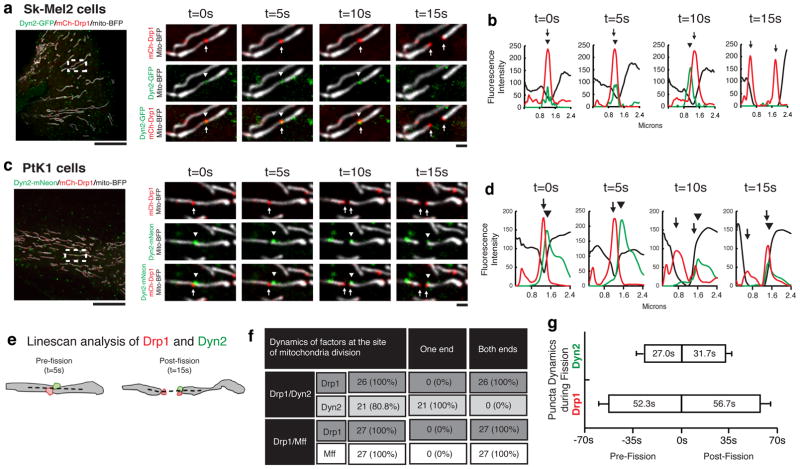
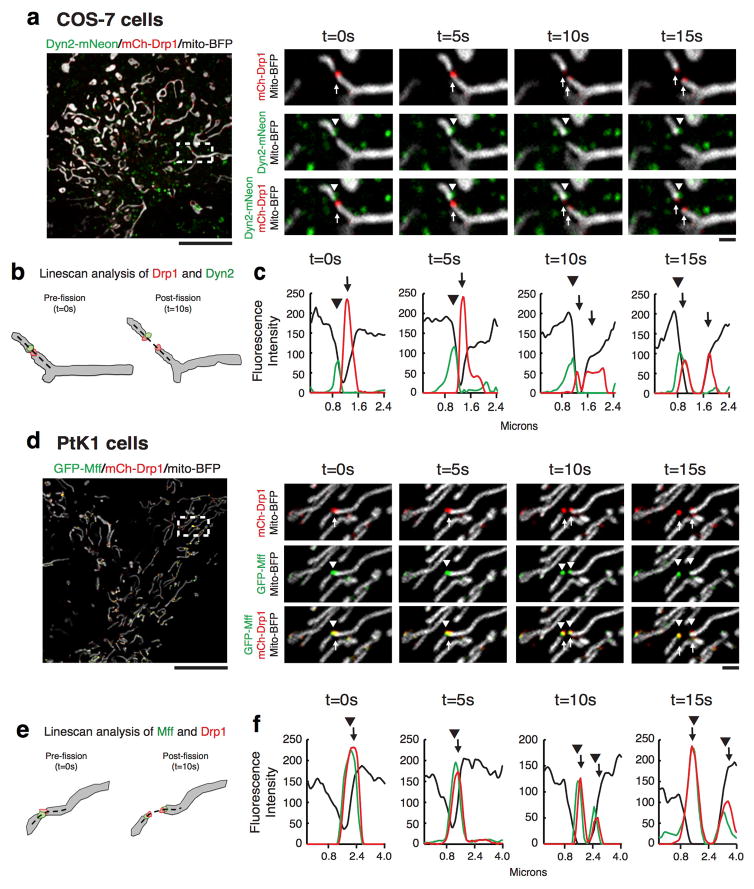
We next performed live-cell imaging of Dyn2 to observe whether Dyn2 might be recruited to Drp1-marked mitochondrial constrictions destined for division since classical Dyn1 can assemble on narrow tubules to drive their constriction and vesiculation in vitro10,11. Dyn2 was captured at Drp1-marked mitochondrial division events in genome-edited human skin melanoma cells (Sk-Mel2) expressing Dyn2-GFP under its endogenous promoter, and in COS-7 and PtK1 cells overexpressing Dyn2-mNeon (Fig. 2a,c, ED Fig. 4a, Videos 1–3). PtK1 cells are advantageous in that they lie flatter than Sk-Mel2 cells and mitochondria divide with greater frequency than in COS-7 cells. Thus, PtK1 cells were utilized to characterize the dynamics of Dyn2 and mitochondrial division factors, Mff and Drp1, during division (Fig. 2c–g, ED Fig. 4d–f). Dyn2 puncta were captured at 80.8% of Drp1-marked mitochondrial division events (n = 26 events from 254 cells; Fig. 2f). Additionally, Drp1 puncta were present at the division site for a longer period of time both pre-fission (52.33±7.14 s) and post-fission (56.67±7.83 s) compared to pre-fission (27±5.07 s) and post-fission (31.67±4.52 s) dynamics of Dyn2 puncta (Fig. 2g). The pre-fission lifetimes of Dyn2 puncta at mitochondria (Fig. 2g) are similar to reported Dyn2 dynamics during CME at the cell surface in genome-edited cell lines (16–32s) 20, which suggest similar mechanisms of Dyn2-mediated membrane scission at both organelles.
Figure 2. Dynamics of Dyn2 recruitment during mitochondrial division.
a,b, Mitochondrial division was imaged live in Sk-Mel2 (14 events from 144 cells). c,d, and PtK cells (26 events from 254 cells). Highlighted insets show the spatiotemporal dynamics of Drp1 (arrows) and Dyn2 (arrowheads) prior to and during mitochondrial division (a,c), Line-scan analysis of mean fluorescence intensity (MFI) verifying Drp1 and Dyn2 dynamics (b,d). e, A cartoon schematic depicts the frame prior to division that determines the presence of division factors (Dyn2 and Drp1) at the site of division, and the frame after division that determines the interactions of division factors with the ends of daughter mitochondria, which are summarized in f. The dashed line in (e) represents area analyzed by line-scan. g, Lifetimes of Drp1 and Dyn2 puncta on mitochondria before and after division were analyzed from 21 division events. Error bars represent s.e.m.. b,d, Scale bars for whole cell panels and the inset panel are 10 μm and 1 μm, respectively.
A comparison of Drp1 and Dyn2 dynamics leading up to, during, and following mitochondrial division uncovers differences in behavior between the two dynamins. Drp1 puncta accumulate at mitochondrial constrictions regardless of whether they are about to undergo fission while Dyn2 puncta are rarely found on mitochondria and appear to be recruited transiently just prior to division. Upon division, Drp1 puncta split to maintain association with each newly created daughter mitochondrion. Predictably for a Drp1 adaptor, Mff puncta mirror the behavior of Drp1 puncta during division (ED Fig. 4c–e). Conversely, Dyn2 puncta segregate to only one of the daughter mitochondria after division (Fig 2f,g). The differences in puncta dynamics between Drp1 and Dyn2 display a striking resemblance to the division machineries that collaborate to drive organelle division in Cyanidioschyzon merolae. C. merolae relies on sequential constriction events, first mediated by the cmFtsZ-ring machinery then by an organelle-specific dynamin, Drp1-related cmDnm1 and Dyn2-related cmDnm2, to divide mitochondria and chloroplasts, respectively 21,22. The behavior of cmFtsZ-ring puncta mirrors mammalian Drp1 puncta dynamics during mitochondrial division, whereas puncta of cmDynamins behave similarly to mammalian Dyn2 puncta 21,22. Taken together, these data support a direct role for Dyn2 in mitochondrial division that is downstream of Drp1 constriction.
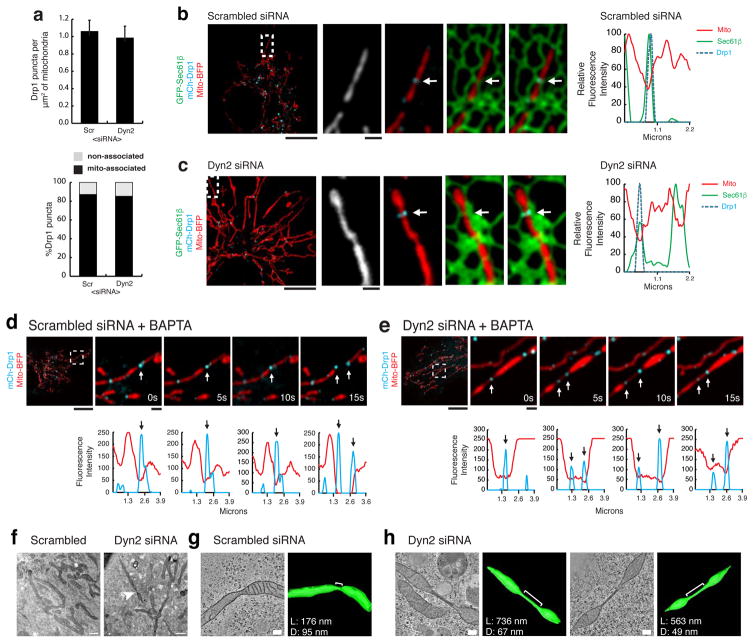
The transient appearance of Dyn2 puncta at Drp1-marked mitochondrial constrictions occurs just prior to division and suggests that Dyn2 functions downstream of Drp1. To test this further, we evaluated the occupancy of Drp1 puncta along mitochondria (puncta/μm2). The percentage of mitochondria-associated Drp1 puncta were not significantly different in control and Dyn2-depleted cells (Fig. 3a). The endoplasmic reticulum (ER)-marked mitochondrial constrictions have been identified as a pre-Drp1 step because these constrictions formed in the absence of Drp1 8. We could also qualitatively observe that Drp1 puncta (in cyan, middle panels) can still localize to ER-marked mitochondrial constrictions in Dyn2-depleted cells (Fig. 3b,c). Taken together, these data further support a role for Dyn2 in mitochondrial division that is downstream of Drp1 recruitment.
Figure 3. Dyn2 depleted cells reveal dynamic mitochondrial “super-constrictions”.
a, Mitochondrial-association of Drp1 puncta was analyzed. n = 12, 12 cells for scrambled and Dyn2 siRNA treatments, respectively. *p<0.01 statistical significance calculated by paired t-Test. Error bars represent s.e.m.. b,c Examples of Drp1-marked constrictions at ER-mitochondria contacts (arrows) in (b) scrambled (n = 12) or (c) Dyn2 siRNA-treated (n=12) cells. The MFI of each factor was derived from line-scans and plotted (graphs). d,e Representative images of scrambled (d, Video 4, 11 events from 31 cells) versus Dyn2 (e, Video 5, 10 events from 34 cells) siRNA-treated cells were captured following acute BAPTA-AM treatment. The MFI of Drp1 and mitochondria were derived from line-scans and plotted for each time-point (graphs). f, Representative electron micrographs of scrambled (n = 40 cells) and Dyn2 siRNA-treated (n = 53 cells) cells captured from serial thin-sections revealed severe mitochondrial constrictions (arrowhead) in Dyn2 siRNA-treated cells. g–h, Representative EM tomographs and corresponding 3D models of mitochondrial constrictions (<100 nm diameter) observed in (g) scrambled (4 constrictions from 12 sections) or (h) Dyn2 siRNA-treated (10 constrictions from 12 sections) cells. In control cells, the mean diameter (D) and length (L) are 77 ± 20 nm and 143 ± 61 nm, respectively. Mitochondrial constrictions in Dyn2-depleted cells displayed D = 55 ± 12 nm and L = 358 nm with a min/max = 145/771 nm. b–e, Scale bars for whole cell and inset panels are 10 μm and 1 μm, respectively. f, Scale bars = 1000 nm. g,h, Scale bars = 200 nm.
We envisioned that the division process in Dyn2 depleted cells would fail at a post-Drp1 step and this might lead to the accumulation of Drp1-marked stalled super-constrictions that are unable to divide. To test this hypothesis, we activated mitochondrial division in control and Dyn2-depleted cells by acute addition of the Ca2+ chelator, BAPTA-AM, which has been previously used to induce Drp1-dependent division 8. In control cells, BAPTA treatment induced Drp1-marked mitochondrial division with Drp1 splitting to maintain association with each daughter mitochondrion (Fig. 3d, Video 4). In contrast, BAPTA-treated Dyn2 depleted cells displayed Drp1-marked constrictions that appeared destined for mitochondrial division. In what appears to be failed division, line-scan analysis of these dynamic events identified a novel post-Drp1 intermediate “super-constriction” that can be described by the transient splitting of Drp1 puncta coupled with a coincidental increase in the length of a constriction along the longitudinal axis (Fig. 3e, Video 5). These data reveal the existence of a transient post-Drp1 super-constriction step that is positioned between Drp1 constriction and membrane fission and requires Dyn2 to move forward.
Compelling in vitro experiments highlighted the mechanical differences between Drp1 and classical Dynamin 7,10,11. Drp1 constricted liposomes to 31±5 nm whereas Dyn1 was shown to assemble on lipid tubules with a diameter of 52±4 nm and induce fission upon GTP hydrolysis 7,10. Additionally, super-resolution live-cell imaging studies have identified mitochondrial division intermediates as constrictions with extended length measurements (102±16 nm), however Drp1 was not captured in these studies 23. Our live-cell studies have seemingly captured and stalled Drp1-marked division intermediates by depleting Dyn2 under division-promoting conditions, which can be characterized as a transient splitting of Drp1 puncta that coincides with an increased constriction length (compare Fig 3d and 3e).
Next, we utilized electron microscopy and 3D tomography to obtain ultrastructural information about mitochondrial constrictions in Dyn2 depleted cells. Dual-tilt tomographs of control and Dyn2 siRNA-treated COS-7 cells were captured from 300 nm thick-sections and reconstructed to allow for precise measurements of the length and diameter of mitochondrial constrictions (Fig. 3f–h). We aimed to characterize mitochondrial constrictions with diameters suitable for Drp1 assembly (<100 nm) in scrambled- and Dyn2-siRNA cells, and could resolve four and ten mitochondrial constrictions that fit this criteria, respectively. The constrictions in scrambled-siRNA cells had a mean diameter = 77±20 nm and a mean length = 143±61 nm (Fig. 3g). In contrast, constrictions in Dyn2-siRNA cells were narrower (mean diameter = 55±12 nm) and longer (mean length = 358 nm with a min/max = 145/771 nm; Fig. 3h). Taken together, these data display stalled and elongated super-constrictions in Dyn2-depleted cells, which have diameters that could be generated by Drp1 GTP hydrolysis and are suitable for Dyn2 assembly 7,10,11. Therefore, we propose a sequential constriction model that includes multiple dynamins, whereby Drp1 constricts mitochondria to a diameter that is conducive for Dyn2 assembly to drive further membrane constriction and complete fission.
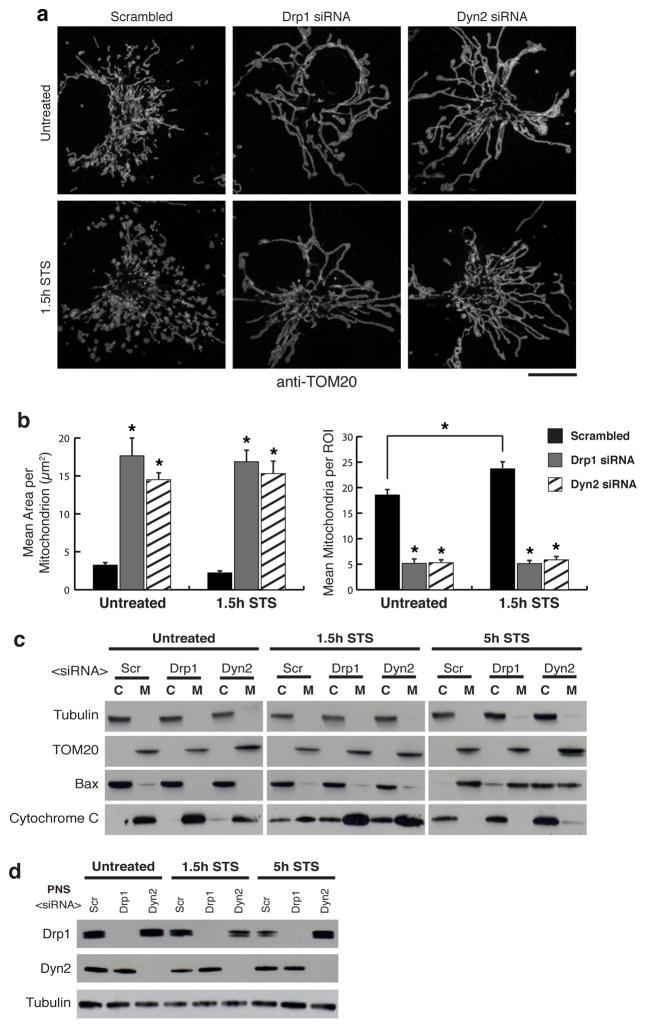
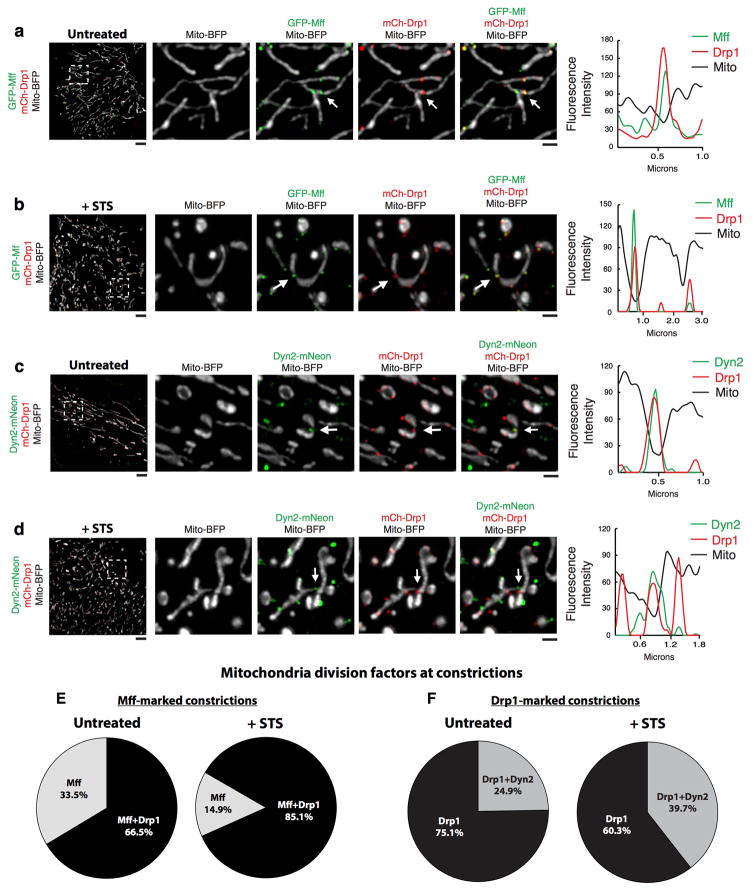
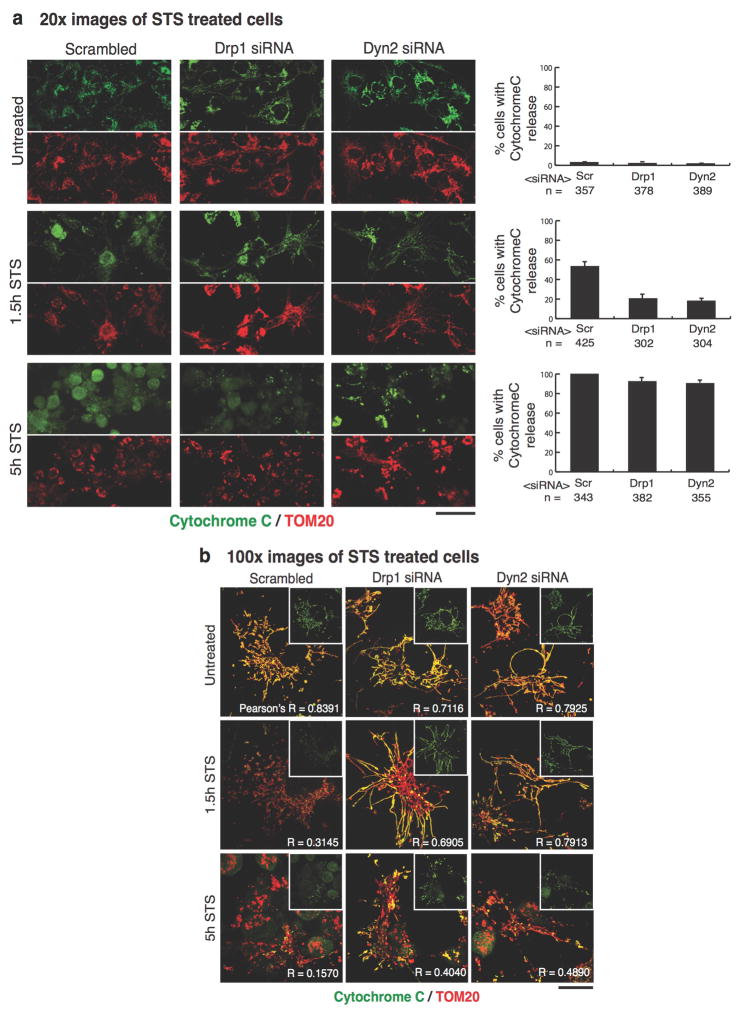
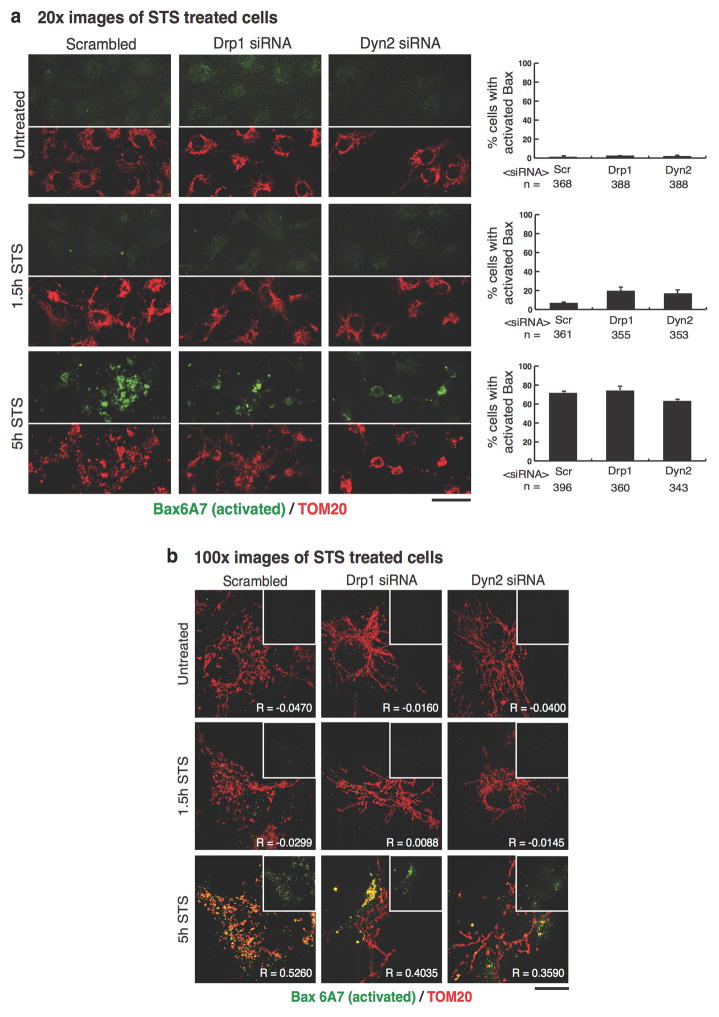
Mitochondria play a critical role in apoptotic cell death 12. Cells treated with staurosporine (STS), a global kinase inhibitor that induces apoptosis, exhibit Drp1-dependent mitochondrial fragmentation, cytochrome C release from and Bax recruitment to mitochondria 14,24. We found that mitochondrial constrictions display increased Drp1 localization to Mff-marked constrictions, as well as increased Dyn2 localization to Drp1-marked constrictions following STS treatment (ED Fig. 5). Furthermore, control cells treated with STS exhibited fragmented mitochondria, whereas Drp1- and Dyn2-depleted cells maintained an elongated mitochondrial network after 1.5 hours STS (Fig. 4a,b). Immunofluorescence and fractionation studies of cells treated with STS for 1.5 and 5 hours, showed that Drp1 or Dyn2 depletion delays the release of cytochrome C from mitochondria (Fig. 4c, ED Fig. 6); and slows the recruitment of Bax to mitochondria (Fig. 4c) despite accelerating Bax activation (ED Fig. 7). Thus, Dyn2 also plays a critical role in apoptosis-induced Drp1-dependent mitochondrial fragmentation and supports the hypothesis that Drp1 and Dyn2 work in the same pathway at mitochondria.
Figure 4. Dynamin-2 is required for STS-induced mitochondrial fragmentation.
a, Representative images of TOM20 immunofluorescence in n = 41/42, 45/43, 45/43 scrambled, Drp1, Dyn2 siRNA cells (without/with 1.5 hour STS treatment), respectively. Scale bars = 10 μm. b, Mitochondrial morphology was quantitated for mean area per mitochondria, and mean mitochondria per ROI.. Error bars represent s.e.m.. *p<0.01 statistical significance calculated by ANOVA and obtained from three biological replicate experiments c, Cytochrome C release and Bax recruitment were evaluated by immuno-blot of cytosol/membrane fractions. a-Tubulin verified cytosolic fractions and TOM20 verified membrane fractions. d, Drp1 and Dyn2 depletion were confirmed by immuno-blot of post-nuclear supernatants (PNS).
Our results showing that mitochondrial division is a Dyn2-dependent process highlights a conserved overlap of dynamins with roles at both mitochondria and PM. Previous studies in C. merolae and other organisms have suggested that mitochondrial dynamins in other organisms have a dual role in mitochondrial division and endocytosis 6,21,25. Deletion of the only dynamin in Trypanosoma brucei caused defects in mitochondrial division, endocytosis, and cytokinesis 25. This versatility has been preserved in mammalian Dyn2, which has already been shown to function in endocytosis and cytokinesis 13,17. Dyn2 is recruited to endocytic sites by SH3-domain proteins; and once there, the combined affinity of Dyn2 for membrane curvature 11,18 and anionic phospholipids 26, specifically PI(4,5)P2, accelerates its assembly into a functional fission machine. Adaptor proteins and lipid environments also play significant roles in mitochondrial dynamics 27–29. Future studies will be aimed at identifying the recruitment factors and mitochondrial lipid interactions of Dyn2.
Taken together, we propose that mammalian mitochondrial division has integrated several machineries, which proceed in multiple constriction steps: 1. ER and actin-driven constrictions permit Drp1 assembly; 2. Drp1-mediated constriction facilitates Dyn2 assembly; 3. Dyn2-mediated constriction induces membrane fission to complete division.
Experimental Procedures
DNA plasmids and small interfering RNA oligonucleotides
GFP-Sec61β 8, mCh-Drp1 isoform 3 (NM_005690) 8, GFP-Mff (NM_020194) 8 and Mito-BFP 8 were previously described. Dynamin-2 isoform 3 (NM_004945) was cloned from HeLa cDNA and inserted into the XhoI/EcoRI sites of the pAcGFP-N1 (Clontech, Mountain View, CA) and pmNeonGreen-N1 to make Dyn2-GFP and Dyn2-mNeon, respectively. Site-directed mutagenesis was used to generate six silent mutations per siRNA seed region in Dyn2-mNeon to create a siRNA-resistant Dyn2-mNeon message that translates wild-type Dyn2-mNeon. Subsequent site-directed mutagenesis reactions were performed to generate siRNA-resistant dominant-negative K44A-Dyn2-mNeon. The siRNA-resistant ΔPH-Dyn2-mNeon mutant was constructed by first, linearizing the siRNA-resistant Dyn2-mNeon by PCR with primers that exclude the PH domain sequence, followed by Gibson assembly to circularize the construct. The siRNA-resistant ΔPRD-Dyn2-mNeon mutant was constructed by PCR amplification of siRNA-resistant Dyn2-mNeon with primers that exclude the C-terminal proline-rich domain, then digested with XhoI/KpnI and ligated into the mNeon-N1 vector.
Oligonucleotides for Drp1 siRNA were synthesized by Qiagen (SI02661365) against the target sequence: 5′-CAGGAGCCAGCTAGATATTAA-3′. A pool of two siRNAs was used to significantly deplete Dyn2. Two oligonucleotides for Dyn2 siRNA were synthesized by GE Healthcare Dharmacon (Lafayette, CO) against the two target sequences, Dyn2 siRNA#1 (J-004007-06-0005): 5′-GAGCGAATCGTCACCACTT-3′ and Dyn2 siRNA#2 (J-004007-08-0005): 5′-GAGCGAATCGTCACCACTT-3′. Silencer Negative Control #1 siRNA (AM4635) was synthesized by Ambion (Grand Island, NY). Oligonucleotides for AP-2 siRNA were received as a gift from S.M.DiPietro from Colorado State University against the target sequence: 5′-GAGCATGTGCACGCTGGCCAGCT-3′.
Cell culture, transfection, and drug treatment
Genome-edited Dyn2-GFP skin melanoma cells (Sk-Mel2/Dyn2-GFP) were gift from D.G. Drubin. COS-7 cells (ATCC-CRL-1651), HeLa cells (ATCC-CCL-2), PtK1 cells (ATCC-CRL-6493) were verified by cytochrome c oxidase subunit I (CO1) interspecies assay, whereas CCL-2-HeLa cells were further verified by short tandem repeat (STR) testing. Cell lines were tested for Mycoplasma contamination by ATCC at the time of purchase. Cells were grown in Dulbecco’s modified Eagle medium (DMEM) supplemented with 10% fetal bovine serum (FBS) and 1% penicillin/streptomycin. COS-7, HeLa, and PtK1 cells were seeded on plastic bottom dishes at 1×10⁵ cells/mL about 16 hours prior to transfection, whereas Sk-Mel2/Dyn2-GFP cells were plated directly onto 35 mm glass-bottom microscope dishes (Mattek) at 0.5×10⁵ cells/mL about 40 hours prior to transfection. Plasmid transfections were performed with 2.5 μL of Lipofectamine 2000 or 3000 (Invitrogen) per 1 mL of in OPTI-MEM media (Invitrogen) for ~5 hours followed by splitting of COS-7, HeLa, and PtK1 cells to 35 mm glass-bottom microscope dishes (MatTek) at a density of 1×10⁵ cells/mL. Roughly 16–24 hours after transfection, cells were imaged in pre-warmed 37°C Fluorobrite DMEM (Invitrogen) supplemented with 10% FBS.
For all experiments, the following amounts of DNA were transfected per mL: 150 ng GFP-Sec61β; 40 ng mito-BFP; 40 ng mCh-Drp1; 50 ng Dyn2-GFP variants; 25 ng Dyn2-mNeon; 40 ng GFP-Mff. RNAi transfections were performed as above, except with an additional transfection step; cells were seeded as above and transfected with 2.5 μL Dharmafect (Dharmacon) and 40 nM siRNA oligonucleotides, split 1:2 ~24 hours post-transfection, and re-transfected ~24 hours later with 5 μL Lipofectamine 2000, 40 nM siRNA oligonucleotides, and appropriate plasmid DNA. For knockdown and rescue studies, COS-7 cells were transfected with Dyn2 siRNA to deplete endogenous Dyn2 mRNA. A second round of transfection was performed two days later with Dyn2 siRNA and DNA plasmids encoding mNeon alone or siRNA-resistant variants of Dyn2-mNeon. Simultaneous depletion of endogenous Dyn2 and unabated expression of exogenous siRNA-resistant Dyn2-mNeon variants was verified by immunoblot analysis.
In BAPTA experiments, cells were treated with 10 μM BAPTA-AM (Calbiochem) in Fluorobrite DMEM during imaging at 37°C. In STS treatments, cells were first treated with the caspase inhibitor, 75 μM z-VAD-fmk (BD Biosciences), for 4 hours followed by 1 μM staurosporine (Sigma-Aldrich) for 1.5 or 5 hours followed by fractionation or fixation with 4% paraformaldehyde, 0.5% glutaraldehyde in PBS in preparation for immunofluorescence. For fractionation experiments, cells were harvested from 10 cm plates, washed with ice-cold PBS, and resuspended in 1 mL of isolation buffer (IB) containing 225 mM mannitol, 75 mM sucrose, 30 mM Tris-HCl pH7.4, 0.1 mM EGTA. The plasma membrane was ruptured by dounce homogenization. Cell lysates were spun at 600 g for 5 minutes at 4°C to pellet and remove nuclei/debris. The post-nuclear supernatant (PNS) was collected and spun at 100k g to pellet membranes. The 100k supernatant was collected and represented the cytosolic fraction. The 100k pellet (membrane fraction) and was resuspended in solubilization buffer containing 50 mM HEPES, 2.5 mM MgCl2, 200 mM KCl, 5% glycerol, 1% Triton X-100. Cytosolic and membrane fractions were then treated with trichloroacetic acid (TCA) to precipitate proteins, which were then resuspended in equal volumes of 2x Laemmli buffer.
Protein levels in whole-cell lysates and cell fractions were assayed by Western blot with polyclonal rabbit antibodies against Dyn2 (ab3457, Abcam), phosphoSerine637-Drp1 (4867S, Cell Signaling Tech), phosphoSerine616-Drp1 (3455S, Cell Signaling Tech), Mff (17090-1-AP, Protein Tech), Mfn2 clone 4H8 (WH0009927M3, Sigma-Aldrich), α-Tubulin (ab18251, Abcam), TOM20 (sc-11415, Santa Cruz Biotech), Bax (sc-493, Santa Cruz Biotech), GAPDH (G9545, Sigma-Aldrich), and the monoclonal mouse antibody against AP-1/2 (sc-17771, Santa Cruz Biotech.), Drp1 (ab56788, Abcam), Dynamin (610245, BD Biosciences), cytochrome C (sc-13560, Santa Cruz Biotech), Opa1 (612606, BD Biosciences). Immunofluorescence was accomplished using monoclonal antibodies against cytochrome C clone 6H2.B4 (12963S, Cell Signaling Tech) and Bax6A7 (B8429, Sigma Aldrich), and the polyclonal rabbit antibody against TOM20 (sc-11415, Santa Cruz Biotech).
Microscopy
Imaging was performed with an inverted fluorescence microscope (TE2000-U; Nikon) equipped with an electron-multiplying charge-coupled device camera (Cascade II; Photometrics) and a Yokogawa spinning disc confocal system (CSU-Xm2; Nikon). Live-cell imaging was performed at 37°C. Images were captured with a 100x NA 1.4 oil objective and acquired using MetaMorph (version 7.0; MDS Analytical Technologies).
Super-resolution microscopy (SIM) was performed with an inverted fluorescence microscope (TI-E; Nikon) equipped with an electron-multiplying charge-coupled device camera (iXon3 897; Andor). Z-stack images were captured every 200 nm and reconstructed using NIS elements with SIM (Nikon).
Analyses of mitochondrial morphology
COS-7 and HeLa cells were treated with siRNA to deplete targeted proteins, and then mitochondria were imaged either live with mito-BFP or fixed with immunofluorescence of polyclonal rabbit TOM20 antibody (sc-11415, Santa Cruz Biotechnologies) probed with Alexafluor 488 donkey anti-rabbit antibody (A21206, Invitrogen). To ensure that mitochondria present through multiple planes of the cell could be assayed, Z-stacks with a thickness of 2.4 μm were acquired of each cell, and consisted of twelve serial images that were each spaced by 0.2 μm. The morphology of mitochondria within a resolvable 230 μm2 ROI, which was peripheral to the microtubule-organizing center, was assessed using various tools in ImageJ (National Institutes of Health). First, maximum intensity projections were generated from Z-stacks followed by automated 8-bit Otsu Thresholding. Lastly, thresholded images were evaluated using the Analyze Particles function in ImageJ to obtain the number of mitochondrial fragments and the area of each fragment per ROI.
Capturing mitochondrial division and analyzing mitochondrial constrictions
Dynamic events and interactions, such as mitochondrial division and constriction, were imaged live with fluorescently tagged proteins. Time-lapse videos were acquired over the course of 2 minutes with each channel captured every 5 seconds. Exposure times ranged between 200–300 ms in each channel. Dyn2-GFP, Dyn2-mNeon, GFP-Mff, mCh-Drp1, and mito-BFP were imaged in mitochondrial division studies. Drp1-dependent fission events were resolvable when the splitting of a mitochondrion into two distinct mitochondria coincided with the splitting of a Drp1 puncta, which results in Drp1 puncta labeling the ends of each fission product. Division events were further verified by line-scan analysis using ImageJ. A segmented line was drawn along the length of the mitochondria, and then the fluorescence intensity of all channels was measured along the length of the line.
COS-7 cells expressing GFP-Sec61β, mCh-Drp1, and mito-BFP were used to investigate mitochondrial constrictions. The diffuse cytosolic staining of Drp1 was threshold-adjusted from punctate Drp1 using the rolling ball background subtraction method (radius = 8 pixels or 0.304mm) 30. Mitochondrial-associated Punctate Drp1 were identified using the Colocalization Highlighter ImageJ plugin, then counted using the Analyze Particles function in ImageJ. The occupancy of Drp1 puncta along mitochondria (puncta/μm2) and the percentage of mitochondria-associated Drp1 puncta were quantitated. Qualitatively, ER-marked constrictions were analyzed with line-scans that were performed in ImageJ. ER-marked constrictions were identified by acute decreases in mito-BFP fluorescence that coincided with GFP-Sec61β and/or mCh-Drp1 fluorescence peaks. An additional criteria used to identify constrictions in time-lapse videos was to observe whether the intersection of these two organellar markers was dynamically linked in movement.
Mitochondrial-associated Punctate Drp1 were identified using the Colocalization Highlighter ImageJ plugin, then counted using the Analyze Particles function in ImageJ. The occupancy of Drp1 puncta along mitochondria (puncta/μm2) and the percentage of mitochondria-associated Drp1 puncta were quantitated. Qualitatively, ER-marked constrictions were analyzed with line-scans that were performed in ImageJ. ER-marked constrictions were identified by acute decreases in mito-BFP fluorescence that coincided with GFP-Sec61β and/or mCh-Drp1 fluorescence peaks. An additional criteria used to identify constrictions in time-lapse videos was to observe whether the intersection of these two organellar markers was dynamically linked in movement.
Electron Microscopy
Sapphire Disks (3mm × 0.05 mm, Swiss Micro Technology) were used as a platform to grow cells and were coated with carbon and overlaid with a gold finder pattern using EMS950X Turbo Evaporator (Electron Microscopy Sciences, EMS) as described previously 31. Discs were coated with poly-l-lysine (Sigma, 0.01% solution), air-dried then glow discharged (EMITECH Ltd model K 100x Glow Discharge) and immobilized to the bottom of 35 mm tissue culture dishes with 10 ul of poly-l-lysine that was allowed to dry prior to ultraviolet radiation.
Cells were transfected with siRNA as described above and plated (1×10⁵ cells/mL) on sapphire discs 24 hours prior to freezing. Discs were removed from culture, swirled in a cryo-protectant medium (DMEM, 10% FBS, 150 mM mannitol, and 2% sucrose) and transferred to aluminum freezing planchettes (Wohlwend, Switzerland) that were coated with hexadecane (Sigma), then rapidly frozen using the Wohlwend Compact 02 High pressure freezer. The frozen discs were kept in liquid nitrogen until transferred into cryo-tubes (Nalgene-Nunc) for freeze substitution in 1% osmium tetroxide, 0.1% uranyl acetate (UA), and 2% water in glass-distilled acetone (EMS). The tubes were then transferred to an aluminum block pre-chilled to −80°C and gradually warmed to −30 °C overnight (~16 hrs) in a −30 °C freezer and then warmed to room temperature (~4 hrs). The samples were washed 3x with acetone (glass distilled, EMS). Following the 3rd wash, discs were oriented cell side up and covered in 25% epon-araldite resin in acetone (EMS). Cells were gently infiltrated in increasing concentrations of Epon-araldite resin (25% for 4 hrs, 50% for 12–16 hrs, 75% for 16 hrs, and 100% for 24 hrs). Finally, discs were changed into a solution of 100% epon-araldite plus accelerator (DMP-30) before being placed in mounting chambers and polymerized at 60°C for 48hrs 31,32.
Embedded cells were re-mounted onto resin stubs and sectioned at 70 or 300 nm thickness (thin section or tomography respectively), then collected onto a formvar coated slot grid and post stained using 2% UA in water (8 min) and Reynolds lead citrate (3 min) as described previously 31–33. Fiducial markers (BB International) for tomography were added by placing both sides of grids on a drop of 15nm gold colloid solution. Cellular regions were selected and imaged with a Tecnai T12 Spirit 120 kV for 70 nm sections. For tomography, 300 nm sections were imaged on the Tecnai TF30 300 kV. Dual axis tilts ±60° in increments of 1.5° were recorded around the orthogonal axes. Serial EM was used for image acquisition and each tilt series was reconstructed using the IMOD software 34–36. Tomographic reconstructions were modeled by manual contour tracing using IMOD and constriction length and width measurements were taken at the widest view of the constriction using slicer (IMOD) which allows for manipulation of the reconstruction in the x, y and z dimensions.
Data Availability
The source data for all gels and blots are provided as a supplementary figure in the online version of the paper. All other data that support the findings of this study are available from the authors upon reasonable request.
Extended Data
Extended Data Figure 1. Dynamin-2 is required for mitochondrial division.
a, Representative images of HeLa cells expressing mito-BFP that were transfected with scrambled control, Drp1, or Dyn2 siRNA. n = 36 cells for each siRNA treatment. Scale bars = 10 μm. b, Immuno-blots with antibodies against Dyn2, Drp1, and GAPDH in siRNA-treated cells. c, The effect on mitochondrial morphology was quantitated within a 230 μm2 region of interest (ROI) for mean area per mitochondria (left graph), and mean mitochondria per ROI (right graph). Similar to COS-7 cells, Drp1 or Dyn2–depleted cells had larger mitochondria and less mitochondrion per ROI compared to control cells. These data were obtained from three biological replicate experiments; each for scrambled siRNA, Drp1 siRNA, Dyn2 siRNA treatments. Error bars represent the the standard error of the mean (s.e.m). *p<0.01 statistical significance via analysis by ANOVA. d, Immuno-blot analyses were performed on scrambled siRNA and Dyn2 siRNA treated cell lysates with antibodies against Dyn2, GAPDH, and mitochondrial fission (Drp1, Mff) and fusion (Mfn2, Opa1) machineries.
Extended Data Figure 2. Inhibition of clathrin-mediated endocytosis does not affect mitochondrial morphology.
a, Representative images of TOM20 immunofluorescence in n = 50, 50, 52 COS-7 cells transfected with scrambled control, AP-2, or Dyn2 siRNA. Scale bars = 10 μm. b, Immuno-blots with antibodies against AP-2, Dyn-2, and GAPDH in siRNA-treated cells. c, The effect on mitochondrial morphology was quantitated within a 230 μm2 region of interest (ROI) for mean area per mitochondria (left graph), and mean mitochondria per ROI (right graph). As in Figure 1, Dyn2–depleted cells had larger mitochondria and less mitochondrion per ROI compared to control cells; however, AP-2 depleted cells displayed mitochondrial morphology that was qualitatively and quantitatively similar to control cells. These data were obtained from three biological replicate experiments. Error bars represent the s.e.m. *p<0.01 statistical significance via analysis by ANOVA.
Extended Data Figure 3. Dyn2 depletion does not phenocopy starvation-induced inhibition of Drp1.
a,b, The phosphorylation status of Drp1 was evaluated by immunoblot on whole-cell lysates in scrambled and Dyn2 siRNA-treated cells using antibodies against (a) phosphoserine637-Drp1 and (b) phosphoserine616-Drp1. Antibodies against Drp1 and Dyn2 were used to measure total Drp1 and Dyn2 levels, respectively, and anti-GAPDH was used as a loading control. The optical densities of phosphorylated-serine Drp1 signal were normalized to their corresponding GAPDH signal (graphs in a,b). The data represented in graphs for both (a) and (b) were obtained from three biological replicate experiments. Error bars represent the s.e.m. *p<0.01 statistical significance via analysis by paired t-Test.
Extended Data Figure 4. Live-cell imaging of mitochondrial division machinery before, during, and after division.
a, Representative example of mitochondrial division (6 events from 108 cells) in COS-7 cells expressing mito-BFP (gray), mCh-Drp1 (red), and Dyn2-mNeon (green) (Video 2). The highlighted insets show the temporal and spatial dynamics of Drp1 (arrows) and Dyn2 (arrowheads) prior to and during mitochondrial division. Scale bars for whole cell panels and the inset panel are 10 μm and 1 μm, respectively. b, The cartoon schematic identifies two temporal moments of interest with respect to Drp1, Dyn2, and mitochondrial dynamics, the frame prior to and the frame after division, with a dashed line that identifies the region that was analyzed by line-scan. c, Line-scan analysis of Drp1 and Dyn2 leading up to and following mitochondrial division. d, Representative example mitochondrial division (27 events from 49 cells) in PtK1 cells expressing mito-BFP (gray), mCh-Drp1 (red), and GFP-Mff (green). The highlighted insets show the temporal and spatial dynamics of Drp1 (arrows) and Mff (arrowheads) prior to and during mitochondrial division. Scale bars for whole cell panels and the inset panel are 10 μm and 1 μm, respectively. e, A cartoon schematic identifies the two temporal moments of interest with respect to Mff, Drp1, and mitochondrial dynamics. F, Line-scan analysis of Mff and Drp1 leading up to and following mitochondrial division. Note, that the interaction between Drp1 and its adaptor, Mff, is maintained throughout the process of mitochondrial division, in contrast, Dyn2 associates with only one daughter mitochondrion.
Extended Data Figure 5. STS treatment stalls division factors at mitochondrial constrictions.
a–d, Structure illumination microscopy was used to capture images of PtK1 cells expressing mCh-Drp1 (red), mito-BFP (gray), and either GFP-Mff (a–b, green, n = 10/12 cells) or Dyn2-mNeon (c–d, green, n = 13/13 cells) that were untreated/treated with 1 μM staurosporine (STS). The effect of STS treatment on division machinery localization was scored by line-scan analyses. Line-scan analysis verified the co-localization of Drp1 at Mff-marked constrictions (a–b) and Dyn2 at Drp1-marked constrictions (c–d). Under steady-state conditions, 66.5% of Mff-marked constrictions co-labeled with Drp1 (336 out of 505 Mff-marked constrictions), whereas STS treatment increased the co-localization of Drp1 with Mff-marked constrictions to 85.1% (538 out of 632 Mff-marked constrictions) e, Only 24.9% of Drp1-marked constrictions were co-labeled with Dyn2 in untreated cells (128 out of 514 constrictions). Furthermore, the co-localization of Dyn2 to Drp1-marked constrictions increased to 39.7% following STS treatment (140 out of 353 Drp1-marked constrictions) f, Taken together, STS treatment results in an increase of Drp1 at Mff-marked constrictions as well as an increase in Dyn2 localization to Drp1-marked constrictions. Scale bars for whole cell panels and the inset panel are 10 μm and 1 μm, respectively.
Extended Data Figure 6. Drp1 and Dyn2 depletion delays cytochrome C release from mitochondria after STS treatment.
Scrambled-, Drp1-, and Dyn2-siRNA cells were first treated with 75 μM zVAD-fmk for 4 hr, then either left untreated or treated with STS for 1.5 or 5 hr. Cells were then fixed with 4% paraformaldehyde, permeabilized with 0.1% Triton X-100, and immuno-labeled with cytochrome C in green, and TOM20 to stain mitochondria in red. a, 20x images were captured and the percentage of cells displaying cytochrome C release was scored. n = the total number of cells scored. Error bars represent the s.e.m.. Scale bars = 50 μm. b, 100x images were captured to spatially resolve the subcellular localization of cytochrome C. The main panel displays a merged image of cytochrome C/TOM20 and a single channel image of cytochrome C in the inset. The co-localization of cytochrome C with mitochondria was analyzed using the coloc2 ImageJ plugin, and the mean Pearson’s R coefficient is displayed in the bottom-right corner of each image. n = 40 cells/condition. Scale bars = 10 μm. These data were obtained from three biological replicate experiments.
Extended Data Figure 7. Bax activation is accelerated in Drp1 and Dyn2 depleted cells following STS treatment.
Scrambled-, Drp1-, and Dyn2-siRNA cells were treated and fixed as in Extended Data Figure 6, then immuno-labeled with an antibody targeting activated Bax (Bax6A7) in green, and TOM20 to stain mitochondria in red. A, 20x images were captured and the percentage of cells displaying Bax activation was scored. n = the total number of cells scored. Error bars represent the s.e.m.. Scale bars = 50 μm. b, 100x images were captured to spatially resolve the subcellular localization of activated Bax. The main panel displays a merged image of activated Bax/TOM20 and a single channel image of activated Bax in the inset. The co-localization of activated Bax with mitochondria was analyzed using the coloc2 ImageJ plugin, and the mean Pearson’s R coefficient is displayed in the bottom-right corner of each image. n = 40 cells/condition. Scale bars = 10 μm. These data were obtained from three biological replicate experiments.
Supplementary Material
Acknowledgments
We thank C. Ozzello for sectioning cells for EM analyses; A. Cheng, J. Ryoo and D.G. Drubin for providing the genome-edited Dyn2-GFP Sk-Mel2 cell line; and J.R. Friedman, D. Dambournet, and K.C. Cook for critical reading of the manuscript; and A. Hoenger and M. West for helpful discussions. Electron microscopy was done at the University of Colorado, Boulder EM services core facility. SIM in MCDB was made possible by equipment supplements to R01 GM79097 (D. Xue, PI) and P01 GM105537 (M. Winey, PI). This work is supported by grants from the National Institutes of Health to G.K.V (GM083977), J.E.L. (F32CA174158), L.M.W. (F32GM116371) and to H.W. (T32GM08759).
Footnotes
Author Contributions
J.E.L. and G.K.V. contributed to experimental design. L.M.W. and C.P. performed the experiments in Fig. 3f–h; H.W. performed the experiments in ED Fig. 4c–e; J.E.L. conducted the remainder of the experiments, data analysis, and figure composition. J.E.L. and G.K.V. wrote the manuscript. The authors declare no competing financial interests.
References
- 1.Goldstein S, Moerman EJ, Porter K. High-voltage electron microscopy of human diploid fibroblasts during ageing in vitro. Morphometric analysis of mitochondria. Exp Cell Res. 1984;154:101–11. doi: 10.1016/0014-4827(84)90671-2. [DOI] [PubMed] [Google Scholar]
- 2.Legesse-Miller A, Massol RH, Kirchhausen T. Constriction and Dnm1p recruitment are distinct processes in mitochondrial fission. Mol Biol Cell. 2003;14:1953–63. doi: 10.1091/mbc.E02-10-0657. [DOI] [PMC free article] [PubMed] [Google Scholar]
- 3.Kim HW, et al. Efficient and accurate analysis of mitochondrial morphology in a whole cell with a high-voltage electron microscopy. J Electron Microsc (Tokyo) 2012;61:127–31. doi: 10.1093/jmicro/dfs001. [DOI] [PubMed] [Google Scholar]
- 4.Otsuga D, et al. The dynamin-related GTPase, Dnm1p, controls mitochondrial morphology in yeast. J Cell Biol. 1998;143:333–49. doi: 10.1083/jcb.143.2.333. [DOI] [PMC free article] [PubMed] [Google Scholar]
- 5.Smirnova E, Griparic L, Shurland DL, van der Bliek AM. Dynamin-related protein Drp1 is required for mitochondrial division in mammalian cells. Mol Biol Cell. 2001;12:2245–56. doi: 10.1091/mbc.12.8.2245. [DOI] [PMC free article] [PubMed] [Google Scholar]
- 6.Purkanti R, Thattai M. Ancient dynamin segments capture early stages of host-mitochondrial integration. Proc Natl Acad Sci U S A. 2015;112:2800–5. doi: 10.1073/pnas.1407163112. [DOI] [PMC free article] [PubMed] [Google Scholar]
- 7.Yoon Y, Pitts KR, McNiven MA. Mammalian dynamin-like protein DLP1 tubulates membranes. Mol Biol Cell. 2001;12:2894–905. doi: 10.1091/mbc.12.9.2894. [DOI] [PMC free article] [PubMed] [Google Scholar]
- 8.Friedman JR, et al. ER tubules mark sites of mitochondrial division. Science. 2011;334:358–62. doi: 10.1126/science.1207385. [DOI] [PMC free article] [PubMed] [Google Scholar]
- 9.Prudent J, McBride HM. Mitochondrial Dynamics: ER Actin Tightens the Drp1 Noose. Curr Biol. 2016;26:R207–R209. doi: 10.1016/j.cub.2016.01.009. [DOI] [PubMed] [Google Scholar]
- 10.Sweitzer SM, Hinshaw JE. Dynamin undergoes a GTP-dependent conformational change causing vesiculation. Cell. 1998;93:1021–9. doi: 10.1016/s0092-8674(00)81207-6. [DOI] [PubMed] [Google Scholar]
- 11.Roux A, et al. Membrane curvature controls dynamin polymerization. Proc Natl Acad Sci. 2010;107:4141–4146. doi: 10.1073/pnas.0913734107. [DOI] [PMC free article] [PubMed] [Google Scholar]
- 12.Wang C, Youle RJ. The role of mitochondria in apoptosis*. Annu Rev Genet. 2009;43:95–118. doi: 10.1146/annurev-genet-102108-134850. [DOI] [PMC free article] [PubMed] [Google Scholar]
- 13.Ferguson S, De Camilli P. Dynamin, a membrane remodelling GTPase. Nat Rev Mol Cell Biol. 2012;13:75–88. doi: 10.1038/nrm3266. [DOI] [PMC free article] [PubMed] [Google Scholar]
- 14.Frank S, et al. The role of dynamin-related protein 1, a mediator of mitochondrial fission, in apoptosis. Dev Cell. 2001;1:515–25. doi: 10.1016/s1534-5807(01)00055-7. [DOI] [PubMed] [Google Scholar]
- 15.Gomes LC, Di Benedetto G, Scorrano L. During autophagy mitochondria elongate, are spared from degradation and sustain cell viability. Nat Cell Biol. 2011;13:589–98. doi: 10.1038/ncb2220. [DOI] [PMC free article] [PubMed] [Google Scholar]
- 16.Taguchi N, Ishihara N, Jofuku A, Oka T, Mihara K. Mitotic phosphorylation of dynamin-related GTPase Drp1 participates in mitochondrial fission. J Biol Chem. 2007;282:11521–11529. doi: 10.1074/jbc.M607279200. [DOI] [PubMed] [Google Scholar]
- 17.Thompson HM, Skop AR, Euteneuer U, Meyer BJ, McNiven MA. The large GTPase dynamin associates with the spindle midzone and is required for cytokinesis. Curr Biol. 2002;12:2111–2117. doi: 10.1016/s0960-9822(02)01390-8. [DOI] [PMC free article] [PubMed] [Google Scholar]
- 18.Morlot S, Roux A. Mechanics of dynamin-mediated membrane fission. Annu Rev Biophys. 2013;42:629–49. doi: 10.1146/annurev-biophys-050511-102247. [DOI] [PMC free article] [PubMed] [Google Scholar]
- 19.Bui HT, Shaw JM. Dynamin assembly strategies and adaptor proteins in mitochondrial fission. Curr Biol. 2013;23:R891–9. doi: 10.1016/j.cub.2013.08.040. [DOI] [PMC free article] [PubMed] [Google Scholar]
- 20.Doyon JB, et al. Rapid and efficient clathrin-mediated endocytosis revealed in genome-edited mammalian cells. Nat Cell Biol. 2011;13:331–7. doi: 10.1038/ncb2175. [DOI] [PMC free article] [PubMed] [Google Scholar]
- 21.Nishida K, et al. Dynamic recruitment of dynamin for final mitochondrial severance in a primitive red alga. Proc Natl Acad Sci U S A. 2003;100:2146–51. doi: 10.1073/pnas.0436886100. [DOI] [PMC free article] [PubMed] [Google Scholar]
- 22.Miyagishima S, et al. A plant-specific dynamin-related protein forms a ring at the chloroplast division site. Plant Cell. 2003;15:655–65. doi: 10.1105/tpc.009373. [DOI] [PMC free article] [PubMed] [Google Scholar]
- 23.Shim SH, et al. Super-resolution fluorescence imaging of organelles in live cells with photoswitchable membrane probes. Proc Natl Acad Sci U S A. 2012;109:13978–83. doi: 10.1073/pnas.1201882109. [DOI] [PMC free article] [PubMed] [Google Scholar]
- 24.Otera H, et al. Mff is an essential factor for mitochondrial recruitment of Drp1 during mitochondrial fission in mammalian cells. J Cell Biol. 2010;191:1141–58. doi: 10.1083/jcb.201007152. [DOI] [PMC free article] [PubMed] [Google Scholar]
- 25.Chanez AL, Hehl AB, Engstler M, Schneider A. Ablation of the single dynamin of T. brucei blocks mitochondrial fission and endocytosis and leads to a precise cytokinesis arrest. J Cell Sci. 2006;119:2968–74. doi: 10.1242/jcs.03023. [DOI] [PubMed] [Google Scholar]
- 26.Burger KNJ, Demel RA, Schmid SL, De Kruijff B. Dynamin is membrane-active: Lipid insertion is induced by phosphoinositides and phosphatidic acid. Biochemistry. 2000;39:12485–12493. doi: 10.1021/bi000971r. [DOI] [PubMed] [Google Scholar]
- 27.Otera H, Miyata N, Kuge O, Mihara K. Drp1-dependent mitochondrial fission via MiD49/51 is essential for apoptotic cristae remodeling. J Cell Biol. 2016;212:531–544. doi: 10.1083/jcb.201508099. [DOI] [PMC free article] [PubMed] [Google Scholar]
- 28.Osellame LD, et al. Cooperative and independent roles of Drp1 adaptors Mff and MiD49/51 in mitochondrial fission. J Cell Sci. 2016 doi: 10.1242/jcs.185165. jcs.185165- [DOI] [PMC free article] [PubMed] [Google Scholar]
- 29.Osman C, Voelker DR, Langer T. Making heads or tails of phospholipids in mitochondria. Journal of Cell Biology. 2011;192:7–16. doi: 10.1083/jcb.201006159. [DOI] [PMC free article] [PubMed] [Google Scholar]
- 30.Ji WK, Hatch AL, Merrill RA, Strack S, Higgs HN. Actin filaments target the oligomeric maturation of the dynamin GTPase Drp1 to mitochondrial fission sites. Elife. 2015;4 doi: 10.7554/eLife.11553. [DOI] [PMC free article] [PubMed] [Google Scholar]
- 31.McDonald K, et al. ‘Tips and tricks’ for high-pressure freezing of model systems. Methods Cell Biol. 2010;96:671–93. doi: 10.1016/S0091-679X(10)96028-7. [DOI] [PubMed] [Google Scholar]
- 32.Schiel Ja, et al. Endocytic membrane fusion and buckling-induced microtubule severing mediate cell abscission. J Cell Sci. 2011;124:1411–1424. doi: 10.1242/jcs.081448. [DOI] [PMC free article] [PubMed] [Google Scholar]
- 33.O’Toole ET, Giddings TH, Dutcher SK. Understanding Microtubule Organizing Centers by Comparing Mutant and Wild-Type Structures with Electron Tomography. Methods in Cell Biology. 2007;2007:125–143. doi: 10.1016/S0091-679X(06)79005-7. [DOI] [PubMed] [Google Scholar]
- 34.Kremer JR, Mastronarde DN, McIntosh JR. Computer visualization of three-dimensional image data using IMOD. J Struct Biol. 116:71–6. doi: 10.1006/jsbi.1996.0013. [DOI] [PubMed] [Google Scholar]
- 35.Mastronarde DN. Dual-axis tomography: an approach with alignment methods that preserve resolution. J Struct Biol. 1997;120:343–52. doi: 10.1006/jsbi.1997.3919. [DOI] [PubMed] [Google Scholar]
- 36.Mastronarde DN. Automated electron microscope tomography using robust prediction of specimen movements. J Struct Biol. 2005;152:36–51. doi: 10.1016/j.jsb.2005.07.007. [DOI] [PubMed] [Google Scholar]
Associated Data
This section collects any data citations, data availability statements, or supplementary materials included in this article.
Supplementary Materials
Data Availability Statement
The source data for all gels and blots are provided as a supplementary figure in the online version of the paper. All other data that support the findings of this study are available from the authors upon reasonable request.


