

Abstract
Entity-attribute-value (EAV) tables are widely used to store data in electronic medical records and clinical study data management systems. Before they can be used by various analytical (e.g., data mining and machine learning) programs, EAV-modeled data usually must be transformed into conventional relational table format through pivot operations. This time-consuming and resource-intensive process is often performed repeatedly on a regular basis, e.g., to provide a daily refresh of the content in a clinical data warehouse. Thus, it would be beneficial to make pivot operations as efficient as possible. In this paper, we present three techniques for improving the efficiency of pivot operations: 1) filtering out EAV tuples related to unneeded clinical parameters early on; 2) supporting pivoting across multiple EAV tables; and 3) conducting multi-query optimization. We demonstrate the effectiveness of our techniques through implementation. We show that our optimized execution method of pivoting using these techniques significantly outperforms the current basic execution method of pivoting. Our techniques can be used to build a data extraction tool to simplify the specification of and improve the efficiency of extracting data from the EAV tables in electronic medical records and clinical study data management systems.
Index Terms: Clinical study data management system (CS-DMS), database, electronic medical record (EMR), entity-attribute-value (EAV), pivot
I. Introduction
The entity-attribute-value (EAV) data model is widely used for data storage in electronic medical records (EMRs) and clinical study data management systems (CSDMSs). It is particularly suitable for supporting fast transaction processing when data are sparse and have many applicable attributes, but only a small fraction of them applies to a specific entity [1]. Among all sparse data storage models [1]–[3] that have been proposed in the relational database literature, the EAV data model is the most widely used in clinical systems. Example EMR systems using the EAV data model include the Regenstrief EMR [4], the Columbia-Presbyterian EMR [5], the TMR EMR [6], Intermountain Healthcare’s HELP EMR [7], and the Cerner Power-chart EMR [8]. Example CSDMSs using the EAV data model include Oracle Clinical [9], Clintrial [10], TrialDB [11], i2b2, LabKey, OpenClinica, Opal, and REDCap [12], [13].
The EAV data model uses tables with at least three columns: the entity, the attribute, and the value. Typically, the entity column includes the ID of a clinical event, which can be regarded as the combination of a patient ID and a date/time stamp [14, p. 58]. The attribute column includes the ID of a clinical parameter. The value column includes the clinical parameter’s value. An example EAV table is shown in Fig. 1.
Fig. 1.

Pivot to obtain the columns for the three clinical parameters “test 1,” “test 2,” and “test 3.”
EAV tables can support fast transaction processing for individual patients, but are inefficient for population-based online analytical processing because data of the same event are spread across multiple rows. Also, EAV tables cannot be directly used by most of the existing analytical (e.g., data mining and machine learning) programs, which require inputs in the conventional relational table format [15]. That is, each clinical parameter of interest should have its own column. To address these problems, row-modeled data in EAV tables in a production clinical system are transformed into column-modeled conventional relational table format through pivot operations [16]–[18]. The transformed data are then bulk loaded into an enterprise clinical data warehouse, which typically runs on separate hardware from the production system [14], [19] and supports various management, strategic decision making, and clinical decision support applications [20]. Fig. 1 shows an example of the pivot operation.
A production clinical system typically contains a huge amount of data. Frequently, hundreds to thousands of conventional relational tables, e.g., one per form in an EMR or CSDMS [14, p. 344], [15], need to be generated in a clinical data warehouse through a bulk extraction process using pivot operations. For instance, 9,000 tables and 10 terabytes of data are included in Intermountain Healthcare’s enterprise data warehouse [20]. Thus, the bulk extraction process often consumes much time and significant computing resources. As new data continually arrive at the production system, this process is performed repeatedly on a regular basis, such as every night [20]. It would be beneficial to make this process, particularly the pivot operations, as efficient as possible.
Several execution methods of pivoting have been proposed in the research literature [17], [21]. Among them, the one sketched in [17] is the most efficient for datasets larger than memory. In this paper, we focus on the common case that the dataset is larger than memory. We describe the execution method sketched in [17] in detail. Then, we present three techniques for improving the efficiency of pivot operations. The first technique uses a special property of clinical applications to filter out EAV tuples related to unneeded clinical parameters early on. The second technique supports pivoting across multiple EAV tables. The third technique conducts multi-query optimization. We demonstrate the effectiveness of our techniques through an initial implementation.
A large healthcare provider typically has an information technology (IT) team dedicated to building and maintaining its clinical data warehouse. Frequently, for research, reporting, quality improvement, and other operational purposes, medical researchers and hospital operational people who do not necessarily have much computing background need to construct conventional relational tables from the EAV tables in the EMR. At present, such data extraction is conducted by submitting requests to the IT team. These data extraction requests are often fulfilled after a long delay or not at all, because the IT team tends to be constantly busy and pivot operations usually consume much time and significant computing resources.
Our techniques can be used to build a data extraction tool to simplify the specification of and improve the efficiency of extracting data from the EAV tables in the EMR. This tool can also facilitate data extraction from CSDMSs. After the user inputs the clinical parameters of interest and any other needed information, the data extraction tool automatically forms the corresponding pivot operations and then executes them. In this way, by eliminating dependence on the IT team, medical researchers and hospital operational people can use the data extraction tool to independently construct needed relational tables on demand and in a short amount of time. This would facilitate research, quality improvement, and hospital operations.
II. Methods
This section contains three parts. Section II-A reviews the definition of the pivot operation. Section II-B discusses existing execution methods of pivoting. Section II-C describes our techniques for improving the efficiency of pivot operations. A list of symbols used in this paper is provided in the Appendix.
A. Definition of the Pivot Operation
In this section, we review the definition of the pivot operation.
1) SQL Syntax
An example syntax of the pivot operation in structured query language (SQL) is as follows [22]:
SELECT <non-pivoted column(s)>, <alias 1>, <alias 2>,
        . . ., <alias n>
FROM <table-expression>
PIVOT (<value column(s)>
            FOR <column containing the values that will
                     become column headers>
            IN (<value 1> AS <alias 1>, <value 2> AS <alias
                 2>, . . ., <value n> AS <alias n>))
[WHERE clause]
[ORDER BY clause];
Here, <value 1>, <value 2>, …, and <value n> correspond to the n clinical parameters needed in the pivot result.
For the example shown in Fig. 1, the corresponding SQL query is as follows:
SELECT event_ID, test_1, test_2, test_3
FROM clinical_data
PIVOT (value FOR parameter_ID IN (‘test 1’ AS test_1,
                ‘test 2’ AS test_2, ‘test 3’ AS test_3));
Here, “test 1,” “test 2,” and “test 3” are three clinical parameters needed in the pivot result. “test 4” is a clinical parameter that appears in the EAV table clinical_data, but is unneeded for the pivot result.
In the database research literature [16], [23], the pivot operation has been defined in two closely related, but different ways. Here, we call them inner pivot [23] and outer pivot [16], respectively. To differentiate them, we can introduce two reserved words INNER_PIVOT and OUTER_PIVOT into SQL. In the rest of this paper, pivot refers to outer pivot by default, unless inner pivot is specifically mentioned. We assume that in each EAV table, the entity column and the attribute column form a unique key, and hence, any two values in the value column will never map to the same location in the pivot result. If this is not the case, we can use the methods described in [17] to handle data collisions, if any.
2) Outer Pivot
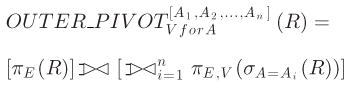
Let R denote an EAV table with an entity column E, an attribute column A, and a value column V. A1, A2, …, and An are n values of column A. Using relational algebra, the outer pivot operator is defined by [16]
 |
(1) |
Here,
 is the left outer join operator.
is a short hand for Ψ1 Θ Ψ2 Θ ··· ΘΨn. For a join operation including its outer species, the join predicate is assumed to be the equality of E unless otherwise stated.
is the left outer join operator.
is a short hand for Ψ1 Θ Ψ2 Θ ··· ΘΨn. For a join operation including its outer species, the join predicate is assumed to be the equality of E unless otherwise stated.
In general, the attribute column of the EAV table R can include more values beyond A1, A2, …, and An. The pivot result will include an all-null relational tuple for an entity, if the entity appears in R, but none of the entity’s EAV tuples in R relates to any of A1, A2, …, and An [16]. An all-null tuple has a null value in each non-entity attribute. For instance, in the example shown in Fig. 1, the EAV table clinical_data includes a tuple of the entity E3 related to the clinical parameter “test 4.” Consequently, the conventional relational table test_data formed through pivoting clinical_data includes an all-null tuple for E3.
3) Inner Pivot
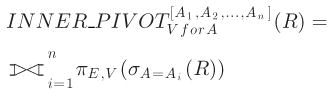
The inner pivot operation is almost the same as the outer pivot operation, except that it eliminates all-null tuples introduced by the outer pivot operation. The inner pivot operator is defined by [23]:
 |
(2) |
Here,
 is the full outer join operator. For the example shown in Fig. 1, the corresponding inner pivot result is shown in Fig. 2.
Fig. 2.

Inner pivot result corresponding to the example shown in Fig. 1.
B. Existing Execution Methods of Pivoting
As shown in (1), the simplest way to implement pivot is to conduct a series of (self-)joins, one per needed clinical parameter [23]. This method is rather inefficient due to the large number of joins typically needed [17]. In the past, researchers have proposed several more efficient execution methods of pivoting avoiding join [17], [21]. Among them, the one sketched in [17] is the most efficient for datasets larger than memory. In this section, we describe this execution method in detail, much of which has not been included in [17].
This execution method of pivoting implements pivot as GROUP BY (grouping) using either a sort-based approach [24, Ch. 15.4] or a hash-based approach [24, Ch. 15.5]. Either approach can support parallel query execution [24, Ch. 20.1], e.g., on multiple computers, by distributing EAV tuples in such a way that those of the same entity are processed in the same thread on the same computer [17]. In the following, we describe these two approaches one by one. Our description focuses on two-pass approaches, in which data from an EAV table are read into memory, processed, written out to disk, and then reread from disk to complete the pivot operation. As mentioned in [24, Ch. 15.4], two passes are usually enough in practice, even for a very large EAV table. Also, it is not difficult to generalize to more than two passes.
1) Sort-Based Approach
The high-level idea of the sort-based approach is to use an efficient external sorting algorithm [25] to sort all tuples in the EAV table based on their entity values. Then, all EAV tuples of the same entity become next to each other and are integrated into a conventional relational tuple for the entity. Several external sorting algorithms have been developed in the computer science literature [25]. In the rest of this section, we present the details of the sort-based approach in a way similar to that in [24, Ch. 15.4].
Let M denote the number of pages available in the buffer pool in memory. We perform the following four steps.
Step 1: Read all tuples of the EAV table R into memory, M pages at time. Use a fast main-memory sorting algorithm, such as Quicksort, to sort each M pages in ascending order of the entity value. Write each sorted sublist out to disk. This produces N = ⌈|R|/M⌉ sorted sublists in total, with N ≤ M for a two-pass approach. Here, |R| denotes the size of R in pages. ⌈x⌉ is the ceiling function (e.g., ⌈1.3⌉ = 2).
Step 2: Allocate N buffer pages, one for each sorted sublist. For each sublist, load its first block into its corresponding buffer page.
-
Step 3: Find the smallest entity value v among the first EAV tuples in the N buffer pages. Then:
Create a conventional relational tuple tv for v with n attributes, one for each clinical parameter needed in the pivot result. Here, n denotes the number of clinical parameters needed in the pivot result. Initialize the value of each attribute of tv as null.
In each of the N buffer pages, the EAV tuples with entity value v, if any, must be the first several ones there because each sublist is sorted in ascending order of the entity value. Examine each EAV tuple t with entity value v in the N buffer pages. For tv’s attribute corresponding to the clinical parameter ID t.attribute, set its value to be t.value. Then remove t from its corresponding buffer page. If a buffer page becomes empty, load the next block, if any, from the corresponding sublist into it.
When no more EAV tuple with entity value v remains in any of the N buffer pages, all EAV tuples with entity value v in the EAV table R have been integrated into the relational tuple tv. Output tv as a pivot result tuple.
Step 4: Repeat Step 3 until all EAV tuples in the N sorted sublists have been consumed.
In the above four steps, Step 1 constitutes the first pass. Steps 2–4 form the second pass that merges the N sorted sublists to generate the conventional relational tuples in the pivot result. For the example shown in Fig. 1, Fig. 3 illustrates the second pass of the sort-based approach.
Fig. 3.

In the second pass of the sort-based approach, integrate EAV tuples of the same entity from multiple sorted sublists into a conventional relational tuple for the entity.
For an EAV table R, this two-pass sort-based approach will work as long as |R| ≤ M2 [24, Ch. 15.4]. For database operations, disk I/O cost typically dominates CPU cost [2], [24, p. 756]. In modeling a database operation’s cost, we adopt the method used in [24, p. 756]: only disk I/O cost is considered and no charge is added for handling the output. This two-pass sort-based approach takes 3|R| disk I/Os [24, Ch. 15.4]:
|R| to read the EAV table into memory to create the sorted sublists in the first pass.
|R| to write the sorted sublists out to disk in the first pass.
|R| to read the sorted sublists into memory in the second pass.
2) Hash-Based Approach
The high-level idea of the hash-based approach is to partition all tuples in the EAV table into buckets via hashing the entity value. For each entity, all EAV tuples of it fall into the same bucket. We ensure that within each bucket, all EAV tuples of the same entity are next to each other to facilitate integrating them into a conventional relational tuple for the entity. In the rest of this section, we present the details of the hash-based approach in a way similar to that in [24, Ch. 15.5].
Let h1 and h2 denote two hash functions taking an entity value as input. h1 maps an entity value to an integer between 1 and M − 1. We perform the following four steps.
Step 1: Initialize M − 1 buckets, each of which uses an empty buffer page. The last buffer page holds blocks of the EAV table, one at a time.
Step 2: Read all tuples of the EAV table into memory, one block at a time. For each EAV tuple t, use the first hash function h1 to hash t to the bucket h1 (t.entity) and copy t to the corresponding buffer page. If a bucket’s buffer page becomes full, write it out to disk and then re-initialize it to be empty.
Step 3: After all tuples of the EAV table are consumed, write each bucket’s buffer page out to disk if it is not empty. This produces M − 1 buckets of EAV tuples. If the hash function h1 works well, each bucket will have about |R|/(M − 1) blocks. For a two-pass approach, we should have |R|/(M − 1) ≤ M, or |R| ≤ M (M − 1), so that each bucket can be held in memory in Step 4.
-
Step 4: Process the M − 1 buckets one by one in M − 1 phases, one bucket per phase. In each phase, process a bucket B as follows:
Initialize a hash table for the second hash function h2.
Read all EAV tuples in B into memory. For each EAV tuple t, use h2 to hash t to the bucket h2 (t.entity) in the hash table. Add t into this bucket while keeping all EAV tuples in this bucket sorted in ascending order of the entity value. This ensures that within this bucket, all EAV tuples of the same entity are next to each other.
When all EAV tuples in B have been added into the hash table, process all buckets in the hash table one by one. For each bucket in the hash table, sequentially scan all EAV tuples in the bucket, integrate all EAV tuples of the same entity into a conventional relational tuple tv for the entity, and output tv as a pivot result tuple. This is done in a way similar to that in Step 3 of the sort-based approach.
In the above four steps, Steps 1–3 form the first pass. Step 4 constitutes the second pass. This two-pass hash-based approach will work when |R| ≤ M (M − 1) ≈ M2 and takes 3|R| disk I/Os [24, Ch. 15.5].
C. Techniques for Improving the Efficiency of Pivot Operations
In this section, we present three techniques for improving the efficiency of pivot operations. These techniques can be used in combination and implemented either inside or outside a relational database management system (RDBMS). If they are implemented inside an RDBMS, we will have more opportunities for query optimization [17]. Moreover, we can use them to speed up the maintenance of materialized views defined using pivot operations [22], [23].
1) Filtering Out EAV Tuples Related to the Unneeded Clinical Parameters Early On
Consider a pivot operation transforming an EAV table to a conventional relational table. Usually, the clinical parameters needed in the pivot result are only a small subset of those appearing in the EAV table. Each entity appearing in the EAV table has a corresponding tuple in the outer pivot result table, but most of these tuples are all-null. For example, hundreds of thousands of clinical parameters exist in an EMR [14, p. 56]. A relational table in a clinical data warehouse typically includes no more than a few dozen clinical parameters. For most clinical events, none of these clinical parameters was recorded [26].
All-null tuples occupy storage space, slow down query processing, and are useless for almost all clinical applications. It would be desirable to avoid all-null tuples introduced by outer pivot operations and use inner pivot operations to generate conventional relational tables in a clinical data warehouse. If we ever need to obtain the all-null tuples that would be introduced by an outer pivot operation, we can always outer join an inner pivot result table with an entity table listing all entities.
One basic method for executing inner pivot is to conduct outer pivot and then filter out the all-null tuples introduced by the outer pivot operation [17]. This method is inefficient, as it repeatedly processes the EAV tuples related to the clinical parameters that appear in the EAV table, but are unneeded for the inner pivot result. A more efficient method for executing inner pivot is to filter out EAV tuples related to the unneeded clinical parameters early on.
This execution method can be implemented through pushing a filter below the inner pivot operator in the query execution plan. In both the sort-based approach and the hash-based approach, only EAV tuples related to the clinical parameters needed in the inner pivot result are retrieved and processed.
Let p denote the percentage, based on total size, of the tuples in the EAV table R that are related to the clinical parameters needed in the inner pivot result. Let p′ denote the percentage of pages in R that contain at least one tuple related to the needed clinical parameters. The technique mentioned above reduces the disk I/O cost of the two-pass sort-based or hash-based approach from 3|R| I/Os to (q + 2p) · |R|I/Os:
q·|R| to read the EAV tuples related to the needed clinical parameters into memory in the first pass. If the query optimizer chooses to perform table-scan on R, q = 1. If an index exists on the attribute column of R and the query optimizer chooses to perform index-scan on R, q = p′ ≤ 1.
p·|R| to write the EAV tuples related to the needed clinical parameters out to disk in the first pass.
p·|R| to read the EAV tuples related to the needed clinical parameters into memory in the second pass.
Frequently, p ≪ 1, 3/(q + 2p) ≥ 3/(1 + 2p) ≈ 3, and hence the disk I/O cost is reduced by almost three or more times.
For executing outer pivot, we can use a technique similar to the one mentioned above to speed up the sort-based approach. In the first pass of the sort-based approach, we can remove many EAV tuples related to unneeded clinical parameters early on as part of the in-memory sorting process. More specifically, during any stage of this sorting process, if we run into an EAV tuple t with entity value v related to an unneeded clinical parameter, and the EAV tuple t′ next to t has the same entity value v, we throw t away without further processing. The existence of t′ is sufficient for signaling that a conventional relational tuple needs to be generated for v in the outer pivot result.
2) Pivoting Across Multiple EAV Tables
An EMR or CS-DMS often includes multiple EAV tables. To allow more compact storage as well as indexing by value, a separate EAV table is used for each data type [14, p. 64], [26]. Also, special-purpose EAV tables can be used to store restricted kinds of homogeneous data, such as lab values, pharmacy orders and medications, surgical and medical interventions, and general clinical observations [27].
Consider a conventional relational table S in a clinical data warehouse. The data of the clinical parameters included in S are scattered across m > 1 EAV tables R1, R2, …, and Rm in an EMR or CSDMS. One basic method for generating S from R1, R2, …, and Rm is to compute and write to disk an inner pivot result table for each Ri (1 ≤ i ≤ m). Then, based on equality of the entity column, all inner pivot result tables are full outer joined together to form S. This requires performing m − 1 joins, which often takes an excessive amount of time [21]. This is particularly the case if m is not very small, as RDBMSs are inefficient at handling many joins in a single query.
A more efficient method for generating the conventional relational table S from the EAV tables R1, R2, …, and Rm is to support pivoting across multiple EAV tables [21]. In computing an inner pivot result table for each Ri (1 ≤ i ≤ m), we skip the last step of producing the inner pivot result table and move on to generate S directly. In this way, we save both the overhead of writing the inner pivot result table for each Ri (1 ≤ i ≤ m) to disk and the overhead of conducting m − 1 full outer joins among the m inner pivot result tables. The larger the number m of EAV tables, the greater performance advantage this method gains.
This method of supporting pivoting across multiple EAV tables can be implemented using either a sort-based approach or a hash-based approach. Either approach consists of two stages. The first stage processes each EAV table Ri (1 ≤ i ≤ m) one by one to produce some intermediate computation results. The second stage handles the intermediate results computed from R1, R2, …, and Rm simultaneously. The two stages of the sort-based approach match the two passes described in Section II-B1, respectively. The two stages of the hash-based approach match the two passes described in Section II-B2, respectively.
We first describe the sort-based approach. In the first stage, we perform the first pass of computing an inner pivot result table for each EAV table Ri (1 ≤ i ≤ m) one by one. This produces and writes out to disk multiple sorted sublists of Ri. In the second stage, we allocate one buffer page for every sorted sublist of each Ri (1 ≤ i ≤ m). Then, we simultaneously merge all sorted sublists of R1, R2, …, and Rm to generate the conventional relational tuples in S. In comparison, the second pass described in Section II-B1 merges the sorted sublists of only a single EAV table.
Next, we describe the hash-based approach. We use the same two hash functions h1 and h2 for each EAV table Ri (1 ≤ i ≤ m). This ensures that in the first stage, those EAV tuples that have the same entity value, but come from different Ri, are put into buckets with the same bucket number. Also, in the second stage, those EAV tuples are put into the same bucket of the hash table. In the first stage, we perform the first pass of computing an inner pivot result table for each EAV table Ri (1 ≤ i ≤ m) one by one. This produces and writes out to disk M − 1 buckets of EAV tuples of Ri. In the second stage, we proceed in M − 1 phases. In the jth (1 ≤ j ≤ M − 1) phase, we process the jth bucket of each Ri (1 ≤ i ≤ m) simultaneously to generate the conventional relational tuples in S corresponding to this bucket. In comparison, in the jth (1 ≤ j ≤ M − 1) phase of the second pass described in Section II-B2, we process the jth bucket of only a single EAV table.
3) Multi-query Optimization
Frequently, we need to perform multiple pivot operations on the same EAV table or across the same set of EAV tables [14, p. 344]. Each pivot operation produces a separate conventional relational table. For example, an EMR or CSDMS includes many forms. The data entered into these forms are stored in the same EAV table or the same set of EAV tables. For each form, a conventional relational table needs to be generated in a clinical data warehouse [14, p. 344], [15].
Usually, those pivot operations on the same EAV table or across the same set of EAV tables share much work in common. This provides an opportunity for us to conduct multi-query optimization [28], [29] to avoid repeatedly performing this part of the work. In the rest of this section, we focus on the case that multiple pivot operations are performed on the same EAV table. The discussion with the case that multiple pivot operations are performed across the same set of EAV tables is similar and omitted.
In the first pass of the sort-based or hash-based approach of executing a pivot operation on an EAV table, the EAV table is often read into memory. For a large EAV table, this read will incur many disk I/Os. In a typical case, the pivot operation is an inner pivot one, the clinical parameters needed in the inner pivot result are only a small subset of those appearing in the EAV table, and we can use the technique described in Section II-C1 to filter out the EAV tuples related to the unneeded clinical parameters early on. Then, most of the inner pivot operation’s disk I/O cost will be spent on reading the EAV table into memory.
When multiple inner pivot operations are performed on the same EAV table, the EAV table will often be read into memory multiple times. This will repeatedly incur the same set of many disk I/Os and is inefficient. As shown in Fig. 4, a more efficient method of executing these inner pivot operations is to conduct multi-query optimization [28], [29] on them to let them share the work of reading the EAV table into memory. Then, this work is performed only once rather than multiple times, and subsequently, a large portion of the disk I/O cost is spared for all but one inner pivot operation. In the database area, the idea of letting multiple queries share the work of reading the same table into memory has been used before both in synchronized scan [30]–[32] and in multi-query optimization on other types of queries [28], [29]. The larger the number of inner pivot operations, the greater performance advantage the multi-query optimization method gains.
Fig. 4.

Multiple inner pivot operations on the same EAV table share the work of reading the EAV table into memory.
To conduct multi-query optimization on multiple inner pivot operations on the same EAV table, we proceed as follows. For all of these inner pivot operations, the first pass of the sort-based or hash-based execution approach is run concurrently. A separate portion of the pages available in the buffer pool, rather than all pages available in the buffer pool, is allocated to each inner pivot operation to produce the intermediate computation results. For instance, the pages available in the buffer pool can be divided evenly among all of these inner pivot operations. For the sort-based approach, the intermediate computation results are sorted sublists of EAV tuples. For the hash-based approach, the intermediate computation results are buckets of EAV tuples. After the first pass is completed, the second pass of the sort-based or hash-based execution approach is run for each inner pivot operation one by one, using all pages available in the buffer pool.
III. Results
In this section, we present results from a prototype implementation of our techniques for improving the efficiency of pivot operations. As is the case with executing GROUP BY, the sort-based approach and the hash-based approach have similar performance in executing pivot operations [24, Chs. 15.4 and 15.5]. Our implementation used the sort-based approach.
A. Setup
We conducted three experiments. In each experiment, we evaluated one of our three techniques for improving the efficiency of pivot operations, by comparing our optimized execution method of pivoting using this technique with the basic execution method of pivoting without using this technique. When measuring the execution time of an inner pivot query or the total execution time of a set of inner pivot queries, we excluded the time spent on outputting inner pivot result tuples, which was a constant independent of the method used to execute the query or the set of queries. In addition, we started executing the query or the set of queries on an unloaded system. This avoided any variable buffer pool caching effect that was left over from the execution of previous queries.
Each experiment included two sub-experiments. The first sub-experiment used one or more EAV tables containing synthetic data. Each EAV table had the same set of three integer attributes: (event_ID, parameter_ID, value), an index created on the parameter_ID attribute, and 512M tuples with a total size of 6 GB.
The second sub-experiment used one or two EAV tables containing real clinical data from lab tests. The source of the clinical data was the Multiparameter Intelligent Monitoring in Intensive Care II (MIMIC II) database [33], which is publicly available at PhysioNet.org [34]. Each EAV table had the same set of three attributes: (hospital_admission_ID, lab_test_ID, test_result_value), an index created on the lab_test_ID attribute, and a total size of 6 GB. Both hospital_admission_ID (entity) and lab_test_ID (attribute) were integer attributes. test_result_value (value) was always a float attribute except in one case. In one of the two EAV tables used in Sub-experiment 2.2, test_result_value was a variable-length character string attribute. The lab test results in the MIMIC II database came from around 36 thousand hospital stays and had a limited total size. To let each EAV table reach a total size of 6 GB and still have the same data distribution as that in the MIMIC II database, we made multiple copies of the lab test result data in the MIMIC II database, performed one-by-one replacement of the hospital admission IDs in each copy so that each copy had a distinct set of hospital admission IDs, and combined the copies together to form the EAV tables.
Our measurements were performed on a Dell Inspiron 1525 PC with one two-core 2-GHz processor, 4-GB main memory, one 109-GB IDE disk, and running the Microsoft Windows Vista operating system.
1) Setup of Experiment 1
Using an EAV table, Experiment 1 tested our first technique of filtering out EAV tuples related to the unneeded clinical parameters early on. In the first sub-experiment, an inner pivot query was run on the EAV table to generate a conventional relational table including three clinical parameters. In the second sub-experiment, an inner pivot query was run on the EAV table to generate a conventional relational table including multiple lab tests.
2) Setup of Experiment 2
Experiment 2 tested our second technique of supporting pivoting across multiple EAV tables. Both the basic and optimized execution methods of pivoting used our first technique of filtering out EAV tuples related to the unneeded clinical parameters early on.
In the first sub-experiment, we used m EAV tables with each containing the same set of event IDs and unique parameter IDs. An inner pivot query was run on the m EAV tables to generate a single conventional relational table, which included three clinical parameters from each of the m EAV tables. In each of the m EAV tables, every event ID was associated with the same set of three parameter IDs. Thus, all tuples in the EAV table were related to the clinical parameters needed in the inner pivot result.
In the second sub-experiment, we used two EAV tables. The first EAV table covered the lab tests with numeric results. Its test_result_value attribute was of float type. The second EAV table covered the lab tests with character string results. Its test_result_value attribute was of variable-length character string type. A first inner pivot query was run on the first EAV table to generate a conventional relational table, which included the 50 most frequently occurring lab tests with numeric results in the MIMIC II database. A second inner pivot query was run on both EAV tables to generate a single conventional relational table, which included the 50 most frequently occurring lab tests with numeric results as well as the 50 most frequently occurring lab tests with character string results in the MIMIC II database.
3) Setup of Experiment 3
Using an EAV table, Experiment 3 tested our third technique of conducting multi-query optimization. A set of k inner pivot queries on the EAV table was submitted to the query execution system simultaneously. In the basic execution method of pivoting, the k inner pivot queries were executed one by one. In our optimized execution method of pivoting, the k inner pivot queries were executed concurrently using multi-query optimization. Both the basic and optimized execution methods of pivoting used our first technique of filtering out EAV tuples related to the unneeded clinical parameters early on.
In the first sub-experiment, every event ID was associated with the same set of parameter IDs in the EAV table. No two inner pivot queries shared any clinical parameter in common. Each of the k inner pivot queries generated a conventional relational table including three clinical parameters. Ten percent of the tuples in the EAV table were related to the three clinical parameters.
In the second sub-experiment, each of the k inner pivot queries generated a conventional relational table including three lab tests. The first inner pivot query used the three most frequently occurring lab tests with numeric results in the MIMIC II database. The second inner pivot query used the next three most frequently occurring lab tests with numeric results in the MIMIC II database, and so on. According to the data distribution in the MIMIC II database, 3.6% of the tuples in the EAV table are related to the most frequently occurring lab test with numeric result in the MIMIC II database. One percent of the tuples in the EAV table are related to the 30th most frequently occurring lab test with numeric result in the MIMIC II database.
B. Test Results for Experiment 1
1) Test Results for Sub-experiment 1.1
In the first sub-experiment, we varied p, the percentage of the tuples in the EAV table that are related to the clinical parameters needed in the inner pivot result, from 0% to 100%. Since each EAV tuple is of the same size, p also represents the percentage, based on total size, of the tuples in the EAV table that are related to the clinical parameters needed in the inner pivot result.
Fig. 5 shows the inner pivot query’s execution time versus p. The amount of time taken by the basic execution method of pivoting is basically a constant independent of p. In contrast, the amount of time taken by the optimized execution method of pivoting increases with p. When p < 100% indicating that some tuples in the EAV table are related to the unneeded clinical parameters, the optimized execution method of pivoting always runs faster than the basic execution method of pivoting.
Fig. 5.

Query execution time versus p.
Fig. 6 shows the ratio of the amount of time taken by the basic execution method of pivoting over the amount of time taken by the optimized execution method of pivoting versus p. As explained by different approaches’ disk I/O costs computed in Section II-C1, the smaller the p, the greater performance advantage the optimized execution method of pivoting has over the basic execution method of pivoting.
Fig. 6.

Ratio of the amount of time taken by the basic execution method of pivoting over the amount of time taken by the optimized execution method of pivoting versus p.
2) Test Results for Sub-experiment 1.2
In the second sub-experiment, we varied nt, the number of lab tests needed in the inner pivot result, from 2 to 10. These nt lab tests are the nt most frequently occurring ones with numeric results in the MIMIC II database. The percentage of the tuples in the EAV table that are related to the lab tests needed in the inner pivot result increases with nt.
Fig. 7 shows the inner pivot query’s execution time versus nt. The amount of time taken by the basic execution method of pivoting is basically a constant independent of nt. In contrast, the amount of time taken by the optimized execution method of pivoting increases with nt. The optimized execution method of pivoting always runs faster than the basic execution method of pivoting, as most tuples in the EAV table are unrelated to the needed lab tests.
Fig. 7.

Query execution time versus nt.
Fig. 8 shows the ratio of the amount of time taken by the basic execution method of pivoting over the amount of time taken by the optimized execution method of pivoting versus nt. The smaller the nt, the greater performance advantage the optimized execution method of pivoting has over the basic execution method of pivoting.
Fig. 8.

Ratio of the amount of time taken by the basic execution method of pivoting over the amount of time taken by the optimized execution method of pivoting versus nt.
C. Test Results for Experiment 2
1) Test Results for Sub-experiment 2.1
In the first sub-experiment, we varied m, the number of EAV tables, from 1 to 4. Fig. 9 shows the inner pivot query’s execution time versus m. Partly due to performing m − 1 joins as described in Section II-C2, the amount of time taken by the basic execution method of pivoting increases rapidly with m. In contrast, the amount of time taken by the optimized execution method of pivoting increases slowly with m. When m > 1, the optimized execution method of pivoting always runs faster than the basic execution method of pivoting.
Fig. 9.

Query execution time versus m in Sub-experiment 2.1.
Fig. 10 shows the ratio of the amount of time taken by the basic execution method of pivoting over the amount of time taken by the optimized execution method of pivoting versus m. As explained in Section II-C2, the bigger the m, the greater performance advantage the optimized execution method of pivoting has over the basic execution method of pivoting.
Fig. 10.

Ratio of the amount of time taken by the basic execution method of pivoting over the amount of time taken by the optimized execution method of pivoting versus m in Sub-experiment 2.1.
2) Test Results for Sub-experiment 2.2
In the second sub-experiment, we varied m, the number of EAV tables on which the inner pivot query was run, from 1 to 2. Fig. 11 shows the inner pivot query’s execution time versus m. Fig. 12 shows the ratio of the amount of time taken by the basic execution method of pivoting over the amount of time taken by the optimized execution method of pivoting versus m. The trends shown in the second sub-experiment are the same as those shown in the first sub-experiment.
Fig. 11.

Query execution time versus m in Sub-experiment 2.2.
Fig. 12.

Ratio of the amount of time taken by the basic execution method of pivoting over the amount of time taken by the optimized execution method of pivoting versus m in Sub-experiment 2.2.
D. Test Results for Experiment 3
1) Test Results for Sub-experiment 3.1
In the first sub-experiment, we varied k, the number of inner pivot queries on the same EAV table, from 1 to 10. Fig. 13 shows the total execution time of the set of inner pivot queries versus k. Due to repeatedly reading the EAV table from disk into memory, the amount of time taken by the basic execution method of pivoting increases rapidly with k. In contrast, the amount of time taken by the optimized execution method of pivoting increases slowly with k. When k > 1, the optimized execution method of pivoting always runs faster than the basic execution method of pivoting.
Fig. 13.

Total execution time of the set of inner pivot queries versus k in Sub-experiment 3.1.
Fig. 14 shows the ratio of the amount of time taken by the basic execution method of pivoting over the amount of time taken by the optimized execution method of pivoting versus k. As explained in Section II-C3, the bigger the k, the greater performance advantage the optimized execution method of pivoting has over the basic execution method of pivoting.
Fig. 14.

Ratio of the amount of time taken by the basic execution method of pivoting over the amount of time taken by the optimized execution method of pivoting versus k in Sub-experiment 3.1.
2) Test Results for Sub-experiment 3.2
In the second sub-experiment, we varied k, the number of inner pivot queries on the same EAV table, from 1 to 10. Fig. 15 shows the total execution time of the set of inner pivot queries versus k. Fig. 16 shows the ratio of the amount of time taken by the basic execution method of pivoting over the amount of time taken by the optimized execution method of pivoting versus k. The trends shown in the second sub-experiment are the same as those shown in the first sub-experiment.
Fig. 15.

Total execution time of the set of inner pivot queries versus k in Sub-experiment 3.2.
Fig. 16.

Ratio of the amount of time taken by the basic execution method of pivoting over the amount of time taken by the optimized execution method of pivoting versus k in Sub-experiment 3.2.
IV. Discussion and Conclusion
We present three techniques for improving the efficiency of pivot operations. Through implementation, we show that our optimized execution method of pivoting using these techniques significantly outperforms the current basic execution method of pivoting. Our techniques can serve as the base of building a data extraction tool to simplify the specification of and improve the efficiency of extracting data from the EAV tables in EMRs and CSDMSs.
This paper focuses on the execution methods of pivoting. It has addressed neither query optimization in an RDBMS [17] nor maintenance of materialized views defined using pivot operations [22], [23]. Both query optimization and materialized view maintenance incorporating our three techniques are interesting areas for future work.
Acknowledgments
The authors would like to thank K. Sward and S. Thomas for helpful discussions.
Biographies
 Gang Luo received the B.Sc. degree in computer science from Shanghai Jiaotong University, Shanghai, China, in 1998, and the Ph.D. degree in computer science from the University of Wisconsin-Madison, Madison, WI, USA, in 2004.
He is currently an Assistant Professor in the Department of Biomedical Informatics, University of Utah, Salt Lake City, UT, USA. From 2004 to 2012, he was a Research Staff Member at IBM T.J. Watson Research Center. His research interests include health informatics (system building and data analysis), database, information retrieval, natural language processing, machine learning, data mining, and brain–computer interface.
 Lewis J. Frey received the B.S. degree in mathematics from the University of Pittsburg, Pittsburg, PA, USA, in 1992, the M.S. degree in computer science from Vanderbilt University, Nashville, TN, USA, in 1994, and the Ph.D. degree in computer science from Vanderbilt University in 2003.
He is currently an Associate Professor in the Department of Public Health Sciences, Medical University of South Carolina, Charleston, SC, USA. From 2003 to 2006, he was a Postdoctoral Fellow in the Department of Biomedical Informatics, Vanderbilt University. From June 2006 to April 2014, he was an Assistant Professor in the Department of Biomedical Informatics, University of Utah, Salt Lake City, UT, USA. His research interests include biomedical informatics, machine learning, data mining, data integration, and big data analysis.
Appendix. List of Symbols
- A
Attribute column
- Ai (1 ≤ i ≤ n)
A value of the attribute column A
- B
Bucket
- E
Entity column
- h1, h2
Hash function
- k
Number of inner pivot queries on the same EAV table
- M
Number of pages available in the buffer pool in memory
- m
For the clinical parameters included in a conventional relational table, the number of EAV tables across which they are scattered
- N
Number of sorted sublists
- n
Number of clinical parameters needed in the pivot result
- nt
Number of lab tests needed in the inner pivot result
- p
Percentage, based on total size, of the tuples in the EAV table R that are related to the clinical parameters needed in the inner pivot result
- p′
Percentage of pages in the EAV table R that contain at least one tuple related to the clinical parameters needed in the inner pivot result
- R, Ri (1 ≤ i ≤ m)
EAV table
- |R|
Table R’s size in pages
- S
Conventional relational table
- t, t′
EAV tuple
- tv
Conventional relational tuple for the entity value v
- V
Value column
- v
Entity value
Footnotes
Color versions of one or more of the figures in this paper are available online at http://ieeexplore.ieee.org.
Contributor Information
Gang Luo, Department of Biomedical Informatics, University of Utah, Salt Lake City, UT 84108 USA.
Lewis J. Frey, Department of Public Health Sciences, Medical University of South Carolina, Charleston, SC 29425-8350 USA
References
- 1.Dinu V, Nadkarni PM. Guidelines for the effective use of entity-attribute-value modeling for biomedical databases. Int J Med Informat. 2007;76(11/12):769–779. doi: 10.1016/j.ijmedinf.2006.09.023. [DOI] [PMC free article] [PubMed] [Google Scholar]
- 2.Beckmann JL, Halverson A, Krishnamurthy R, Naughton JF. Extending RDBMSs to support sparse datasets using an interpreted attribute storage format. Proc Int Conf Data Eng. 2006:58. [Google Scholar]
- 3.Corwin J, Silberschatz A, Miller PL, Marenco L. Dynamic tables: an architecture for managing evolving, heterogeneous biomedical data in relational database management systems. J Am Med Informat Assoc. 2007;14(1):86–93. doi: 10.1197/jamia.M2189. [DOI] [PMC free article] [PubMed] [Google Scholar]
- 4.McDonald CJ, Blevins L, Tierney WM, Martin DK. The Regenstrief medical records. MD Comput. 1988;5(5):34–47. [PubMed] [Google Scholar]
- 5.Friedman C, Hripcsak G, Johnson SB, Cimino JJ, Clayton PD. A generalized relational schema for an integrated clinical patient database. Proc Annu Symp Comput Appl Med Care. 1990:335–339. [Google Scholar]
- 6.Stead WW, Hammond WE, Straube MJ. A chartless record—Is it adequate? Proc Annu Symp Comput Appl Med Care. 1982:89–94. [Google Scholar]
- 7.Warner HR, Olmsted CM, Rutherford BD. HELP—A program for medical decision-making. Comput Biomed Res. 1972;5(1):65–74. doi: 10.1016/0010-4809(72)90007-9. [DOI] [PubMed] [Google Scholar]
- 8.Cerner’s electronic medical record homepage [Online] 2014 May 4; Available: https://www.cerner.com/solutions/Hospitals_and_Health_Systems/Electronic_Medical_Record/
- 9.Oracle Clinical homepage [Online] 2014 May 4; Available: http://www.oracle.com/us/products/applications/health-sciences/e-clinical/clinical/index.html.
- 10.Oracle Health Sciences Clintrial homepage [Online] 2014 May 4; Available: http://www.oracle.com/us/industries/life-sciences/health-sciences-clintrial-363570.html.
- 11.Brandt CA, Nadkarni P, Marenco L, Karras BT, Lu C, Schacter L, Fisk JM, Miller PL. Reengineering a database for clinical trials management: Lessons for system architects. Control Clin Trials. 2000;21(5):440–461. doi: 10.1016/s0197-2456(00)00070-2. [DOI] [PubMed] [Google Scholar]
- 12.2014 May 4; [Online]. Available: https://metacpan.org/pod/CohortExplorer.
- 13.Harris PA, Taylor R, Thielke R, Payne J, Gonzalez N, Conde JG. Research electronic data capture (REDCap) - a metadata-driven methodology And workflow process for providing translational research informatics support. J Biomed Informat. 2009;42(2):377–381. doi: 10.1016/j.jbi.2008.08.010. [DOI] [PMC free article] [PubMed] [Google Scholar]
- 14.Nadkarni PM. Metadata-Driven Software Systems in Biomedicine: Designing Systems that can Adapt to Changing Knowledge. New York, NY, USA: Springer; 2011. [Google Scholar]
- 15.Brandt C, Morse R, Matthews K, Sun K, Deshpande AM, Gadagkar R, Cohen DB, Miller PL, Nadkarni PM. Metadata-driven creation of data marts from an EAV-modeled clinical research database. Int J Med Informat. 2002;65(3):225–241. doi: 10.1016/s1386-5056(02)00047-3. [DOI] [PubMed] [Google Scholar]
- 16.Agrawal R, Somani A, Xu Y. Storage and querying of E-commerce data. Proc 27th Int Conf Very Large Data Bases. 2001:149–158. [Google Scholar]
- 17.Cunningham C, Graefe G, Galindo-Legaria CA. PIVOT and UNPIVOT: Optimization and execution strategies in an RDBMS. Proc Int Conf Very Large Data Bases. 2004:998–1009. [Google Scholar]
- 18.Lakshmanan LVS, Sadri F, Subramanian SN. On efficiently implementing SchemaSQL on an SQL database system. Proc Int Conf Very Large Data Bases. 1999:471–482. [Google Scholar]
- 19.Lyman JA, Scully K, Harrison JH., Jr The development of health care data warehouses to support data mining. Clin Lab Med. 2008;28(1):55–71. doi: 10.1016/j.cll.2007.10.003. [DOI] [PubMed] [Google Scholar]
- 20.Evans RS, Lloyd JF, Pierce LA. Clinical use of an enterprise data warehouse. Proc AMIA Annu Symp. 2012:189–198. [PMC free article] [PubMed] [Google Scholar]
- 21.Dinu V, Nadkarni PM, Brandt C. Pivoting approaches for bulk extraction of entity-attribute-value data. Comput Methods Programs Biomed. 2006;82(1):38–43. doi: 10.1016/j.cmpb.2006.02.001. [DOI] [PubMed] [Google Scholar]
- 22.Rashid B, Islam MS. Role of materialized view maintenance with PIVOT and UNPIVOT operators. Proc IEEE Int Adv Comput Conf. 2009:951–955. [Google Scholar]
- 23.Chen S, Rundensteiner EA. GPIVOT: Efficient incremental maintenance of complex ROLAP views. Proc Int Conf Data Eng. 2005:552–563. [Google Scholar]
- 24.Garcia-Molina H, Ullman JD, Widom J. Database Systems: The Complete Book. 2. Upper Saddle River, NJ, USA: Prentice-Hall; 2008. [Google Scholar]
- 25.Vitter JS. Algorithms and data structures for external memory. Found Trends Theor Comput Sci. 2006;2(4):305–474. [Google Scholar]
- 26.Nadkarni PM, Marenco LN, Chen R, Skoufos E, Shepherd GM, Miller PL. Organization of heterogeneous scientific data using the EAV/CR representation. JAMIA. 1999;6(6):478–493. doi: 10.1136/jamia.1999.0060478. [DOI] [PMC free article] [PubMed] [Google Scholar]
- 27.Nadkarni PM, Brandt C. Data extraction and ad hoc query of an entity-attribute-value database. J Am Med Informat Assoc. 1998;5(6):511–527. doi: 10.1136/jamia.1998.0050511. [DOI] [PMC free article] [PubMed] [Google Scholar]
- 28.Roy P, Seshadri S, Sudarshan S, Bhobe S. Efficient and extensible algorithms for multi query optimization. Proc ACM SIGMOD Int Conf Manag Data. 2000:249–260. [Google Scholar]
- 29.Sellis TK. Multiple-query optimization. TODS. 1988;13(1):23–52. [Google Scholar]
- 30.Lang CA, Bhattacharjee B, Malkemus T, Padmanabhan S, Wong K. Increasing buffer-locality for multiple relational table scans through grouping and throttling. Proc Int Conf Data Eng. 2007:1136–1145. [Google Scholar]
- 31.Lang CA, Bhattacharjee B, Malkemus T, Wong K. Increasing buffer-locality for multiple index based scans through intelligent placement and index scan speed control. Proc Int Conf Very Large Data Bases. 2007:1298–1309. [Google Scholar]
- 32.Luo G, Naughton JF, Ellmann CJ, Watzke MW. Transaction reordering. Data Knowl Eng. 2010;69(1):29–49. [Google Scholar]
- 33.Saeed M, Villarroel M, Reisner AT, Clifford G, Lehman LW, Moody G, Heldt T, Kyaw TH, Moody B, Mark RG. Multiparameter Intelligent Monitoring in Intensive Care II: A public-access intensive care unit database. Crit Care Med. 2011;39(5):952–960. doi: 10.1097/CCM.0b013e31820a92c6. [DOI] [PMC free article] [PubMed] [Google Scholar]
- 34.Goldberger AL, Amaral LAN, Glass L, Hausdorff JM, Ivanov PC, Mark RG, Mietus JE, Moody GB, Peng CK, Stanley HE. PhysioBank, Physiotoolkit, and physionet: Components of a new research resource for complex physiologic signals. Circulation. 2000;101(23):e215–e220. doi: 10.1161/01.cir.101.23.e215. [DOI] [PubMed] [Google Scholar]