

Abstract
Motor learning is accompanied by widespread changes within the motor cortex, but it is unknown whether these changes are ultimately funneled through a stable corticospinal output channel or if the corticospinal output itself is plastic. We investigated the consistency of the relationship between corticospinal neuron activity and movement through in vivo two-photon calcium imaging in mice learning a lever-press task. Corticospinal neurons exhibited heterogeneous correlations with movement, with the majority of movement-modulated neurons decreasing activity during movement. Individual cells changed their activity across days which led to novel associations between corticospinal activity and movement. Unlike previous observations in layer 2/3, activity accompanying learned movements did not become more consistent with learning, and instead the activity of dissimilar movements became more decorrelated. These results indicate that the relationship between corticospinal activity and movement is dynamic, and the types of activity and plasticity are different from and possibly complementary to layer 2/3.
INTRODUCTION
The ability of the motor cortex to drive movement is presumed to be mediated by a direct projection from a subset of motor cortex neurons to motor circuits within the spinal cord1,2. These corticospinal neurons are located within layer 5B of the motor cortex, but are spatially intermingled with non-corticospinal neurons3. The activity of neurons within the motor cortex has been closely linked to movement both specifically in corticospinal neurons4 and in the general motor cortex population5,6, suggesting its role in guiding ongoing behavior. In particular, the motor cortex has been implicated in motor skill learning7. Behaviorally, this function is evidenced by the requirement of an intact motor cortex to learn new movements8 and a deficit in dexterous and skilled movements following acute motor cortex inactivation9, motor cortical lesions10, and corticospinal tract transection11. Moreover, motor skill learning induces plasticity of the motor cortex at multiple levels, including stimulation-evoked movement maps12, activity of neurons during learned behavior13, and dendritic spine growth and turnover14,15. The organization of the motor cortex according to complex movements further supports the notion that it develops circuits that facilitate learned movements16.
Learning-related plasticity has been demonstrated within many components of motor cortex. Connection strength in the motor cortex changes with motor learning, including inputs from the thalamus17 and intracortical connections18. Learning-dependent dendritic spine growth has also been observed in both superficial19 and deep14 layer motor cortex neurons, including in corticospinal neurons20. These forms of plasticity also depend on and interact with plasticity in local inhibitory interneurons21 and downstream structures like the striatum22. Given this distributed reorganization within the motor cortex, a fundamental question arises as to whether circuits within the cortex operate through a functionally stable output to the spinal cord, or whether the behavioral correlation of corticospinal activity itself changes with motor learning. These two possibilities represent separate schemas of motor cortex plasticity: intracortical circuits could assemble around a consistent output channel, or the output channel itself could be malleable.
Different lines of evidence lend credence to both possibilities. Individual layer 5 neurons within the motor cortex can be associated with specific aspects of movement, and changes in neuronal activity during learning can directly reflect changes in corresponding movements, suggesting a consistent mapping between activity and movement23. Corticospinal cells, a subset of layer 5 neurons, have also been suggested to more consistently relate to movement than other neuronal populations in the motor cortex based on a small number of recorded neurons24. On the other hand, the relationship between movement and layer 5 cells is dynamic during motor learning25, and artificial feedback can alter muscle activity associated with corticospinal activity26. Directly addressing this issue therefore requires specifically monitoring the activity of large ensembles of corticospinal populations and accompanying movements across learning. We approached this using targeted in vivo two-photon calcium imaging in a lever-press task previously used to examine plasticity within layer 2/3 of the motor cortex19. By utilizing Cre-dependent expression of calcium indicators and imaging the apical dendrites of layer 5B corticospinal neurons, we were able to track the activity of corticospinal neurons every day for two weeks while animals learned and performed the task. We found that a subset of neurons was selectively active during movement, but surprisingly a larger number of neurons were selectively active during quiescence. The behavioral correlation of each neuron was plastic, where cells could switch between silent, indiscriminately active, movement-active, and quiescence-active across days. These changes resulted in a dynamic relationship between corticospinal activity and movement kinematics, such that given movements early and late in learning were accompanied by different activity patterns. Moreover, the corticospinal activity patterns accompanying dissimilar movements diverged, but unlike what was seen in layer 2/3, there was no stabilization in activity patterns exhibited during the learned movement. These results indicate that functional plasticity within the motor cortex during learning extends to the corticospinal output.
RESULTS
Two-photon calcium imaging of corticospinal neurons during motor learning
We utilized the Cre/FLEX system to selectively express the calcium indicator GCaMP6f27 in corticospinal cells in the motor cortex. This was achieved by dual injections of two adeno-associated viruses (AAV); an AAV encoding Cre recombinase (AAV2/9-CaMKII-Cre, which can be taken up by axonal terminals and infect neurons projecting to the injected area) into the C7/C8 segments of the spinal cord28 and an AAV encoding Cre-dependent GCaMP6f (AAV2/1-Syn-FLEX-GCaMP6f) into the right caudal forelimb area of the motor cortex (Fig. 1a). The caudal cervical segments of the spinal cord were targeted because they contain motor neurons innervating muscles for forelimb control29, and corticospinal cells projecting to these segments exhibit structural plasticity during the learning of a forelimb motor task20. Fluorescent cells in layer 5B of the motor cortex were observed two weeks after the injections, and these cells projected via the pyramidal tract to the spinal cord (Fig. 1b). Fluorescently-labelled axons were observed in the intermediate and ventral lamina of the cervical spinal cord, consistent with targeting motor circuitry within the spinal cord30. Axons within the corticospinal tract typically did not extend beyond the thoracic spinal cord (3 out of 4 mice), suggesting that labelled cells were specific to forelimb control (Fig. 1c). Many axon collaterals were observed in regions outside of the spinal cord, consistent with reports of these cells projecting to multiple areas31,32 (Fig. 1d).
Figure 1. Corticospinal neuron labeling.
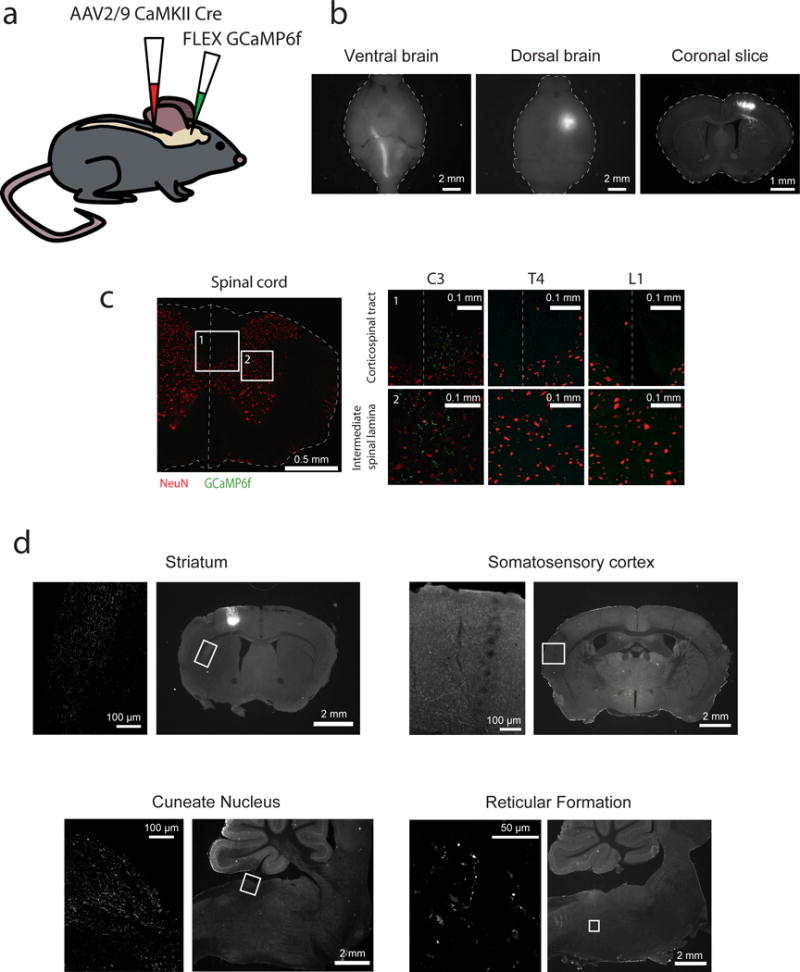
(a) Schematic of injections to selectively express GCaMP6f in corticospinal neurons.
(b) GCaMP6f-expressing cells are located in deep layers of the motor cortex and send axons through the pyramidal tract to the spinal cord. Left: ventral view of the brain. Center: dorsal view of the brain. Right: coronal brain slice including the motor cortex.
(c) GCaMP6f-expressing corticospinal axons terminate in the intermediate lamina of the cervical spinal cord and do not extend to the thoracic or lumbar sections. Left: cervical spinal cord slice stained for NeuN (red) and GCaMP6f (green). Right: zooms of spinal cord slices in cervical (left), thoracic (middle), and lumbar (right) segments, illustrating the corticospinal tract (top row) and the intermediate spinal lamina (bottom row), corresponding to insets 1 and 2 on left.
(d) Corticospinal neurons send collaterals to areas outside of the spinal cord. Left pictures are zoom of insets shown in pictures on right.
GCaMP6f-expressing dendrites were visible in vivo under a two-photon microscope, but somata were too deep to allow for consistent longitudinal imaging. Therefore, we imaged the apical trunks of dendrites passing through layer 2/3. The locations of these apical dendrites were stable across days and the same dendrites could be reliably identified each day (Fig. 2a). As dendrites of corticospinal neurons at various depths could be imaged in a single imaging plane, this approach had an added advantage of capturing larger ensembles of corticospinal neurons compared to imaging at their somata. GCaMP6f fluorescence within these dendrites was observed as bright discrete points in a very low-noise background, allowing for automated region of interest (ROI) creation (Fig. 2b).
Figure 2. Imaging apical dendrites of corticospinal neurons.

(a) Left: coronal section of the motor cortex, illustrating deep corticospinal cells and prominent apical dendrites. Middle: schematic of imaging plane. Right: example in vivo two-photon images of corticospinal dendrites across days, top left blue outlined images are zooms of the central regions outlined in blue. The same corticospinal dendrites could readily be identified each day.
(b) Schematic of automated region-of-interest generation. Left: images are aligned across days (green unfilled circles represent imaged position, green filled circles represent aligned position). Center left: active regions are detected by thresholding across all images from all days (white circles), and the centroids of those regions are stored (red dots). Center right: the shapes of active regions are defined as contiguous pixels which are above threshold on at least 50% of the frames in which the predetermined centroid is above threshold. Right: regions-of-interest are created as the borders of active shapes.
(c) Left: example semi-simultaneous recordings from a corticospinal neuron soma and its four apical dendrite branches. Images are side-projection (left), dendrite plane (top right), and soma plane (bottom right), traces are min-max normalized fluorescence from dendrites (colors correspond to regions of interest) and soma (black). Right: Histogram of L2 normalized fluorescence trace dot product among pairs of dendrites from different neurons (black, non-sibling branches) or the same neuron (blue, sibling branches) maximum normalized within each group. Red dotted line represents cutoff for defining sibling branches in dense imaging.
(d) Example fluorescence traces from dendrite imaging. Indicated blue traces are putative sibling dendrites above the similarity threshold.
In two mice with serendipitously bright and sparsely labelled corticospinal populations, we were able to track some dendrites to their respective somata. In these cases, we were able to image certain somata and their apical dendrites semi-simultaneously by using a piezo-electric motor to rapidly move the objective lens vertically (~3.75 volumes/second, 8 planes/volume). With this approach, we found a high degree of overlap between calcium events in both somata and apical dendritic trunks (484 observed calcium events shared between dendrites and soma, 34 events unique to the soma, and 14 events unique to the dendrites, across 36 neurons. Fig. 2c and Supplementary Fig. 1). We suggest from this that the vast majority of our observed calcium events in apical dendritic trunks are the result of back-propagating action potentials, which are known to induce calcium influx through voltage-gated calcium channels33,34. Therefore, we posit that our apical dendrite signals can serve as a proxy for somatic spiking. This semi-simultaneous imaging of identified soma-dendrite pairs also confirmed that calcium events in sibling branches belonging to the same soma were highly correlated, in agreement with previous reports35 (Fig. 2c and Supplementary Fig. 1). Using data from verified sibling and non-sibling branches, we were able to set a cutoff value for similarity, which was then applied to mice with densely labelled corticospinal populations to categorize dendrites as likely originating from the same or different somata (Fig. 2d). We combined fluorescence traces from presumed sibling branches by weighted averaging (194 ± 68 ‘unique’ corticospinal neurons per mouse from 258 ± 87 imaged dendrites, mean ± s.d.). Calcium events were then detected within baseline-normalized traces through a thresholding process (Methods, Supplementary Fig. 2).
We performed apical dendrite imaging while mice were trained in a cued lever-press task previously used to examine functional and structural plasticity in layer 2/3 of the motor cortex (n = 8 mice)19,21. Mice were trained in the task in approximately one half hour session each day for two weeks. During training, mice were head-fixed under a two-photon microscope and rested their right paw on a stationary block and their left paw on a lever attached to a force transducer (Fig. 3a). Imaging was conducted throughout each training session in the right motor cortex. The displacement of the lever was continuously recorded, allowing for a measurement of movement kinematics. The task structure consisted of a variable inter-trial interval followed by an auditory cue, during which a press of the lever past the threshold produced a brief tone and a water reward. Mice learned this task over the course of two weeks and developed an increasingly stereotyped movement to achieve reward, yet maintained some variability which we take advantage of in later analyses (Fig. 3b, c, Supplementary Fig. 3). In two circumstances where we were able to image dendrites and somata semi-simultaneously across days, we confirmed that activity was reliably shared between compartments throughout learning (Supplementary Fig. 4). Below we describe the activity of corticospinal neurons during the learning of this task, and in several cases we compared corticospinal activity with layer 2/3 activity which was re-analyzed from our previous data (Methods).
Figure 3. Lever press task.
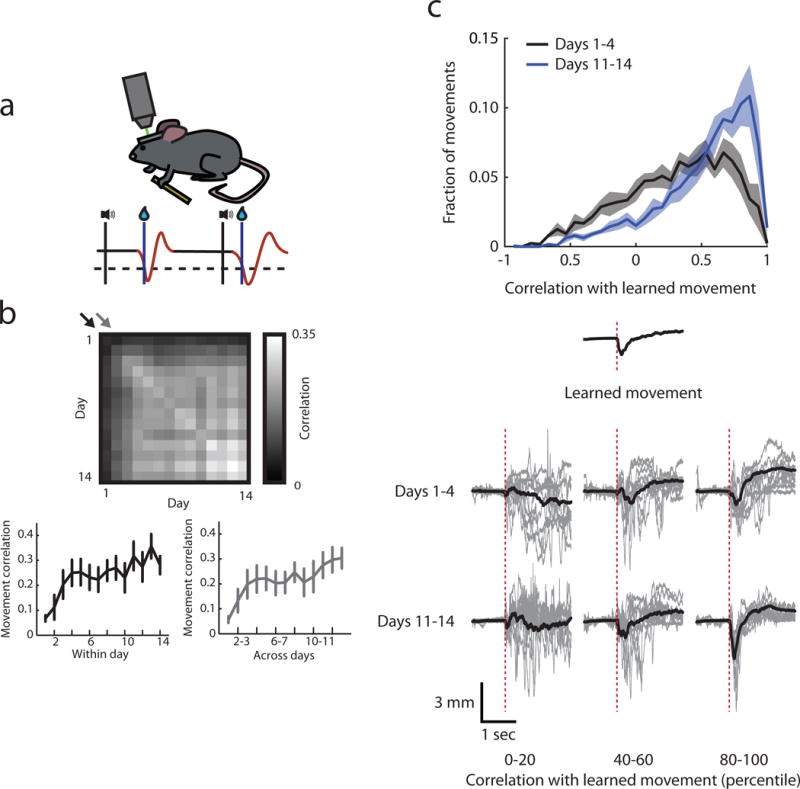
(a) Schematic of task.
(b) Rewarded movement stereotypy increases across days. Top: median correlations between rewarded movements of all pairs of days. Bottom left: rewarded movement correlation within days corresponding to the diagonal of the top plot indicated by the black arrow, movements within days become increasingly stereotyped across time (Pearson’s correlation, r = 0.40, p < 0.001). Bottom right: rewarded movement correlation across adjacent days corresponding to the diagonal of the top plot indicated by the gray arrow, movements across days become increasingly stereotyped across time (Pearson’s correlation, r = 0.39, p < 0.001). Error bars are s.e.m. across animals.
(c) Mice perform one movement (“learned movement”) more often after learning but retain variability. Top: histogram of the correlation between all movements and the learned movement (defined as the average movement across days 11–14) in the early and late stages of learning. Mice produce more movements that look like the learned movement late in learning (two-sample Kolmogorov-Smirnov test, p < 0.001). Creating a template movement from days 1–4 did not result in a shifted distribution across learning (two-sample Kolmogorov-Smirnov test, p = 0.06), indicating that the shift in distribution is not an artifact of creating a template from the later days. Error bars are s.e.m. across animals. Middle: learned movement from an example animal. Bottom: example movements binned by correlation percentile to the learned movement. Gray, single movements, black, average of all movements within bin.
Corticospinal neuron activity is heterogeneously correlated with movement
As a first step to examining the relationship between corticospinal neuron activity and movements, we characterized the activity patterns of individual neurons around movements (Methods). Cells could be active selectively during movement, selectively during quiescence, or active indiscriminately with regards to movement (Fig. 4a), although unexpectedly there were many more cells selectively active during quiescence than movement (Fig. 4b, top). This manifested as a decrease of global population-averaged activity during movement (Fig. 4b, bottom), which was in striking contrast to layer 2/3 which displayed a large increase in population activity during movement (Supplementary Fig. 5a).
Figure 4. Corticospinal neurons are heterogeneously related to movement.
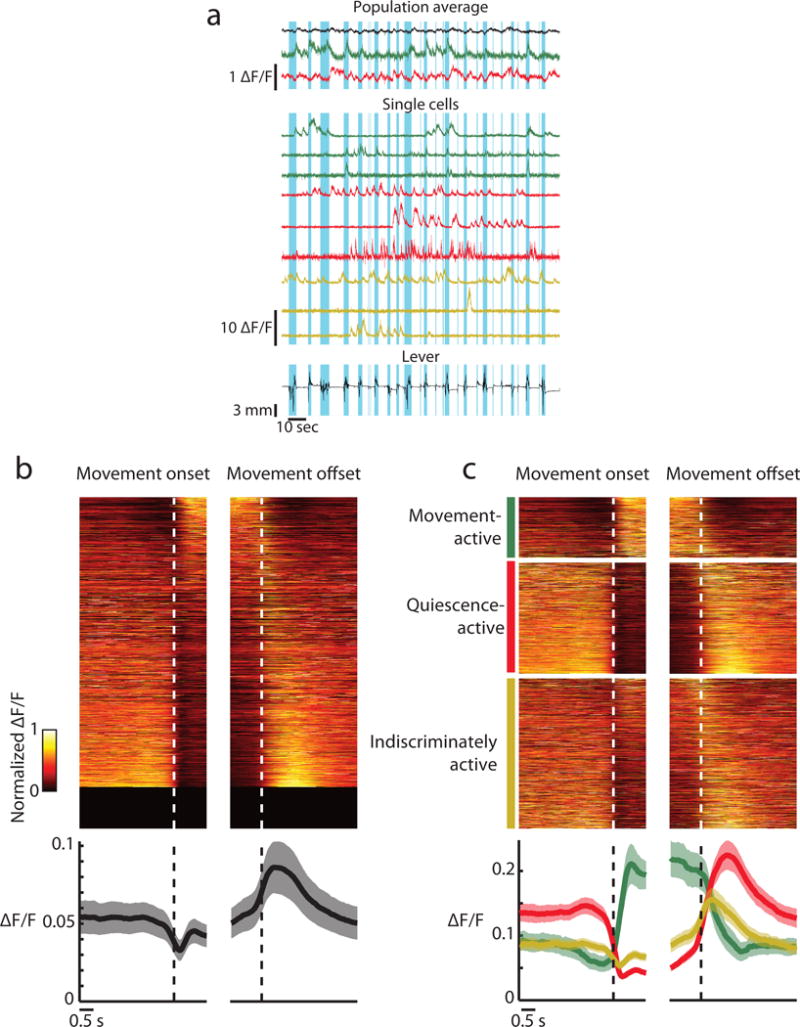
(a) Example activity from a single mouse. Top, population average of all neurons (black), movement-active neurons (green) and quiescence-active neurons (red). Middle, single cells that are movement-active (green), quiescence-active (red) and indiscriminately active (yellow). Bottom, lever movements. Blue highlighted regions represent portions of the lever trace which were detected as movement.
(b) Activity of all cells aligned to movement onset and offset (dashed lines). Top: activity of all recorded cells in all animals min-max normalized for the average within each day then averaged across days (1553 cells), sorted by the coefficient of the first principal component of average activity across cells. Bottom: average activity across all cells, then averaged across animals. Error bars are s.e.m. across animals.
(c) Average activity of active classes of cells aligned to movement onset and offset (dashed lines). Top: activity of all recorded cells that fell into each category on at least one day, min-max normalized within day and then averaged across days with that classification, sorted by the coefficient of the first principal component of average activity across all cells (413 movement-active cells, 760 quiescence-active cells, 1026 indiscriminately active cells). Note that if a cell was classified differently across days, then it will appear under multiple classes and averaged across the days with that classification. Bottom: average activity across all cells of a given classification averaged across days with that classification, then averaged across animals. Error bars are s.e.m. across animals.
We further investigated the heterogeneous response types by classifying cells as either movement-active, quiescence-active, indiscriminately active, or silent (Methods). In accordance with the decrease in population activity around movement, there were roughly twice as many quiescence-active cells than movement-active cells (Fig. 4c, top). Averaging activity within classes established very different response profiles across movement- and quiescence-active cells (Fig. 4c, bottom). In particular, quiescence-active cells showed higher levels of activity during quiescence than movement-active cells. This excludes the possibility that quiescence-active cells and movement-active cells have the same level of spontaneous activity and are suppressed and activated by movement respectively. Furthermore, the quiescence-active population exhibited an increase in activity immediately after movement offset, suggesting a possible post-inhibitory rebound or a function in stopping movement. There were much fewer quiescence-active cells in layer 2/3, although the average activity of each class was similar to corticospinal neurons (Supplementary Fig. 5b). Consequently, more corticospinal than layer 2/3 cells were active during quiescence, however the fraction of active cells during movement was comparable in both populations (Supplementary Fig. 5c).
Corticospinal activity is dynamic across learning
When examining corticospinal populations across time, we found that cells often switched movement-related classification. Individual neurons could move between being active and silent across days, or even switch between movement- and quiescence-active (Fig. 5a). On a daily basis, roughly 50% of cells were active, and there were twice as many quiescence-active and indiscriminately active cells as movement-active cells (Fig. 5b). Interestingly, the fraction of quiescence-active cells increased after the first two days, coinciding with a large increase in movement stereotypy (Fig. 3b). This was the converse of what was observed in layer 2/3, where movement-active cells increased early in learning without a significant change in the fraction of quiescence-active cells (Supplementary Fig. 5d). The classification of individual corticospinal cells was dynamic across days but became more stable for both the movement- and quiescence-active populations later in learning (Fig. 5c).
Figure 5. Relationship between corticospinal activity and movement is dynamic.
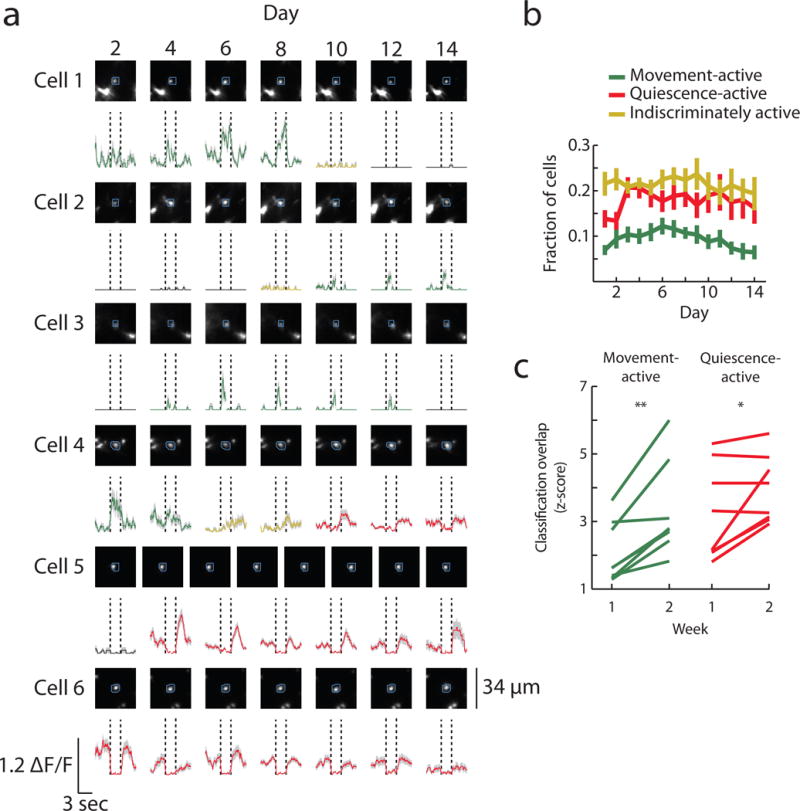
(a) Example classified neurons. Top: maximum projection images from each day, blue circles indicate ROIs. Bottom: average fluorescence traces aligned to movement onset (left vertical black lines) and movement offset (right vertical black lines), green, movement-active; red, quiescence-active; yellow, indiscriminately active; black, silent classification.
(b) Fraction of classified cells across time, error bars are s.e.m. The fraction of quiescence cells increases after the first two days (paired Wilcoxon signed-rank test between the mean of days 1–2 and the mean of days 3–4 after z-scoring all values within animals, p = 0.008).
(c) Mean fraction of neurons with same classification across days, expressed as a z-score relative to shuffling classifications within each day to control for number of classified neurons ((observed value – mean of shuffled values)/(standard deviation of shuffled values)). Both populations are more stable in the second week compared to the first (Wilcoxon signed-rank test, movement-active: p = 0.008, quiescence-active: p = 0.04).
Given the unexpectedly high prevalence of quiescence-active cells and their early increase during learning, we sought to determine whether these cells were related specifically to the task. We carried out a set of experiments in a separate cohort of mice which underwent the same preparations and conditions as mice learning the task, except that water rewards were not dependent on lever presses and were instead given automatically after variable delays following the cue presentation (n = 8 mice). These ‘no-task’ mice still moved the lever just as often as mice engaged in the lever-press task (Supplementary Fig. 6a), even though this was not out of task necessity. These mice also exhibited heterogeneous activity relative to movement; however, the fraction of quiescence-active cells was halved while the fraction of movement-active cells was approximately the same compared to mice engaged in the task (Supplementary Fig. 7b).
The dynamism of activity within single cells prompted us to investigate the activity of movement-modulated neurons across learning. Although neurons could alter their activity over days, over half of the cells maintained their classification between first and second weeks (Fig. 6a, ‘majority classification’). Of the cells that switched classifications across weeks, the transition to newly movement-active was less common than transitions away from movement-active, transitions to newly quiescence-active, and transitions away from quiescence-active (Fig. 6a, ‘majority classification’). In order to determine overarching changes in activity, we quantified the average activity across all cells during all movement or quiescence epochs within each day. This showed a stable level of activity during both quiescence and movement in the first week and a slightly decreasing level of activity during both states in the second week of training (Fig. 6a, ‘average activity’). This decrease in activity in the second week appeared to be more exaggerated for periods around movement onset (Fig. 6a, ‘movement-aligned activity’). The average activity during quiescence did not change in the first few days despite the increase in fraction of quiescence-active cells; this is reminiscent of previous results in which more layer 2/3 neurons became movement-active early in learning, but the average activity during movement was stable as it was balanced by each cell being active less often19.
Figure 6. Changes in activity across time.

(a) Left (majority classification): fraction of all recorded cells divided by their majority classification within weeks (that is, the largest number of days with a given classification. For example, if a cell is classified as movement-active in 3 days and quiescence-active in 2 days of a week, then the cell’s majority classification of the week is movement-active). Center (average activity): average ΔF/F values across all cells during all movement and quiescence epochs. Activity during both movement and quiescence is stable in the first week while activity in both states decreases in the second week (Pearson’s correlation coefficient of values z-scored within animal, movement week 1 r = 0.02, p = 0.9; movement week 2 r = −0.51, p < 0.001; quiescence week 1 r = −0.23, p = 0.1; quiescence week 2 r = −0.26, p = 0.0497). Right (movement-aligned activity): average movement-aligned activity across all cells and across groups of days denoted by colored lines. Error bars are s.e.m. across animals.
(b) Plots as in (a) for different groups of cells according to their classification by week. Cell populations are indicated by pie charts and correspond to cells stably movement-active (top left), stably quiescence-active (top right), switching out of movement-active (center left), switching to movement-active (center right), switching out of quiescence-active (bottom left), and switching to quiescence-active (bottom right). Activity during movement for stably movement-active cells increased in the first week and decreased in the second week, and activity during quiescence for stably quiescence-active cells did not change in the first week and decreased in the second week (Pearson’s correlation coefficient of values z-scored within animal, stably movement-active cells during movement week 1 r = 0.53, p < 0.001; stably movement-active cells during movement week 2 r = −0.48, p < 0.001; stably quiescence-active cells during quiescence week 1 r = 0.14, p = 0.3; stably quiescence-active cells during quiescence week 2 r = −0.53, p < 0.001). Error bars are s.e.m. across animals.
When we analyzed groups of cells separately depending on how they transitioned between classes, we found a number of noteworthy dynamic features. First, the activity of stably movement-active cells during movement increased in the first week and decreased in the second week, and the activity increase was roughly uniformly distributed while activity decrease was biased toward movement onset (Fig. 6b, top left, average activity and movement-aligned activity). Stably quiescence-active cells, on the other hand, maintained consistent levels of activity during the first week and declined in activity during both quiescence and movement in the second week (Fig. 6b, top right, average activity and movement-aligned activity). These changes in stably classified neurons indicate that even consistently modulated cells shape their activity throughout learning.
When we considered cells that switched classification, an interesting asymmetry emerged where cells that transitioned away from being movement-active became quiescence- or indiscriminately active, while cells that transitioned away from being quiescence-active largely became silent (Fig. 6b, middle left and bottom left). Likewise, cells that became newly movement-active were previously silent, while cells that became newly quiescence-active were previously movement- or indiscriminately active (Fig. 6b, middle right and bottom right). This presents the possibility that active cells can be repurposed by transitioning away from movement-active or towards quiescence-active, but the transition towards movement-active or away from quiescence-active involves turning activity on and off entirely.
Learning induces decorrelation in activity accompanying dissimilar movements
A fundamental question is whether these activity changes are due to changes in movements, or whether the relationship between neuronal activity and movement is itself altered. We investigated this by comparing activity patterns that accompanied individual movements across learning. Because mice maintained variability of movements throughout training even with an overall increase in stereotypy (Fig. 3c), pairs of movements could be identified across all days which were similar or dissimilar to each other. For example, a movement on the first day could be similar to some and dissimilar to other movements on the last day. This allowed us to determine the association between activity and movement within and across days.
We found that, both within the early and within the late stages of training, the similarity of activity patterns was related to the similarity of the movements that they accompanied. This was the case in both corticospinal and layer 2/3 neurons (Fig. 7a, black and gray lines). Importantly, we previously found that in layer 2/3, this activity-movement relationship was absent when comparing movements across stages of training, indicating that novel associations between activity and movement developed with learning (Fig. 7a, right, blue line)19. Surprisingly, this same shift in the activity-movement relationship was also observed in corticospinal cells despite their more direct connectivity to movement-generating circuitry (Fig. 7a, left, blue line). Notably, this effect was also observed in the ‘no-task’ animals (Supplementary Fig. 6c, blue line), indicating that this process may be a constant and general feature of the motor cortex. The activity-movement relationship appeared to drift evenly over time in both layer 2/3 and corticospinal cells (Supplementary Fig. 7).
Figure 7. Cell-type-specific differences in the relationship between movement and activity.
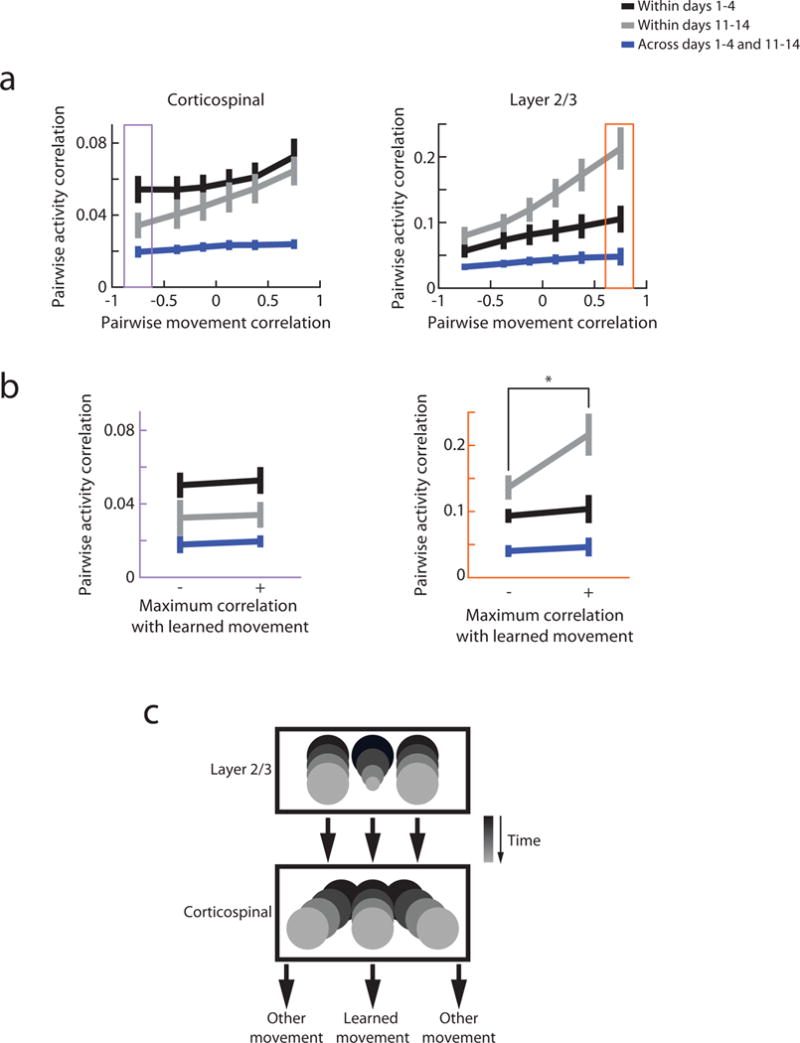
(a) Pairwise correlation in population activity as a function of correlation of accompanying movements. Left; corticospinal, right; layer 2/3. The interaction between movement correlation and activity correlation becomes stronger over time for both corticospinal and layer 2/3 cells (paired Wilcoxon sign-rank test of the fitted slope for black vs. gray lines, corticospinal p = 0.008, layer 2/3 p = 0.02). In corticospinal cells, this derived from less correlated activity for negatively correlated movements (paired Wilcoxon signed-rank test for negatively correlated movement bins for black vs. gray lines, p = 0.009). In layer 2/3 cells, activity became more correlated for similar movements (paired Wilcoxon signed-rank test for positively correlated movement bins for black vs. gray lines, p < 0.001). The activity patterns after learning were novel compared to those before learning (paired Wilcoxon sign-rank test of the fitted slope for gray vs. blue lines, corticospinal p = 0.008, layer 2/3 p = 0.02). Error bars are s.e.m. across animals.
(b) Pairwise correlation in population activity for movements separated by type of movements. Left: pairwise correlation of corticospinal population activity on pairs of trials with dissimilar movements (from data within the purple box in Fig. 7a, left). Correlation in activity does not depend on the type of movement made (paired Wilcoxon signed-rank test, black line p = 0.9, gray line p = 0.4, blue line p = 0.5). Right: pairwise correlation in layer 2/3 population activity on pairs of trials with similar movements (from data within the orange box in Fig. 7a, right). Correlation in activity is higher specifically for learned movements late in learning (paired Wilcoxon signed-rank test, black line p = 0.5, gray line p = 0.02, blue line p = 1). Error bars are s.e.m. across animals.
(c) Schematic of population-specific changes in relationship between activity and movement. Boxes represent spaces of potential activity patterns, circles represent activity patterns which are associated with given movements within each day, and days progress from black to gray. Utilized activity drifts across time in both populations. In layer 2/3 this is accompanied by a more consistent activity pattern specifically for the learned movement (smaller circle). Conversely, in corticospinal neurons, different movements associate with more separable activity patterns (separation of gray circles).
Even though the activity-movement relationship changed in both layer 2/3 and corticospinal neurons, the nature of changes was distinct. Specifically, in layer 2/3, similar movements became associated with increasingly similar activity with training, resulting in a more consistent activity-movement relationship after learning (Fig. 7a, right, black vs. gray lines). In contrast, corticospinal activity did not become more consistent for similar movements, but instead dissimilar movements became associated with more distinct activity patterns (Fig. 7a, left, black vs. gray lines). This change was not observed in the mice that were not engaged in the task, implicating that it is specific to learning (Supplementary Fig. 6c, black vs. gray lines). This suggests that layer 2/3 modifies the degeneracy between activity and movement with learning, while corticospinal cells modify the separability of activity for different movements with learning.
The respective changes could be specific to the learned movement, or otherwise may be relevant for all movements after learning. We considered these alternatives by defining a “learned” movement for each animal as the average movement across the last four days of learning. Each individual movement could then be characterized by its correlation to the learned movement, and because of the behavioral variability, learned-like and learned-unlike movements were identified throughout learning. In layer 2/3, it was indeed the case that activity became more consistent only for learned-like movements in the late stage of training, suggesting specialized changes for the learned movement (Fig. 7b, right, gray line). In corticospinal cells however, the activity for learned-like movements was not any more distinct than for learned-unlike movements, suggesting that activity for the learned movement was not especially unique (Fig. 7b, left, gray line).
All of these effects were not due to variability in the length of sessions (Supplementary Fig. 8a), number of movements (Supplementary Fig. 8b), and relative activity levels of cells (Supplementary Fig. 8c), suggesting that the results are not dominated by within-day changes like fatigue or by especially active cells. Together, these results suggest that the relationship between activity and movement drifts across time in both layer 2/3 and corticospinal neurons in complementary ways: layer 2/3 develops a robust activity pattern specifically for the learned movement, while corticospinal activity maintains variability but increases separability for different movements (Fig. 7c).
DISCUSSION
The motor cortex is thought to play a fundamental role in motor learning and is capable of extensive plasticity. It has been unclear however whether activity within the motor cortex operates through a stable output to the spinal cord, or whether the corticospinal output of the motor cortex is itself plastic. We addressed this issue by developing a methodology to longitudinally image the activity of corticospinal neuron populations across learning. We found that certain corticospinal neurons were active selectively during movement while a larger fraction of corticospinal neurons were selectively active during quiescence. Moreover, the activity of corticospinal neurons was dynamic across days, where different cells were active during movement or quiescence. These changes ultimately lead to novel associations between corticospinal activity and movement. Interestingly, the changing relationship between activity and movement in corticospinal neurons was seen in both task and no-task animals, while task learning specifically induced a decorrelation of activity across dissimilar movements. We note, however, that our no-task mice are not completely free of learning, as they are put in a novel environment under head fixation with a lever. Therefore, it is possible that these animals still exhibit certain learning-related changes.
Heterogeneity of corticospinal activity
The observation that corticospinal neurons can be either active selectively during movement or quiescence corroborates previous findings dating back to the earliest recordings of motor cortex activity36. Moreover, it has been suggested that quiescence-active neurons are found exclusively in intermediate and deep layers of the motor cortex5, reinforcing our observed differences between previously recorded layer 2/3 activity19 and layer 5B corticospinal cells. We report here a larger fraction of quiescence-active neurons than typically reported in the motor cortex5,25, such that the population-average activity of corticospinal neurons decreases during movement. While the reason for this apparent discrepancy is unclear, one possibility is that this balance is specific to corticospinal neurons and not the general deep layer population, or that the movement in our task was particularly effective in eliciting activity during quiescence. As we demonstrated in the ‘no-task’ mice, not all movements elicit the same balance of activity.
The diversity of corticospinal activity may not be unexpected given the heterogeneity of the cellular properties within the corticospinal neuron population37,38. The functions of different response types and their relationship to heterogeneity in cellular properties, however, are unknown. It is possible that movement- and quiescence-active corticospinal cells have unique descending connections or other intrinsic differences, and are effectively segregated into unique subtypes. Towards this end, it has been observed that axonal conduction velocity36 and response to neuromodulators39 can differ between corticospinal cells with different response types. On the other hand, movement- and quiescence-active cells might not be independent cellular subtypes but may instead have flexible roles in circuit dynamics. This notion is supported by the observations that corticospinal cells can switch between movement- and quiescence-active responses for different types of movements within a day40 and across days (this study). The function of activity during quiescence has yet to be deduced, however it may be involved in specifically halting movement as suggested by work on the vibrissa motor cortex41, or otherwise it may be an inherent aspect of generating activity with particular dynamics6,42.
Motor cortex output is flexibly associated with movement
A main finding from the current work is that corticospinal activity changes with time to create a novel relationship between activity and movement. We previously found this same phenomenon in layer 2/319, and extending this result to corticospinal neurons indicates that the motor cortex does not utilize a consistent functional output. We note that this flexibility does not necessitate a corresponding change in how downstream motor circuitry is influenced by motor cortical input. It is possible, for example, that the relationship between corticospinal and spinal cord activity is stable but degenerate, where one subset of possible activity patterns for a given movement is observed before learning and another subset after learning. Indeed, it has been documented that motor cortex can reversibly switch between multiple activity states43, and activity of a given muscle can be accompanied by different patterns of motor cortex activity based on the context of movement both generally in the motor cortex44 and specifically in corticospinal neurons45,46. It should also be noted that not all motor cortex activity generates movement, and indeed population activity can evolve within ‘movement-null’ space without overt effects on movement42.
A drift across a space of functionally degenerate activity is supported by recent work in zebra finches, where a stereotyped song was accompanied by a changing pattern of premotor activity across days, while inhibitory interneuron activity and the local field potential retained consistent patterns47. It was suggested by the authors that drifts in population activity may actively develop degeneracy, contributing to a more robust circuit that can tolerate input noise and output variability, which nevertheless relates to stable motor output. Our results are consistent with this finding, suggesting that activity drifts may be a common principle across species. Such degeneracy could be beneficial because it requires less reliance on any given collection of neurons, making the system more robust to noise and insult. Alternatively, it might be important to allow for a movement to be associated with multiple inputs. For example, a given forelimb movement may be triggered by many different sensory inputs, in many different contexts, and towards many different aims. It may be maladaptive to have only one required “target” pattern of output activity that must be generated in each of these cases; instead, degeneracy may allow for each of these contexts to utilize one of many possible activity patterns to produce the same movement. It will therefore be an important issue in the future to differentiate degeneracy that is stable over time from remapping between motor cortex activity and movement.
Another possible functional benefit of activity drifts relates to the fundamentally dynamic nature of motor systems. The demands of motor systems constantly change based on many factors, including muscle fatigue, muscle strengthening, injury, and external forces as subtle as a long sleeve shirt or heavy shoes. Accordingly, the motor control system may always maintain variability of representations so that it can adapt to unpredictable changes.
The relationship between movement similarity and activity similarity became stronger for both layer 2/3 and corticospinal neurons, but in opposite ways. In layer 2/3, this occurred through increasingly consistent activity patterns especially for the learned movement, while corticospinal cells acquired more distinct activity patterns for dissimilar movements in general. This suggests possible complementary roles for layer 2/3 and corticospinal cells, with layer 2/3 establishing learned patterns of activity which feed into a corticospinal system that retains degeneracy while separating spaces of activity for different movements. These components together could make up a circuit which establishes consistent interpretations of important inputs, uses that to operate a flexible output command, and ensures that the range of output commands are sufficiently differentiable by downstream targets. It will be of interest to determine how these changes are then carried downstream, especially given that descending corticospinal connectivity is known to be malleable48–50.
These results together suggest a picture of a constantly evolving relationship between motor cortex activity and movement which is shaped by both time and learning.
METHODS
Animals
All procedures were in accordance with protocols approved by the UCSD Institutional Animal Care and Use Committee and guidelines of the National Institutes of Health. All mice were male and acquired from Charles River Laboratory (C57Bl/6 wild type). All surgeries and experiments were carried out in adult mice (6 weeks or older). All animals were group housed before surgery and singly housed afterwards in disposable plastic cages with standard bedding, nestlets, and a running wheel and kept in a room on a reversed light cycle (12 hour). All experiments were performed at approximately the same time each day during the dark period.
Surgery
Surgeries consisted of two consecutive parts, the first being a spinal cord injection and the second being cortical injection and cranial window preparation. Mice were anesthetized with isoflurane and fixed on a bite bar with a nose clamp over a heating pad. The back was shaved from below the shoulder blades to the top of the neck and cleaned with iodine and alcohol. A midline incision was made in the skin from below the shoulder blades to the middle of the neck. Fat tissue was removed as necessary to expose the trapezius muscles. The trapezius muscles were then cut along the midline at the shoulder blades to expose the spine. The spinous process on the T2 vertebra was identified and separated from attached musculature. The spine was then fixed using custom metal wedges held by a stereotaxic frame. This was accomplished by lifting the spine from the T2 spinous process while placing the wedges under the trapezius muscles to support the spine from underneath. Fat tissue over the spine was then removed and muscles directly overlying the spine were cut. A laminectomy was performed in the range of the C7 to C5 vertebrae, exposing the C6 to C8 segments of the spinal cord. A viral solution of AAV2/9-CaMKII-Cre (University of Pennsylvania Vector Core Facility) was injected into two sites on the left side of the spinal cord, each injection being 200 nl and placed 400 μm from the midline, 700 μm from the surface, and separated by 600 μm rostrocaudally. After injecting, the wedges fixing the spine were removed, the trapezius was sutured with 5–0 vicryl sutures, and the skin was sutured with 5–0 silk sutures. Immediately after the spinal cord injections, cortical injections and cranial windows were then prepared as previously described19. Skin overlying the skull was removed, the skull was scraped clean, and a custom headplate was glued to the skull and fixed with dental cement. A craniotomy was then performed over the right caudal forelimb area of the motor cortex as stereotaxically defined51. A viral solution of 1:4 diluted AAV2/1-Syn-FLEX-GCaMP6f (University of Pennsylvania Vector Core Facility) was injected into the cortex in five sites in a plus shape, each injection being 40 nl and placed 700 μm from the surface, separated by 500 μm, and centered at 1500 μm lateral and 300 μm anterior from bregma. A glass window consisting of a base and concentrically attached smaller plug was held against the skull and brain respectively, the gap between plug and skull was filled with 1.5% agarose, and the base was fixed in place with dental cement. Baytril (10 mg/kg) and buprenorphine (0.1 mg/kg) was injected subcutaneously at the end of surgery. Animals did not display motor detriments following surgery, and were often observed running on their wheels within one day of surgery.
Behavior
Animals were trained in a lever-press task as previously described19. Mice were water restricted at 1–2 ml per day beginning three days after surgery for two weeks prior to training. Mice were then trained in the lever-press task during two-photon imaging for one session per day lasting approximately one half hour. Mice rested their body and hindlimbs in a tube, and placed their right forelimb on a stable block and their left forelimb on a movable lever. The lever consisted of a handle glued to a piezoelectric flexible force transducer (LCL-113G, Omega Engineering). Voltage from the force transducer, which was linearly proportional to the lever displacement, was continuously monitored using a data acquisition device (LabJack) and software (LabVIEW, National Instruments). Presses of the lever were defined as displacement through two thresholds within a short time (~1.5mm to ~3mm below resting position within 200 ms). Task structure consisted of a variable inter-trial interval followed by a cue period during which lever presses triggered water reward. Cue periods and rewards were paired with separate tones, and a failure to press the lever within the cue period resulted in a short burst of white noise. The cue period was reduced during the first two sessions from 30 s to 10 s, and the inter-trial interval was increased during the first three sessions from 2–4 s, to 5–7 s, to 8–12 s to encourage discrete movements.
Mice in the no-task condition underwent the same preparations, training, and task structure as defined above, except that water rewards were not contingent on lever press and instead were delivered on every trial after 0.5–2 seconds of the cue tone.
Immunofluorescence
Mice were anesthetized and transcardially perfused with ice-cold 0.1 M PBS (pH 7.4), followed by a perfusion with ice-cold 4% paraformaldehyde (PFA) solution. Isolated brains and spinal cord were postfixed overnight at 4°C in 4% PFA and cryoprotected in 30% sucrose solution for at least 24 h at 4°C.
Microtome-cut (Thermo Scientific Microm HM 430) 60 μm free-floating brain (coronal) and brainstem (sagittal) sections were collected in PBS and stored at 4°C. Cryostat-cut (Leica CM 1900) 20 μm spinal cord sections were collected on microscopy slides (Fisherbrand Superfrost Plus) and stored at −80°C.
Antibodies were diluted in staining buffer consisting of 0.1% (wt/vol) bovine serum albumin (BSA, OmniPur) and 0.3% (vol/vol) TritonX-100 (Alfa Aesar) in PBS. Primary antibodies were incubated overnight at 4°C followed by a 3 times wash step in PBS. Secondary antibodies were incubated for 1h at RT followed by a 3 times wash step in PBS. Tissue was mounted using CC/Mount (Sigma). Primary antibodies used were guinea pig anti NeuN (1:1000, Synaptic Systems, No. 266004) and chicken anti GFP (1:400, Aves, No. 1020). Secondary antibodies used were goat anti guinea pig Alexa 594 (1:1000, Invitrogen, A11076) and goat anti chicken Alexa 488 (1:1000, Invitrogen, A11039).
Images of brain and spinal cord sections were taken with Zeiss Imager M2 with the Apotome.2 attachment controlled with the AxioVision 4.8 software. Adjacent images were stitched with Microsoft Image Composite Editor Version 1.4.4.0 and color levels were post-processed using Adobe Photoshop CS6.
Two-photon imaging
Two-photon imaging was conducted through a 16x, 0.8 NA objective (Nikon) mounted to a commercial two-photon microscope (B-scope, Thorlabs) and using a 925 nm laser (Ti:Sapphire laser, Newport). Images were acquired with Scanimage 4.1 (Vidrio Technologies) at a rate of ~28 Hz, covering ~340 μm × 340 μm with 512×512 square pixels. Frame triggers, lever voltage, and the start times of trials were recorded with Ephus (Vidrio Technologies), allowing for alignment between behavior and imaging. Drifts in the imaging field during imaging were manually monitored and corrected. Images were motion corrected offline by maximizing 2D cross correlation between raw images and an average reference image. For semi-simultaneous dendrite and soma imaging, a z-stack was first collected consisting of 51 slices spanning 400 μm to identify dendrite branches and corresponding somata, with each slice being an average of 100 motion corrected frames. Multiple z-planes were then imaged simultaneously using a piezo mounted to the objective (Physik Instruments). Eight z-planes separated by 50 μm were used to allow sufficient time for the piezo to travel the full range of 400 μm.
Automated region of interest generation
Hundreds of dendrites were imaged within each field which could be sparsely active, motivating the use of automated region of interest generation (Fig. 2b). This was done by first registering maximum projections from all sessions together through affine alignment to account for slight differences in fields across days. All subsequent steps were performed on movies smoothed by 50-frame moving averages. Each frame was registered according to the affine transformation matrices calculated during session alignment, ensuring that each pixel across the experiment represented the same location in the brain. Any pixels along the edges that were not imaged within and across all sessions were not used any further. Active portions of the field were then defined on a frame-by-frame basis across the entire experiment by subtracting the average image within each session from all frames of that session, and thresholding the average-subtracted frames by one standard deviation of all average-subtracted pixel values. Dendrites were often closely neighboring and point spread resulted in overlapping thresholded regions across dendrites, so that time-invariant thresholding was not informative. Instead, we took advantage of the temporal diversity of activity across dendrites to define co-varying thresholded pixels. Our approach was similar in intent to methods using independent components analysis (ICA), however we found ICA to be insensitive and not easily and accurately segmentable, while our method detailed below was highly sensitive and able to segment the images cleanly as verified by visual inspection.
We began by finding the centroids of all discrete active spots within each frame and summing all active centroids across the entire experiment. Active spots corresponding to a single dendrite could expand and retract depending on the fluorescence amplitude due to point spread, but because the point spread function is symmetrical the centroid remained relatively constant. Because of this, even very closely neighboring dendrites had separate clusters of active centroids. Clusters of active centroids were then reduced to a single local maximum, representing the centers of all objects which were ever active during the experiment. The shapes of dendrites corresponding to those centroids were then determined by finding all frames when a centroid was active, and a border was drawn over connected pixels that were over threshold on at least half of all centroid-active frames. These borders defined regions of interest (ROI) which were then refined. Any ROIs which occupied less than 10 pixels were dilated by 1 pixel. ROIs which overlapped by greater than 50% were usually the same dendrite detected twice or two dendrites which had both common and unique ROIs. The larger of the two ROIs, which was therefore either redundant or combined dendrites, was excluded. Pixels which were contained in two or more ROIs, in addition to a buffer of 1 pixel around these overlap zones, were removed to reduce contamination between ROIs. ROIs were then dilated by 1 pixel and resulting overlap was removed, ensuring a buffer zone between immediately neighboring ROIs. Any remaining ROIs occupying less than 5 pixels or not encircling an originally defined active centroid were deleted. Finally, ROIs were affine aligned to each session through the inverse of the transformation matrices used to align sessions. Any ROIs not fully within the imaging field in every session were deleted.
ROIs were visually inspected by aligning the maximum projections for each day and manually discarding ROIs that were not stably visible through all days or were from laterally-oriented processes.
Fluorescence analysis
Traces for each ROI were created by averaging enclosed pixels and subtracting background fluorescence. Background subtraction was critical for extracting the activity of single dendrites, as the signal from neighboring dendrites could invade an ROI. Within each raw imaging frame, background signal was estimated by interpolating fluorescence values across each ROI from the surrounding fluorescence (inpaint_nans MATLAB function, J. D’Errico, MATLAB File Exchange). Two traces were then produced for each ROI, one averaging the raw ROI pixels and one averaging the background-estimated ROI pixels. The changes in fluorescence (∆F as defined below) of the background trace was then subtracted from the raw trace, producing a final background-subtracted trace. This process errs on the side of over-estimating background signal because the point spread function decreases superlinearly from the source but interpolation was linear, and because some signal originating from within the ROI was included. The amplitudes of calcium events are therefore somewhat reduced, but contaminating signals are effectively eliminated.
The background-subtracted fluorescence trace for each ROI was then normalized to units of ∆F/F0, where F0 represents a continuously-defined baseline. Baseline estimation was performed as previously described19. Briefly, a recursive process identified and removed portions of the trace which were active. The resulting “inactive” trace was then loess smoothed and interpolated across active periods, producing a time-varying baseline. The normalized trace was calculated by subtracting the baseline trace from the raw trace and dividing the difference by the baseline trace.
Apical dendrites often have multiple branches within the superficial layers, which led us to combine the traces of ROIs with very similar activity which likely originated from the same cell. Activity similarity between ROIs was calculated by the dot product of baseline-normalized traces loess smoothed with a 3.4 second window within each session and L2 normalized across all sessions. Based on the semi-simultaneous imaging of somata and their dendrites (Supplemental Figure S1), any ROI groups with a normalized dot product over 0.8 were considered putative sibling branches. Final traces for each neuron were derived by weighted averaging of all sibling branch traces according to their across-session L2 norm to take advantage of the highest signal to noise ratios. Each “cell” in further analysis can therefore correspond either to a single ROI or combined sibling branch ROIs.
Baseline-normalized fluorescence traces within ROIs were subject to calcium event detection in order to remove signals within the trace caused by calcium indicator dynamics instead of neuronal activity (Supplementary Fig. 2). Two thresholds were defined, one being 3 times the noise to find active portions and the other being 1 times the noise to define baseline. Noise was estimated as the standard deviation of negative fluorescence values mirrored about zero to simulate the noise distribution. Active portions of the trace were identified by a 1-second loess smoothed trace crossing the active threshold and extended backwards to begin when the baseline threshold was last crossed by the unsmoothed trace. Periods of the smoothed trace with negative slopes during active portions were set to inactive to eliminate fluorescence changes not associated with action potentials. All remaining active portions were considered calcium events and set to the difference between the maximum and minimum values within each event, with all other points set to zero.
Layer 2/3 data
All analyses involving layer 2/3 were performed on previously published data19, with fluorescence thresholding updated to utilize the method described above and classification updated to utilize the method described below.
Movement analysis
Voltage from the piezoelectric lever was continuously recorded at 10 kHz during each session and parsed into movement and quiescence epochs as previously described19. Briefly, movement was first identified by velocity threshold. Movement epochs were then refined by combining nearby epochs, eliminating small epochs, and refining the start and end times of movement epochs according to when the lever position respectively left or entered a baseline defined by adjacent quiescent epochs. Visual inspection confirmed accurate demarcation of behavior.
In order to utilize the fullest extent of data, movements used for analyses were not restricted to only those movements which led to a reward. In this case, movements which were made during the inter-trial interval or unsuccessful movements during the response period were also analyzed. For analyses involving extraction of individual movements and accompanying activity, only movements longer than 2 seconds and with at least 1 second of preceding quiescence were used, and only the first 2 seconds of those movements and accompanying activity were analyzed.
Movement-related classification
Cells were classified as movement-active or quiescence-active on each day. The fraction of movement frames which contained activity in each ROI was first calculated. This value was compared to a shuffled distribution, where movement and quiescence epochs were kept intact but shuffled relative to each other 10,000 times. Activity during shuffled movement epochs was compared to activity during actual movement epochs. Actual values that were above the 97.5 percentile of the shuffled distribution were classified as movement-active while actual values that were below the 2.5 percentile of the shuffled distribution were classified as quiescence-active.
Among the cells that did not classify as movement-active or quiescence-active, those which had both an average ΔF/F and number of fluorescence events above the 5th percentile for those of classified cells were considered indiscriminately active. A minimum of 5 fluorescence events was imposed to define any cell as active, and cells not fitting these criteria were classified as silent.
Stability of classification (Fig. 5c) was defined by z-score in order to control for differing total number of classified cells on each day. This was done by creating a chance distribution of overlap by shuffling classification across all cells 1000 times, and calculating the z-scored overlap as (real overlap – shuffled overlap mean)/shuffled overlap standard deviation.
Pairwise activity correlation analysis
For analyses comparing population activity accompanying movement, (Fig. 7a, b, Supplementary Fig. 6c, Supplementary Fig. 7, Supplementary Fig. 8) the first 2 seconds of movement and activity were extracted for all movements which lasted longer than 2 seconds and had at least 1 second of preceding quiescence regardless of whether they were rewarded movements or not. Pairwise activity correlation was calculated by concatenating the temporal activity of all cells during the corresponding movement and finding the Pearson’s correlation coefficient between pairs of these population activity vectors. The correlation between corresponding pairs of movements was calculated as the Pearson’s correlation coefficient of lever trajectories.
For analyses relating to the type of movement performed (Fig. 7b), the “learned” movement was defined as the average lever trajectory across all movements from days 11–14. Each movement was then correlated to the learned movement, and pairs of movements were segregated by having a positive or negative maximum correlation with the learned movements.
Statistics
Statistical tests were chosen to avoid assumptions about data distributions, therefore data was not tested for normality. All corticospinal data uses n = 8 animals for all days, layer 2/3 data has n = 7 for days 1–11, 6 for days 12–13, and 5 for day 14. No statistical methods were used to pre-determine sample sizes but our sample sizes are similar to those reported in previous publications19. No randomization was used, mice used for layer 2/3 cells were from a previous experiment, mice used for corticospinal cells learning the task were prepared first in this experiment, and mice used for corticospinal cells not learning the task were prepared second in this experiment. No blinding was used because no blinding was possible with our experimental structure.
Supplementary Material
Acknowledgments
We thank A. Kim and L. Hall for technical assistance, and current and former members of the Komiyama lab, especially S. Chen, J. Dahlen, B. Danskin, and H. Liu for comments and discussions. This research was supported by grants from NIH (R01 DC014690-01, R21 DC012641, R01 NS091010A, U01 NS094342 and R01 EY025349), Human Frontier Science Program, Japan Science and Technology Agency (PRESTO), New York Stem Cell Foundation, David & Lucile Packard Foundation, Pew Charitable Trusts and McKnight Foundation to T.K. A.J.P. was supported by the Neuroplasticity of Aging Training Grant (AG000216), a Newton International fellowship, a Human Frontier Science Program fellowship, and an EMBO fellowship. J.L. was supported by the Swiss National Science Foundation. T.K. is a NYSCF-Robertson Investigator.
Footnotes
Data and code availability
The data collected for this study and code used for analyses are available upon request from the corresponding author.
CONTRIBUTIONS
Conceptualization, AJP and TK; Methodology for spinal cord injections and histology investigation, JL; Longitudinal simultaneous dendrite and soma imaging, NHG and KL; Other methodology and investigation, AJP; software and writing – original draft, AJP; Analysis, AJP and TK; Writing – review & editing, AJP and TK; Supervision and funding acquisition, TK.
References
- 1.Heffner R, Masterton B. Variation in form of the pyramidal tract and its relationship to digital dexterity. Brain Behav Evol. 1975;12:161–200. doi: 10.1159/000124401. [DOI] [PubMed] [Google Scholar]
- 2.Armand J. The origin, course and terminations of corticospinal fibers in various mammals. Prog Brain Res. 1982;57:329–60. doi: 10.1016/S0079-6123(08)64136-9. [DOI] [PubMed] [Google Scholar]
- 3.Oswald MJ, Tantirigama MLS, Sonntag I, Hughes SM, Empson RM. Diversity of layer 5 projection neurons in the mouse motor cortex. Front Cell Neurosci. 2013;7:174. doi: 10.3389/fncel.2013.00174. [DOI] [PMC free article] [PubMed] [Google Scholar]
- 4.Evarts EV. Relation of pyramidal tract activity to force exerted during voluntary movement. J Neurophysiol. 1968;31:14–27. doi: 10.1152/jn.1968.31.1.14. [DOI] [PubMed] [Google Scholar]
- 5.Isomura Y, Harukuni R, Takekawa T, Aizawa H, Fukai T. Microcircuitry coordination of cortical motor information in self-initiation of voluntary movements. Nat Neurosci. 2009;12:1586–93. doi: 10.1038/nn.2431. [DOI] [PubMed] [Google Scholar]
- 6.Churchland MM, et al. Neural population dynamics during reaching. Nature. 2012;487:51–6. doi: 10.1038/nature11129. [DOI] [PMC free article] [PubMed] [Google Scholar]
- 7.Sanes JN, Donoghue JP. Plasticity and primary motor cortex. Annu Rev Neurosci. 2000;23:393–415. doi: 10.1146/annurev.neuro.23.1.393. [DOI] [PubMed] [Google Scholar]
- 8.Kawai R, et al. Motor Cortex Is Required for Learning but Not for Executing a Motor Skill. Neuron. 2015:1–13. doi: 10.1016/j.neuron.2015.03.024. [DOI] [PMC free article] [PubMed] [Google Scholar]
- 9.Guo JZ, et al. Cortex commands the performance of skilled movement. Elife. 2015;4:1689–1699. doi: 10.7554/eLife.10774. [DOI] [PMC free article] [PubMed] [Google Scholar]
- 10.Ramanathan D, Conner JM, Tuszynski MH. A form of motor cortical plasticity that correlates with recovery of function after brain injury. Proc Natl Acad Sci U S A. 2006;103:11370–5. doi: 10.1073/pnas.0601065103. [DOI] [PMC free article] [PubMed] [Google Scholar]
- 11.Whishaw IQ, Pellis SM, Gorny B, Kolb B, Tetzlaff W. Proximal and distal impairments in rat forelimb use in reaching follow unilateral pyramidal tract lesions. Behav Brain Res. 1993;56:59–76. doi: 10.1016/0166-4328(93)90022-i. [DOI] [PubMed] [Google Scholar]
- 12.Kleim JA, Barbay S, Nudo RJ. Functional reorganization of the rat motor cortex following motor skill learning. J Neurophysiol. 1998;80:3321–5. doi: 10.1152/jn.1998.80.6.3321. [DOI] [PubMed] [Google Scholar]
- 13.Kargo WJ, Nitz DA. Improvements in the signal-to-noise ratio of motor cortex cells distinguish early versus late phases of motor skill learning. J Neurosci. 2004;24:5560–9. doi: 10.1523/JNEUROSCI.0562-04.2004. [DOI] [PMC free article] [PubMed] [Google Scholar]
- 14.Xu T, et al. Rapid formation and selective stabilization of synapses for enduring motor memories. Nature. 2009;462:915–9. doi: 10.1038/nature08389. [DOI] [PMC free article] [PubMed] [Google Scholar]
- 15.Yang G, Pan F, Gan WB. Stably maintained dendritic spines are associated with lifelong memories. Nature. 2009;462:920–4. doi: 10.1038/nature08577. [DOI] [PMC free article] [PubMed] [Google Scholar]
- 16.Graziano MSA. Ethological Action Maps: A Paradigm Shift for the Motor Cortex. Trends Cogn Sci. 2016;20:121–132. doi: 10.1016/j.tics.2015.10.008. [DOI] [PubMed] [Google Scholar]
- 17.Biane JS, Takashima Y, Scanziani M, Conner JM, Tuszynski MH. Thalamocortical Projections onto Behaviorally Relevant Neurons Exhibit Plasticity during Adult Motor Learning. Neuron. 2016;89:1173–1179. doi: 10.1016/j.neuron.2016.02.001. [DOI] [PMC free article] [PubMed] [Google Scholar]
- 18.Rioult-Pedotti MS, Friedman D, Hess G, Donoghue JP. Strengthening of horizontal cortical connections following skill learning. Nat Neurosci. 1998;1:230–4. doi: 10.1038/678. [DOI] [PubMed] [Google Scholar]
- 19.Peters AJ, Chen SX, Komiyama T. Emergence of reproducible spatiotemporal activity during motor learning. Nature. 2014;510:263–7. doi: 10.1038/nature13235. [DOI] [PubMed] [Google Scholar]
- 20.Wang L, Conner JM, Rickert J, Tuszynski MH. Structural plasticity within highly specific neuronal populations identifies a unique parcellation of motor learning in the adult brain. Proc Natl Acad Sci U S A. 2011;108:2545–2550. doi: 10.1073/pnas.1014335108. [DOI] [PMC free article] [PubMed] [Google Scholar]
- 21.Chen SX, Kim AN, Peters AJ, Komiyama T. Subtype-specific plasticity of inhibitory circuits in motor cortex during motor learning. Nat Neurosci. 2015;18:1109–1115. doi: 10.1038/nn.4049. [DOI] [PMC free article] [PubMed] [Google Scholar]
- 22.Koralek AC, Jin X, Long JD, II, Costa RM, Carmena JM. Corticostriatal plasticity is necessary for learning intentional neuroprosthetic skills. Nature. 2012:1–5. doi: 10.1038/nature10845. [DOI] [PMC free article] [PubMed] [Google Scholar]
- 23.Kargo WJ, Nitz DA. Early skill learning is expressed through selection and tuning of cortically represented muscle synergies. J Neurosci. 2003;23:11255–69. doi: 10.1523/JNEUROSCI.23-35-11255.2003. [DOI] [PMC free article] [PubMed] [Google Scholar]
- 24.Masamizu Y, et al. Two distinct layer-specific dynamics of cortical ensembles during learning of a motor task. Nat Neurosci. 2014:1–11. doi: 10.1038/nn.3739. [DOI] [PubMed] [Google Scholar]
- 25.Costa R, Cohen D, Nicolelis M. Differential corticostriatal plasticity during fast and slow motor skill learning in mice. Curr Biol CB. 2004;14:1124–1134. doi: 10.1016/j.cub.2004.06.053. [DOI] [PubMed] [Google Scholar]
- 26.Nishimura Y, Perlmutter SI, Eaton RW, Fetz EE. Spike-Timing-Dependent Plasticity in Primate Corticospinal Connections Induced during Free behavior. Neuron. 2013:1–9. doi: 10.1016/j.neuron.2013.08.028. [DOI] [PMC free article] [PubMed] [Google Scholar]
- 27.Chen TW, et al. Ultrasensitive fluorescent proteins for imaging neuronal activity. Nature. 2013;499:295–300. doi: 10.1038/nature12354. [DOI] [PMC free article] [PubMed] [Google Scholar]
- 28.Wahl AS, et al. Asynchronous therapy restores motor control by rewiring of the rat corticospinal tract after stroke. Science. 2014;344:1250–5. doi: 10.1126/science.1253050. [DOI] [PubMed] [Google Scholar]
- 29.Bácskai T, et al. Musculotopic organization of the motor neurons supplying forelimb and shoulder girdle muscles in the mouse. Brain Struct Funct. 2013;218:221–38. doi: 10.1007/s00429-012-0396-3. [DOI] [PubMed] [Google Scholar]
- 30.Kuang RZ, Kalil K. Branching patterns of corticospinal axon arbors in the rodent. J Comp Neurol. 1990;292:585–598. doi: 10.1002/cne.902920408. [DOI] [PubMed] [Google Scholar]
- 31.Terashima T. Anatomy, development and lesion-induced plasticity of rodent corticospinal tract. Neurosci Res. 1995;22:139–161. doi: 10.1016/0168-0102(95)00895-9. [DOI] [PubMed] [Google Scholar]
- 32.Kita T, Kita H. The Subthalamic Nucleus Is One of Multiple Innervation Sites for Long-Range Corticofugal Axons: A Single-Axon Tracing Study in the Rat. J Neurosci. 2012;32:5990–5999. doi: 10.1523/JNEUROSCI.5717-11.2012. [DOI] [PMC free article] [PubMed] [Google Scholar]
- 33.Schiller J, Helmchen F, Sakmann B. Spatial profile of dendritic calcium transients evoked by action potentials in rat neocortical pyramidal neurones. J Physiol. 1995;487(Pt 3):583–600. doi: 10.1113/jphysiol.1995.sp020902. [DOI] [PMC free article] [PubMed] [Google Scholar]
- 34.Hill DN, Varga Z, Jia H, Sakmann B, Konnerth A. Multibranch activity in basal and tuft dendrites during firing of layer 5 cortical neurons in vivo. Proc Natl Acad Sci. 2013;110:13618–13623. doi: 10.1073/pnas.1312599110. [DOI] [PMC free article] [PubMed] [Google Scholar]
- 35.Mittmann W, et al. Two-photon calcium imaging of evoked activity from L5 somatosensory neurons in vivo. Nat Neurosci. 2011;14:1089–93. doi: 10.1038/nn.2879. [DOI] [PubMed] [Google Scholar]
- 36.Evarts EV. Relation of Discharge Frequency To Conduction Velocity in Pyramidal Tract Neurons. J Neurophysiol. 1965;28:216–228. doi: 10.1152/jn.1965.28.2.216. [DOI] [PubMed] [Google Scholar]
- 37.Suter BA, Migliore M, Shepherd GMG. Intrinsic electrophysiology of mouse corticospinal neurons: A class-specific triad of spike-related properties. Cereb Cortex. 2013;23:1965–1977. doi: 10.1093/cercor/bhs184. [DOI] [PMC free article] [PubMed] [Google Scholar]
- 38.Tseng GF, Prince DA. Heterogeneity of rat corticospinal neurons. J Comp Neurol. 1993;335:92–108. doi: 10.1002/cne.903350107. [DOI] [PubMed] [Google Scholar]
- 39.Schiemann J, et al. Cellular Mechanisms Underlying Behavioral State-Dependent Bidirectional Modulation of Motor Cortex Output. Cell Rep. 2015:1–12. doi: 10.1016/j.celrep.2015.04.042. [DOI] [PMC free article] [PubMed] [Google Scholar]
- 40.Quallo MM, Kraskov A, Lemon RN. The Activity of Primary Motor Cortex Corticospinal Neurons during Tool Use by Macaque Monkeys. J Neurosci. 2012;32:17351–17364. doi: 10.1523/JNEUROSCI.1009-12.2012. [DOI] [PMC free article] [PubMed] [Google Scholar]
- 41.Ebbesen CL, Doron G, Lenschow C, Brecht M. Vibrissa motor cortex activity suppresses contralateral whisking behavior. Nat Neurosci. 2016;20:1–12. doi: 10.1038/nn.4437. [DOI] [PMC free article] [PubMed] [Google Scholar]
- 42.Kaufman MT, Churchland MM, Ryu SI, Shenoy KV. Cortical activity in the null space: permitting preparation without movement. Nat Neurosci. 2014 doi: 10.1038/nn.3643. [DOI] [PMC free article] [PubMed] [Google Scholar]
- 43.Ganguly K, Dimitrov DF, Wallis JD, Carmena JM. Reversible large-scale modification of cortical networks during neuroprosthetic control. Nat Neurosci. 2011;14:662–7. doi: 10.1038/nn.2797. [DOI] [PMC free article] [PubMed] [Google Scholar]
- 44.Kakei S, Hoffman DS, Strick PL. Muscle and movement representations in the primary motor cortex. Science. 1999;285:2136–2139. doi: 10.1126/science.285.5436.2136. [DOI] [PubMed] [Google Scholar]
- 45.Griffin DM, Hoffman DS, Strick PL. Corticomotoneuronal cells are ‘functionally tuned’. Science (80-) 2015;350:667–670. doi: 10.1126/science.aaa8035. [DOI] [PMC free article] [PubMed] [Google Scholar]
- 46.Davidson AG, Chan V, O’Dell R, Schieber MH. Rapid changes in throughput from single motor cortex neurons to muscle activity. Science. 2007;318:1934–7. doi: 10.1126/science.1149774. [DOI] [PubMed] [Google Scholar]
- 47.Liberti WA, et al. Unstable neurons underlie a stable learned behavior. Nat Neurosci. 2016;19:1665–1671. doi: 10.1038/nn.4405. [DOI] [PMC free article] [PubMed] [Google Scholar]
- 48.Brus-Ramer M, Carmel JB, Chakrabarty S, Martin JH. Electrical Stimulation of Spared Corticospinal Axons Augments Connections with Ipsilateral Spinal Motor Circuits after Injury. J Neurosci. 2007;27:13793–13801. doi: 10.1523/JNEUROSCI.3489-07.2007. [DOI] [PMC free article] [PubMed] [Google Scholar]
- 49.Iriki A, Keller A, Pavlides C, Asanuma H. Long-lasting facilitation of pyramidal tract input to spinal interneurons. Neuroreport. 1990;1:157–60. [PubMed] [Google Scholar]
- 50.Mosberger AC, et al. Axotomized Corticospinal Neurons Increase Supra-Lesional Innervation and Remain Crucial for Skilled Reaching after Bilateral Pyramidotomy. Cereb Cortex. 2017:1–19. doi: 10.1093/cercor/bhw405. [DOI] [PubMed] [Google Scholar]
- 51.Tennant KA, et al. The organization of the forelimb representation of the C57BL/6 mouse motor cortex as defined by intracortical microstimulation and cytoarchitecture. Cereb Cortex. 2011;21:865–76. doi: 10.1093/cercor/bhq159. [DOI] [PMC free article] [PubMed] [Google Scholar]
Associated Data
This section collects any data citations, data availability statements, or supplementary materials included in this article.