Abstract
Delays in gene networks result from the sequential nature of protein assembly. However, it is unclear how models of gene networks that use delays should be modified when considering time-dependent changes in temperature. This is important, as delay is often used in models of genetic oscillators that can be entrained by periodic fluctuations in temperature. Here, we analytically derive the time dependence of delay distributions in response to time-varying temperature changes. We find that the resulting time-varying delay is nonlinearly dependent on parameters of the time-varying temperature such as amplitude and frequency, therefore, applying an Arrhenius scaling may result in erroneous conclusions. We use these results to examine a model of a synthetic gene oscillator with temperature compensation. We show that temperature entrainment follows from the same mechanism that results in temperature compensation. Under a common Arrhenius scaling alone, the frequency of the oscillator is sensitive to changes in the mean temperature but robust to changes in the frequency of a periodically time-varying temperature. When a mechanism for temperature compensation is included in the model, however, we show that the oscillator is entrained by periodically varying temperature even when maintaining insensitivity to the mean temperature.
Keywords: systems biology, genetic networks, time-varying delay
1. Introduction
Biochemical reaction rates, as with all chemical reaction rates, are sensitive to changes in temperature and this effect is captured mathematically by the Arrhenius equation [2, 28]. Temperature dependent rates can also alter the dynamics of gene regulatory networks. Previous studies have examined how gene networks behave at various temperatures, and, in general, their dynamics speed up with increasing temperature [36]. For example, the cell doubling time in root meristems of Zea mays decreases 21-fold from 3 – 25°C increase in temperature [11]. In nature, variations in temperature often occur at times scales much slower than typical time scales of gene networks. However, time-varying temperatures have been shown to impact gene networks, particularly in the temperature entrainment of circadian oscillators. In such systems, the diurnal variations in temperature happen at the same time scale as the circadian network. For instance, circadian oscillators can be entrained by time-varying temperatures that cycle with a period close to 24 hours [5, 26, 35, 46].
In models of gene networks, dynamical delay has been used to model the sequential assembly of messenger RNA and then protein. Nucleic acids must be added one by one to the growing mRNA chain, while amino acids are joined end to end with peptide bonds to create a protein. In each case, the large chain of linear reactions can be compactly modeled either with a discrete delay term, or as a distributed delay term [4, 18]. The incorporation of delay greatly simplifies models of genetic oscillators while simultaneously maintaining qualitative similarities to experimental data [8, 21, 40, 41]. Delay-based models play a central role in understanding the origin of oscillations in genetic networks [30, 31] and other nonlinear systems [18, 22]. For constant temperatures, the delay time or distribution can be scaled with the Arrhenius equation, just as the reaction rates. However, less is known about how time-varying temperatures influence delays in such analyses.
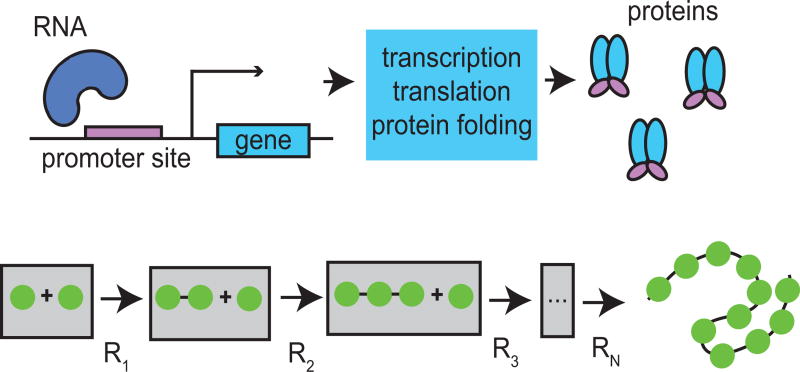
Here, we investigate how time-varying temperatures affect delays in genetic networks. We first derive how time-dependent temperature affects the delay term. To do this, we assume that delays arise from a sequence of first-order reactions that can be modeled as an aggregate delay. Although delay in gene networks is the result of the sequential assembly of first mRNA [6] and then protein [32] (see Fig. 2.1), we lump these delays into one term and represent protein production delay as a reduction of a linear chain of reactions. Each reaction in the sequence is then scaled by a common time-dependent Arrhenius factor. Since changes in temperature influence each biochemical step in the sequence that constitute the delay, the value of the delay time will change. From these assumptions, we derive an expression for the time-dependent distribution of delay times. We analyze changes in phase shift and amplitude of the resulting time-varying delay as a function of parameters of a sinusoidally time-varying rate-coefficient induced by temperature changes. We find a nonlinear relationship and, furthermore, find specific cases for which a delay can remain approximately time-invariant under time-varying conditions.
Figure 2.1. Modeling of delays in protein production.
Transcriptional delays (top) are modeled by a sequence of chemical reactions (bottom) with common reaction rate a(t) for each reaction R1, …, RN.
The effects of temperature on oscillators becomes important in the study of circadian clocks and is typically inferred through analysis of system response to single step changes in temperature or a single cycle [26]. We incorporate our findings into a model of a synthetic gene oscillator with temperature compensation presented by Hussain et al. [21]. In that paper, Hussain et al. presented experimental and computational results of a synthetic gene oscillator that has the same period regardless of the temperature. However, they only considered constant temperatures. Here, we extend their computational model to include time-varying temperatures. We find that, when the temperature varies sinusoidally in time, the oscillator can be entrained by temperature, but that this entrainment does not occur in the absence of the temperature compensation mechanism. In other words we find that the temperature compensated oscillator is insensitive to changes in the mean temperature but also entrained by periodically varying temperatures, a property explained and observed in circadian oscillators.
2. Characterization of time-varying delays
We begin by approximating protein production with a linear sequence of reactions (see Fig. 2.1). Transcription can be modeled as a sequence of independent one-nucleotide reaction steps as has been done by Arkin et al. in [1]. Furthermore, Bel et al. in [4], investigated more general cases by including degradation due to cellular division and considering reversible reactions. They found that in the limiting case of decreasing relative variance all systems with a forward bias behaved similarly. In this paper we consider only a simplified model, i.e. one with irreversible reactions and zero probability of partial transcripts. Since cellular division times are much longer than transcriptional delays, we also neglect dilution due to cell division but this could be incorporated through a correction factor on the overall production rate as explained by O’Brien et al. in [33]. In this case, we consider the corresponding generalized mass action model, the dynamics of which can be modeled by
| (2.1) |
where xi(t) is the concentration of the ith species at time t, x0(t) is the time varying concentration of the initial complex, a(t) is the time-varying rate coefficient, and the overdot represents differentiation with respect to time. The effects of time-varying temperatures can be reflected in the time-varying rate coefficients. From this we deduce the effects of time-varying temperatures on the delay distribution, i.e. the time it takes to go from the initial complex, x0, to mature protein, xN.
To find the distribution function, we first rewrite system (2.1) as
| (2.2) |
where x(t) = [xN, xN−1, …, x1]T, u(t) = [0, …, 0, a(t)x0(t)] and A(t) = a(t) J−1,N. Here J−1,N is the N-dimensional Jordan matrix with eigenvalues −1,
| (2.3) |
Because A(t1) commutes with A(t2) for all (t1, t2), we can write the general solution to equation (2.2) as
| (2.4) |
where
| (2.5) |
Without loss of generality we set t0 = 0 and substitute σ = t − τ. If we assume xj(t0) = 0 for j = 1, …, N, the solution reduces to
| (2.6) |
where . The exponential can be computed and is given by
 |
(2.7) |
where ⋆ denotes non-zero entries that are irrelevant due to the structure of u(t) and our desired output. In order to extract the expression relating the input x0(t) to the measured output xN(t), we multiply equation (2.6) by C = [1, 0, …, 0] on the left-hand side and substitute the expression for u(t), which gives the result
| (2.8) |
where the function
| (2.9) |
is the impulse response function relating the output to the input of the system. We refer to the impulse function as the delay distribution corresponding to protein synthesis times. Although we are working with a deterministic system, we refer to the function as a delay distribution since it emerges from a stochastic process. Recall that the systems of ODEs from which the expression was derived is the generalized mass action model of a sequence of stochastic reactions. The impulse function describes the average dynamics of that process. The delay distribution must have the constraint , for any time t. This constraint is always satisfied by the physics of the problem. The integral can be shown to equal one when a(t − τ) > ε for some ε > 0, that is, the reaction rate at all times is positive definite. To show this we express the integral as a line integral:
| (2.10) |
where the curve C is the domain of integration that is defined by α(t, τ) for t held fixed. Note that the expression in the last line is an integral over the Erlang distribution, which is equal to one when integrated along the curve C ≡ aτ. For the line integral in equation (2.10) to equal one, α(t, τ) must be an injective function in τ meaning dα(t, τ)/dτ = a(t − τ) > 0 (which implies a(t) > 0 for all t) with α(t, 0) = 0 and limτ→∞ α(t, τ) = ∞. By the definition of , we see that a positive definite a(t) in turn satisfies the latter conditions.
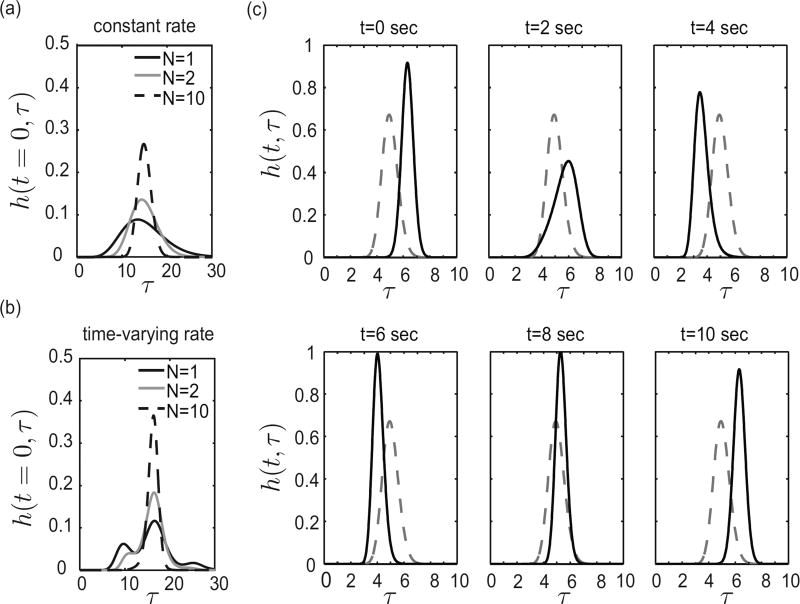
For the purpose of demonstration we consider a sinusoidally time-varying rate coefficient a(t) = δp a0 sin(ω t) + a0 with 0 < δp < 1, assuming the dynamics are induced from an appropriate time-varying temperature. Next, we show conditions under which this is a good approximation for a sinusoidally time-varying temperature. When a(t) ≡ const. (i.e. a(t) = a0), equation (2.9) is the Erlang distribution [29] with mean N/a. If a(t) is not constant, the delay distribution will be a function of time. We define the variable E to be E = N/a0 for the time-varying case and refer to E as the expected delay. Figure 2.2(a)–(b) shows the delay distribution h(t, τ) for different values of N (holding E = N/a0 constant), comparing the time-invariant case to the time-varying case. Note that, unlike the time-invariant case (Fig. 2.2(a)), the distribution in the time-varying case (Fig. 2.2(b)) need not be unimodal, especially for small N. For a large N, the distribution function drops off quickly away from the mean, and damps out any periodic fluctuations induced by the factor a(t − τ) in equation 2.9. However, for small N, we see the effects of the periodically varying reaction rate in the shape of the distribution. This multimodal distribution of protein synthesis times for transcription initiation at a given time t emerges from the underlying stochastic process combined with sensitivity to timing. For example, there may be a set of transcripts that happen to complete right before temperatures plunge again, leaving behind another set of transcripts to be significantly delayed. Figure 2.2(c) shows how the time-varying distribution changes with time for fixed N and a time-varying rate coefficient a(t). Note that the distribution becomes unimodal as N increases.
Figure 2.2. Delay distribution for different values of N with E = 15 for a constant and time-varying rate a.
(a) Delay distribution for different values of N with E = 15 for a constant rate coefficient a. (b) Delay distribution for different values of N with E = 15 for a time-varying rate coefficient a(t) = .5 a0 sin(ω t) + a0 at time t = 0. (c) Distribution as a function of time with a(t) = a0 δp sin(ω t) + a0, N = 100, (N + 1)/a0 = 15, δp = .5, and ω = 2π/20. The dashed line indicates the nominal time-invariant distribution with a(t) = a0.
Next, consider the limit as the number of reactions within the sequence tends to infinity. In the time-invariant case, one would consider the limit as N → ∞ such that the mean of the distribution N/a remains constant. Taking this limit reduces the distribution function to the Dirac delta function δ(τ − N/a), which has been shown in other work [4, 12]. To investigate the time-varying case, we assume that a(t) = a0f(t), where a0 > 0 and f(t) is a positive definite, bounded function of time, which agrees with the sinusoidally varying function a(t) above. In this case, if we take the limit N → ∞ with the constraint E = N/a0 ≡ const., the ratio N/α(t, τ) remains finite for finite τ.
In summary, we find that there exists a unique delay τeff such that
| (2.11) |
The derivation of these results can be found in Appendix A. Therefore, with the integral over the function equal to one, in the limit as N → ∞ such that N/a0 = E0 the distribution is approximated by a delta function centered at τeff (i.e. limN→∞ h(t, τ) ≈ δ(t − τeff(t))), which is necessarily a function of a(t), and therefore time-varying. From the derivation we find that this unique delay τeff(t) can be found by solving
| (2.12) |
for τeff. Note that τeff(t) can be computed with only the expected delay E = N/a0 and the time-varying function f(t). Also, since f(s) is positive definite, we can guarantee a single solution τeff for every time t. The effective delay τeff is computed such that the integral remains constant at E. Note that the area under the curve is zero for τeff = 0 and monotonically increases with increasing τeff.
We now apply the method to investigate delays under periodically time-varying temperatures. For a time-varying temperature
| (2.13) |
we can rewrite the Arrhenius equation A(T) = A0 e−θ/T in the form
| (2.14) |
where is non-negative and K = −θ/T0. We assume ε ≪ 1 (i.e. ΔT ≪ T0) and in the t!
Taylor expansion we have
| (2.15) |
Here, A0 is chosen such that A(0) = 1, i.e. A0 = exp(θ/T0). Therefore for small ε we can approximate the time-varying Arrhenius equation by
| (2.16) |
where . The time-varying rate coefficient for the reaction rates implicit in the delay are given by a(t) = a0 · A(t).
For a sinusoidally varying rate coefficient a(t) = a0 δp sin(ω t) + a0, using equation (2.12), the effective delay reduces to solving
| (2.17) |
where E is the expected delay. In the limit analyzed, changes in the delay are determined only from the expected delay without perturbation and the perturbation on the reaction rates. Also note that in the extreme limits of the frequency, we have
| (2.18) |
Taking the integral in equation (2.17), the solution can be shown to solve the system
| (2.19) |
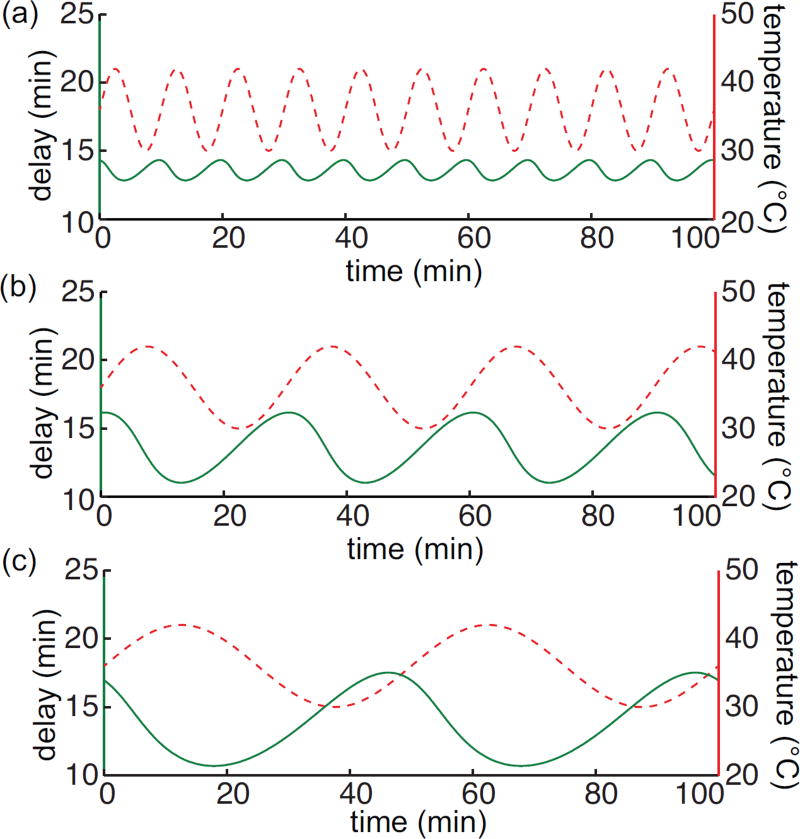
In this case the effective delay at each time t must be solved numerically. Figure 2.3 shows the delay as a function of time for a periodically varying temperature. The solution is found numerically for a discretized range of time. In Fig. 2.3 we consider the expected delay E = 13.5 min.
Figure 2.3. Amplitude of the delay changes with the period of the time-varying temperature.
Time-varying delays (green solid lines) corresponding to various time-varying temperature T (t) = ΔT sin(ωt) + T0 (red dashed lines). Parameter values here are θ = 4500K, E = 13.5 min., ΔT = 6°C, T0 = 36°C, and δp = .28. (a) . (b) . (c) .
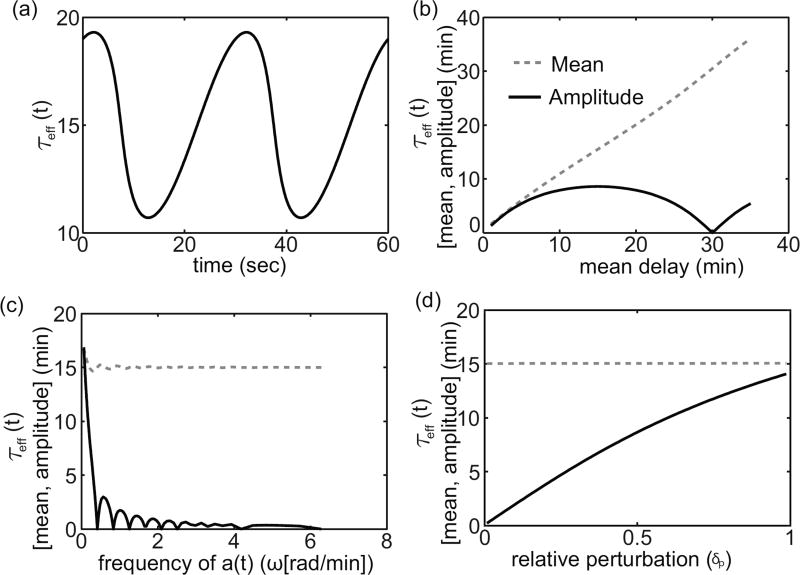
We now consider the effects of changing parameters δp and ω on the time-varying delay. Figure 2.4 shows analysis of the calculated time-varying delay as a function of various parameters. Figure 2.4(a) shows an example of the time-varying function τeff(t). In Figure 2.4(b)–(d), we look at how the mean and amplitude of the time-varying function τeff changes as we change the expected delay E, the relative perturbation δp, and the frequency ω of the time-varying rate function a(t). Most of the results are in line with intuition. For example the amplitude of τeff(t) increases with an increase in the relative perturbation δp and decreases as the frequency ω of a(t) increases. If the environmental conditions change too quickly, the system does not effectively respond. An unexpected result is the non-monotonic behavior of the function τeff(t) as the mean delay changes. Figure 2.4(b), implies that τeff remains constant when the mean delay is exactly equal to the period of a(t). With this observation we note that if ω = 2πn/T for any positive integer n in equation (2.19), then we always have the solution τeff(t) = T. This suggests that delays are minimally affected by sinusoidally time-varying reaction rates when the mean delay is an integer multiple of the period. We see the result of this in Figure 2.4(c) as well.
Figure 2.4. Mean and peak-to-peak amplitude of τeff as a function of δp, E, and ω.
(a) τeff as a function of time with ω = π/15, ϕ = 0, E = 15, and δp = .5. (b) τeff as a function of the expected delay with ω = π/15, ϕ = 0, and δp = .5. (c) τeff as a function of the frequency of a(t) with ϕ = 0, E = 15, and δp = .5. (d) τeff as a function of the relative perturbation δp with ω = π/E, ϕ = 0, and E = 15.
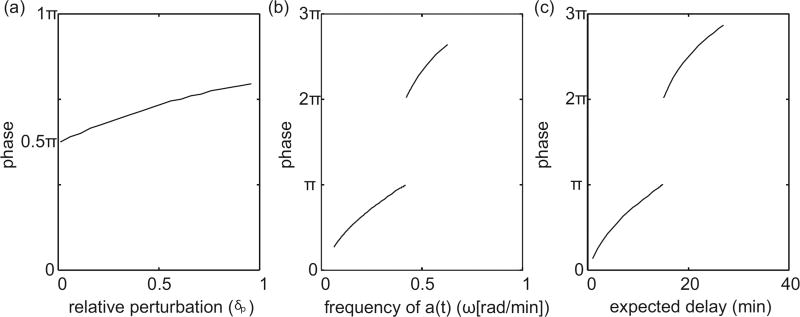
It is apparent from Figure 2.4, that the dependence of τeff on the sinusoidally time-varying temperature can be nonlinear. In this respect, we analyze the phase shift between the sinusoidally time-varying reaction rate a(t) and the resulting time-varying delay τeff(t). In Figure 2.5(a)–(c), we look at how the phase shift changes as we change the expected delay E, the relative perturbation δp, and the period of the time-varying rate function a(t). Before calculating phase shift we account for the fact that the reaction rate and delay functions are initially 180° out of phase because the delay decreases when the reaction rate a(t) increases. Also, since τeff(t) is not a perfect sinusoid, we calculate phase shift based on the distance between peaks. In general we find an increase in phase shift with an increase in expected delay E, the relative perturbation δp, and the period of the time-varying rate function a(t). However, Figure 2.5(b)–(c) show an existence of discontinuities in the phase shift. There is a 180° phase jump when the expected delay equals the period. Recall, that the amplitude of τeff(t) becomes zero when the delay is an integer multiple of the period. As the response τeff(t) crosses this critical point there is a 180° phase shift as the amplitude of the response becomes non-zero again. Furthermore, the frequency of discontinuities increase on the log scale as a function of frequency and expected delay. We show trends in a limited range of frequencies and expected delays in Figure 2.5(b)–(c) to help highlight where the nonlinearities come from and demonstrate the non-trivial behavior.
Figure 2.5. Phase shift between a(t) and πeff(t) as a function of δp, E, and ω.
(a) phase shift as a function of δp with E = 15 and ω = 2π/30. (b) phase shift as a function of ω with E = 15, and δp = .5. (c) phase shift as a function of E with ω = 2π/50, and δp = .5.
3. Temperature Entrainment of a Dual-Feedback Oscillator
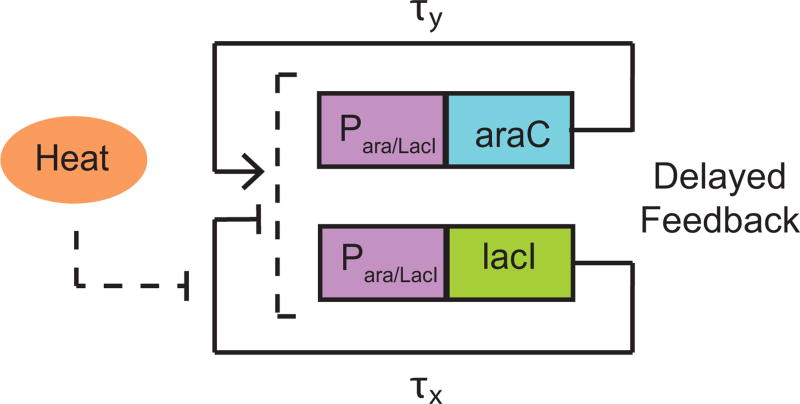
We now consider the entrainment properties of a temperature compensated dual-feedback oscillator presented by Hussain et al. [21]. The oscillator, as depicted in Fig. 3.1, can be modeled as [21]:
| (3.1) |
where x and y are the concentrations of the repressor (LacI) the activator (AraC); αx and αy are the maximal transcription initiation rates for x and y, respectively; Cx and Cy are the binding affinities of LacI and AraC to the promoter, respectively; β is the dilution rate due to cellular growth; η is a measure of the strength of the positive feedback loop; R0, γx, and γy are Michaelis-Menten constants for enzymatic decay of the proteins; τx an τy are temperature dependent delay times for the production of LacI and AraC, respectively; and A(T) is the common Arrhenius scaling of all reaction rates. Additionally, the Arrhenius scaling term has the form A(T) = A0 e−θ/T, where θ is the temperature scale. Note that increasing temperature increases the scaling coefficient A(T) and hence speeds up the dynamics of the system. In Hussain et al. [21], the authors scale the delay by the Arrhenius constant when predicting dynamics at varying temperatures (the temperatures are held constant for each assay). In this case, we consider predictions under time-varying temperatures defined by equation (2.13). We use the method derived in Section 2 to determine the resulting time-varying delay. The binding affinity of LacI, Cx(T) is a also a function of the temperature
| (3.2) |
and provides the mechanism for temperature compensation in the oscillator [21]. Cx,min and Cx,max are the minimum and maximum biding affinities of LacI to its promoter. Tlac is the temperature at which Cx(T) is half-maximal and b is a Hill coefficient.
Figure 3.1. Schematic of the temperature compensating oscillator [21].
In Hussain et al. [21], the period of the genetic oscillator is shown experimentally to remain largely unaffected by changes in constant temperature due to a temperature sensitive LacI mutant, which is modeled by the temperature dependent binding affinity Cx(T). We now consider entrainment properties of the circuit with time-varying temperatures in silico. In order to compare entrainment properties to a system without such a temperature dependent mechanism we consider the temperature-invariant binding affinity
| (3.3) |
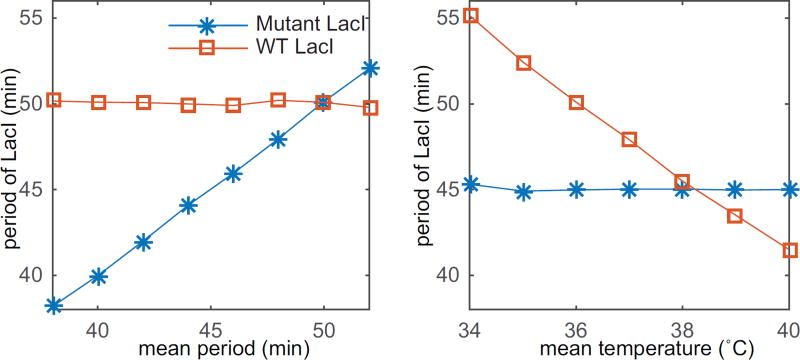
and compare the two models. First, we study system (3.1,3.2) and compare results with system (3.1,3.3). In this case temperature affects are introduced solely through an Arrhenius scaling and implicitly through the time-varying delay. We drive the system with a time-varying temperature described by equation (2.13) with ΔT = 2°C. From this we can approximate the time-varying Arrhenius scaling using equation (2.16) with θ = 4500K. Then the delay is calculated at each time step by solving equation (2.19). Details of the simulations are found in Appendix B. In Fig. 3.2(a) we fix the frequency of the temperature at and vary the mean temperature T0 in the two models in order to verify the temperature compensating property achieved through the temperature dependent LacI mutant. Without the temperature compensating mechanism the frequency of oscillations changes linearly with the mean temperature but remains constant with the LacI mutant. In Fig. 3.2(b) we fix the mean temperature at T0 = 36°C and vary the frequency ω to study frequency entrainment for the same system with and without the temperature compensating mechanism. It is clear that the system entrains only under the influence of the temperature sensitive promoter. A common Arrhenius scaling alone does not allow for frequency or phase entrainment. The same mechanism that provides temperature compensation (insensitivity to changes in mean temperature) also makes the system sensitive to temperature dynamics, achieving entrainment. This is in agreement with circadian clocks as well [5].
Figure 3.2. Entrainment of the synthetic gene oscillator with (Mutant LacI) and without a temperature sensitive promoter (WT LacI).
(a) Frequency entrainment of the circuit with and without temperature compensation for ΔT = 2°C and T0 = 36°C. (b) Period of the circuit with and without temperature compensation for ω = 2π/50 min−1, ΔT = 2°C, and different mean temperatures T0 in Eq. (2.13).
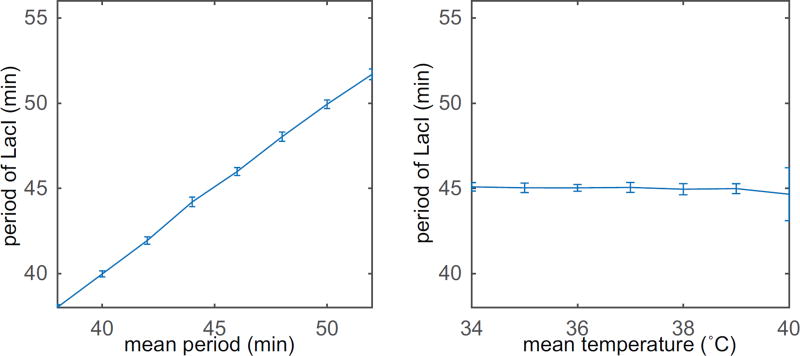
Finally, we consider a stochastic analog of system (3.1,3.2) with a distributed delay as a more realistic model. Discrete delays are used as a simplifying approximation but do not occur in nature. We implement a sequence of reaction equations to model the delay (the same reaction equations used to arrive at equations (2.1)). Therefore, the probability density function describing the time required to complete transcription should be described by equation (2.9). The stochastic model is simulated using the standard Gillespie algorithm [14]. The details of the model can be found in Appendix C. The results are shown in Fig. 3.3, where we look at response of the system to varying mean temperatures and frequencies as done above. Each point represents the average steady state period across 20 simulations with error bars representing a standard deviation above and below the mean. We see a similar response as seen in the deterministic model.
Figure 3.3. Gillespie simulation of the synthetic gene oscillator with a temperature sensitive promoter showing entrainment.
(a) Frequency entrainment of the circuit with ΔT = 5°C and T0 = 36°C. (b) Period of the circuit for ω = 2π/50 min−1, ΔT = 5°C, and different mean temperatures T0 in Eq. (2.13).
4. Conclusion
It was found that periodic temperature fluctuations induce periodically time-varying delays. The effects of a time-varying temperature on delays within a genetic network can be highly nonlinear and so the delay cannot be simply scaled by an Arrhenius coefficient in this case. With this, we investigated properties of a delay-based model of a temperature sensitive oscillator. This oscillator has been shown to exhibit temperature compensation, that is, the frequency of oscillation is insensitive to temperature variations. This was shown by analyzing the dynamics at different constant temperatures. Using the method derived, we were able to simulate the system under a periodically time-varying temperature. Simulations showed improved temperature compensating properties under the dynamically varying temperatures, over constant temperatures. Simulations also predicted reliable temperature entrainment. The frequency of protein expression coincided with that of the time-varying temperature.
We focused on properties important in circadian oscillators, namely, temperature compensation and temperature entrainment. Ideally, a circadian oscillator should demonstrate properties of entrainment with insensitivity to changes in mean temperatures [10]. Here we highlight a case where the entrainment is a byproduct of the same mechanism which makes the system insensitive to changes in mean temperature. This is in agreement with Bodenstein et al. [5], where temperature entrainment was shown to naturally follow from circadian clock models tuned for temperature compensation through the Arrhenius coefficients. In the oscillator of Hussain et al. [21], there is an inherent tradeoff between robustness to unwanted temperature fluctuations about a mean and robustness to changes in mean temperatures, with the latter admitting temperature entrainment. Here, an understanding of the effects of temperature on delays eased the analysis of a delay-based model of a circuit with circadian clock-like properties.
Future work includes investigation of circadian oscillators, which have an intricate relationship with temperature. For instance, circadian oscillators exhibit temperature compensation [3, 37], i.e. their periods do not vary with changes in the average temperature. Theorists have investigated methods of temperature compensation in models of circadian oscillators, often minimizing the effects of Arrhenius-scaled rate constants [10, 17, 19, 20, 39, 42]. Periodic changes in temperature have also been implicated in the entrainment of circadian oscillators to the day/night cycle [26, 35, 38, 43, 46]. However, entrainment of circadian oscillators is most commonly associated with periodic changes in light, and mathematical models have been developed explaining this phenomenon [9, 15, 16, 23, 24, 25, 27, 34, 44, 45]. Less is understood about the role of temperature.
Acknowledgments
Research was supported by the Robert A. Welch Foundation grant C-1729 and the NIH, through the joint NSF/NIGMS Mathematical Biology Program grant R01GM104974.
The authors thank Jae Kyoung Kim for insightful discussions.
Appendix A
Time-varying distribution limit
Here, we provide details on taking the limit N → ∞ with the constraint N/a0 = E on the time-varying distribution
| (A.1) |
We will show that in the limit the distribution, while maintaining an integral equal to one (as shown in the main text), becomes zero everywhere and infinity at a single point. In summary, we find that there exists a unique delay τeff such that
| (A.2) |
Applying Stirling’s formula for large N, namely
| (A.3) |
to the distribution (A.1) gives
| (A.4) |
| (A.5) |
which asymptotically converges to equation (A.1) in the limit as N → ∞. Rearranging terms in equation (A.5) and making use of the substitution a(t) = a0 f(t) gives
| (A.6) |
We define
| (A.7) |
and investigate the limit of equation (A.6) for different ranges of K by looking at the term
| (A.8) |
Note that K remains constant with changing N under the constraint N/a0 = E. For ease of analysis we ignore the coefficient in equation (A.6), which also does not change in the limit. We will show that in the limit N → ∞, equation (A.8) is zero everywhere and infinity at a singular point for any time t.
Applying l’Hôptial’s rule for K < 1
| (A.9) |
and for K ≥ 1
| (A.10) |
It remains to show that K ≤ 1 for all τ. We would like to determine when K reaches its maximum value. As a necessary condition for an extremum we must have
| (A.11) |
Since the first two terms are always strictly positive, we find that an extremum occurs at τeff, where
| (A.12) |
Plugging equation (A.12) back into equation (A.7),
| (A.13) |
we find K = 1 at the extremum. It can be easily shown that
| (A.14) |
therefore, the extremum is a maximum, hence, K ≤ 1 for all τ. We see that in the limit as N → ∞, h(t, τ) is zero everywhere for all τ except for at τeff, where K(τ) = 1 and h(t, τ) = ∞. Furthermore, since α(t, τ) is an injective function in τ, equation (A.12) has a single solution, hence, τeff provides a global maximum at a given time t, which is the single non-zero solution.
Appendix B
Simulations of the dual-feedback oscillator
The oscillator modeled by
| (B.1) |
where for the temperature compensating model we have
| (B.2) |
and for the non-temperature compensating model we have
| (B.3) |
using the parameters shown in Table B.1.
Table B.1.
System parameter values.
| Parameter | Value |
|---|---|
|
| |
| τx | 13.5 min. |
| τy | 15 min. |
| β | .0275 min−1 |
| γx | 76 (mol./cell)min−1 |
| γy | 76 (mol./cell)min−1 |
| R0 | 1.8 mol./cell |
| η | .5 (unitless) |
| Cy | 5 mol./cell |
| αx | 265 (mol./cell)min−1 |
| αy | 92.75 (mol./cell)min−1 |
| θ | 4500 K |
| Cx,max | 830 mol./cell |
| Cx,min | 50 mol./cell |
| Tlac | 36°C |
| b | 20 (unitless) |
| N | 4 |
This system is modeled using dde23 in Matlab with discretized delays. Using dde23, one can specify the delayed states to be used in the delay differential equation. Using the method derived in Section 2, we can determine the range of delays for which we need state information. The range of delays is discretized into bins of width .05min so that state information is saved for N ∈ ℤ different delays, where N = (τmax − τmin)/.05. The delay used in the simulation is the mid-point of each bin. At each iteration, we calculate what the time-varying delay is at that time using again the method in Section 2 and find the appropriate bin. The corresponding delayed state is then fed into the delay differential equation, simulating the time-evolution of the model above with a time-varying delay.
Appendix C
Gillespie simulations of the dual-feedback oscillator
We use the following reaction equations to generate Gillespie simulations:
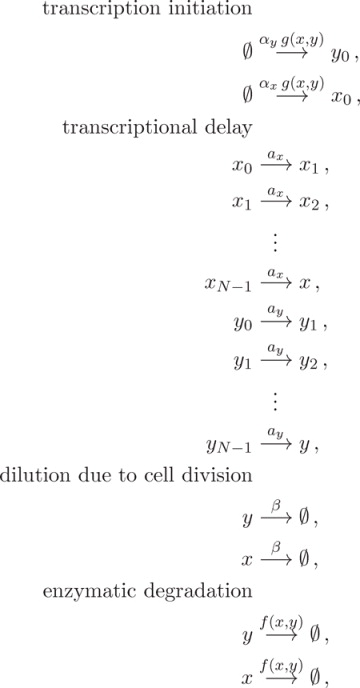 |
(C.1) |
where
| (C.2) |
and
| (C.3) |
The reaction rates are determined from the delay with equations ax = N/τx and ay = N/τy, where we set N = 40 as an approximation. The remainder of the parameters are borrowed from the deterministic system. The system is simulated using the standard Gillespie algorithm [14] custom coded in Matlab. The average period for each simulation was determined by first simulating the system for 15 periods to ensure steady state dynamics and taking the average period across the last 5 oscillations.
References
- 1.Arkin A, Ross J, McAdams HH. Stochastic kinetic analysis of developmental pathways bifurcation in phage λ-infected Escherichia coli cells. Genetics. 1998;149(4):1633–1648. doi: 10.1093/genetics/149.4.1633. [DOI] [PMC free article] [PubMed] [Google Scholar]
- 2.Arrhenius SA. ’´Uber die dissociationsw’´ arme und den einflusß der temperatur auf den dissociationsgrad der elektrolyte. Z Physik Chem. 1889;4 [Google Scholar]
- 3.Barrett RK, Takahashi JS. Temperature compensation and temperature entrainment of the chick pineal cell circadian clock. J Neurosci. 1995;15(8):5681–5692. doi: 10.1523/JNEUROSCI.15-08-05681.1995. [DOI] [PMC free article] [PubMed] [Google Scholar]
- 4.Bel G, Munsky B, Nemenman I. The simplicity of completion time distributions for common complex biochemical processes. Phys Biol. 2010;7(016003) doi: 10.1088/1478-3975/7/1/016003. [DOI] [PubMed] [Google Scholar]
- 5.Bodenstein C, Heiland I, Schuster S. Temperature compensation and entrainment in circadian rhythms. Phys Biol. 2012;9(3):036011. doi: 10.1088/1478-3975/9/3/036011. [DOI] [PubMed] [Google Scholar]
- 6.Bremer H, Yuan D. RNA chain growth-rate in Escherichia coli. J Mol Biol. 1968;38(2):163–80. doi: 10.1016/0022-2836(68)90404-x. [DOI] [PubMed] [Google Scholar]
- 7.Busenberg SN, Travis CC. Volterra and Functional differential equations. Blackburg, VA: Dekker; Jan, 1981. Approximation of functional differential equations by differential systems; pp. 197–205. [Google Scholar]
- 8.Danino T, Palomino OM, Tsimring L, Hasty J. A synchronized quorum of genetic clocks. Nature. 2010;463:326–330. doi: 10.1038/nature08753. [DOI] [PMC free article] [PubMed] [Google Scholar]
- 9.Forger DB, Peskin CS. A detailed predictive model of the mammalian circadian clock. PNAS. 2003;100(25):14806–14811. doi: 10.1073/pnas.2036281100. [DOI] [PMC free article] [PubMed] [Google Scholar]
- 10.François P, Despierre N, Siggia ED. Adaptive temperature compensation in circadian oscillators. PLOS Comp Biol. 2012;8:e1002585. doi: 10.1371/journal.pcbi.1002585. [DOI] [PMC free article] [PubMed] [Google Scholar]
- 11.Francis D, Barlow PW. Temperature and the cell cycle. Symp Soc Exp Biol. 1988;42 [PubMed] [Google Scholar]
- 12.Gedeon T, Hines G. Upper semicontinuity of morse sets of a discretization of a delay-differential equation. J Differ Equations. 1999;151:36–78. [Google Scholar]
- 13.Gedeon T, Hines G. Upper semicontinuity properties of the discretization of scalar differential delay equation: A complete solution. J Differ Equations. 2002;179:369–383. [Google Scholar]
- 14.Gillespie DT. Exact stochastic simulation of coupled chemical reactions. J Phys Chem. 1977;81(25):2340–2361. [Google Scholar]
- 15.Goldbeter A. A model for circadian oscillations in the Drosophila period protein (PER) Proc Biol Sci. 1995 Sep;261(1362):319–324. doi: 10.1098/rspb.1995.0153. [DOI] [PubMed] [Google Scholar]
- 16.Gonze D, Goldbeter A. Entrainment versus chaos in a model for a circadian oscillator driven by light-dark cycles. J Stat Phys. 2000 Oct;101(1–2):649–663. [Google Scholar]
- 17.Gonze D, Halloy J, Goldbeter A. Robustness of circadian rhythms with respect to molecular noise. Proc Natl Acad Sci USA. 2002;99(2):673–678. doi: 10.1073/pnas.022628299. [DOI] [PMC free article] [PubMed] [Google Scholar]
- 18.Gupta C, López JM, Ott W, Josić K, Bennett MR. Transcriptional delay stabilizes bistable gene networks. PRL. 2013;111(5):058104. doi: 10.1103/PhysRevLett.111.058104. (5) [DOI] [PMC free article] [PubMed] [Google Scholar]
- 19.Hatakeyama TS, Kaneko K. Generic temperature compensation of biological clocks by autonomous regulation of catalyst concentration. Proc Natl Acad Sci USA. 2012;109:8109–8114. doi: 10.1073/pnas.1120711109. [DOI] [PMC free article] [PubMed] [Google Scholar]
- 20.Hong CI, Conrad ED, Tyson JJ. A proposal for robust temperature compensation of circadian rhythms. Proc Natl Acad Sci USA. 2007;104(4):1195–1200. doi: 10.1073/pnas.0601378104. [DOI] [PMC free article] [PubMed] [Google Scholar]
- 21.Hussain F, Gupta C, Hirning AJ, Ott W, Matthews KS, Josić K, Bennett MR. Engineered temperature compensation in a synthetic genetic clock. PNAS. 2014;111(3):972–977. doi: 10.1073/pnas.1316298111. [DOI] [PMC free article] [PubMed] [Google Scholar]
- 22.Josić K, López JM, Ott W, Shiau L, Bennett MR. Stochastic delay accelerates signaling in gene networks. PLoS Comput Biol. 2011;7(11):e1002264. doi: 10.1371/journal.pcbi.1002264. (13) [DOI] [PMC free article] [PubMed] [Google Scholar]
- 23.Kim JK, Forger DB. A mechanism for robust circadian timekeeping via stoichiometric balance. Mol Syst Biol. 2012;8(630) doi: 10.1038/msb.2012.62. [DOI] [PMC free article] [PubMed] [Google Scholar]
- 24.Kim JK, Forger DB, Marconi M, Wood D, Doran A, Wager T, Chang C, Walton KM. Modeling and validating chronic pharmacological manipulation of circadian rhythms. CPT Pharmacometrics Syst Pharmacol. 2013;2 doi: 10.1038/psp.2013.34. [DOI] [PMC free article] [PubMed] [Google Scholar]
- 25.Kurosawa G, Goldbeter A. Amplitude of circadian oscillations entrained by 24-h light-dark cycles. J Theor Biol. 2006 Sep;242(2):478–488. doi: 10.1016/j.jtbi.2006.03.016. [DOI] [PubMed] [Google Scholar]
- 26.Lahiri K, Daniela V, Gondi SB, Santoriello C, Dickmeis T, Foulkes NS. Temperature regulates transcription in the zebrafish circadian clock. PLoS Biol. 2005;3(11):2005–2016. doi: 10.1371/journal.pbio.0030351. [DOI] [PMC free article] [PubMed] [Google Scholar]
- 27.Leloup JC, Goldbeter A. Towards a detailed computation model for the mammalian circadian clock. Proc. Natl. Acad. Sci. U.S.A. 2003;100(12):7051–7056. doi: 10.1073/pnas.1132112100. [DOI] [PMC free article] [PubMed] [Google Scholar]
- 28.Levine RD. Molecular Reaction Dynamics [Google Scholar]
- 29.MacDonald N. Time lag in a model of a biochemical reaction sequence with product inhibition. J Theor Biol. 1977;67(3):549–556. doi: 10.1016/0022-5193(77)90056-x. [DOI] [PubMed] [Google Scholar]
- 30.Mather W, Bennett MR, Hasty J, Tsimring LS. Delay-induced degrade-and-fire oscillations in small genetic circuits. PRL. 2009;102(6):068105. doi: 10.1103/PhysRevLett.102.068105. (4) [DOI] [PMC free article] [PubMed] [Google Scholar]
- 31.Mather W, Hasty J, Tsimring LS. Synchronization of degrade-and-fire oscillations via a common activator. PRL. 2014;113(12):128102. doi: 10.1103/PhysRevLett.113.128102. (5) [DOI] [PMC free article] [PubMed] [Google Scholar]
- 32.Naganathan AN, Mu noz V. Scaling of folding times with protein size. J Am Chem Soc. 2005;2(127):480–481. doi: 10.1021/ja044449u. [DOI] [PubMed] [Google Scholar]
- 33.O’Brien E, Italie EV, Bennett MR. Modeling synthetic gene oscillators. Math Biosci. 2012;236(1):1–15. doi: 10.1016/j.mbs.2012.01.001. [DOI] [PubMed] [Google Scholar]
- 34.Oda GA, Friesen WO. Modeling two-oscillator circadian systems entrained by two environmental cycles. PLoS ONE. 2011;6(8):e23895. doi: 10.1371/journal.pone.0023895. [DOI] [PMC free article] [PubMed] [Google Scholar]
- 35.Pavlidis T, Zimmerman WF, Osborn J. A mathematical model for the temperature effects on circadian rhythms. J Theoret Biol. 1968;18 doi: 10.1016/0022-5193(68)90162-8. [DOI] [PubMed] [Google Scholar]
- 36.Price PB, Sowers T. Temperature dependence of metabolic rates for microbial growth, maintenance, and survival. PNAS. 2004;101(13):4631–4636. doi: 10.1073/pnas.0400522101. [DOI] [PMC free article] [PubMed] [Google Scholar]
- 37.Reyes BA, Pendergast JS, Yamazaki S. Mammalian peripheral circadian oscillators are temperature compensated. J Biol Rhythms. 2008;23(1):95–98. doi: 10.1177/0748730407311855. [DOI] [PMC free article] [PubMed] [Google Scholar]
- 38.Ruoff P, Christensen MK, Sharma VK. PER/TIM-mediated amplification, gene dosage effects and temperature compensation in an interlocking-feedback loop model of the Drosophila circadian clock. J Theor Biol. 2005 Nov;237(1):41–57. doi: 10.1016/j.jtbi.2005.03.030. [DOI] [PubMed] [Google Scholar]
- 39.Ruoff P, Rensing L. The temperature-compensated goodwin model simulates many circadian clock properties. J Theor Biol. 1996;179:275–285. [Google Scholar]
- 40.Smolen P, Baxter DA, Byrne JH. A reduced model clarifies the role of feedback loops and time delays in the Drosophila circadian oscillator. Biophys J. 2002;83:2349–2359. doi: 10.1016/S0006-3495(02)75249-1. [DOI] [PMC free article] [PubMed] [Google Scholar]
- 41.Sriram K, Gopinathan MS. A two variable delay model for the circadian rhythm of Neurospora crassa. J Theoret Biol. 2004;231 doi: 10.1016/j.jtbi.2004.04.006. [DOI] [PubMed] [Google Scholar]
- 42.Takeuchi T, Hinohara T, Hurosawa G, Uchida K. A temperature-compensated model for circadian rhythms that can be entrained by temperature cycles. J Theor Biol. 2007;246(1):195–204. doi: 10.1016/j.jtbi.2006.12.028. [DOI] [PubMed] [Google Scholar]
- 43.Tomioka K, Sakamoto M, Harui Y, Matsumoto N, Matsumoto A. Light and temperature co-operate to regulate the circadian locomotor rhythm of wild type and period mutants of Drosophila melanogaster. J Insect Physiol. 1998 Oct;44(7–8):587–596. doi: 10.1016/s0022-1910(98)00046-8. [DOI] [PubMed] [Google Scholar]
- 44.Ute A, Granada AE, Westermark PO, Heine M, Kramer A, Herzel H. Coupling governs entrainment range of circadian clocks. Mol Syst Biol. 2011;6(438) doi: 10.1038/msb.2010.92. [DOI] [PMC free article] [PubMed] [Google Scholar]
- 45.Vatine G, Vallone D, Gothilf Y, Foulkes NS. It’s time to swim! Zebrafish and the circadian clock. FEBS Letters. 2011;585 doi: 10.1016/j.febslet.2011.04.007. [DOI] [PubMed] [Google Scholar]
- 46.Wheeler DA, Hamblen-Coyle MJ, Dushay MS, Hall JC. Behavior in light-dark cycles of Drosophila mutants that are arrhythmic, blind, or both. J Biol Rhythms. 1993;8(1):67–94. doi: 10.1177/074873049300800106. [DOI] [PubMed] [Google Scholar]


