

Melanoma topology promotes a stem cell phenotype with the propensity to facilitate new vessel growth.
Abstract
Tumor angiogenesis provides critical nutrients for cancer progression and may also facilitate pathways for dissemination during the process of metastasis. It is well established that cells that metastasize display characteristics of stem cells; however, the prevailing paradigm points to these stem-like cells residing in the hypoxic niche within the tumor interior. Controlling the geometry at the interface of a population of melanoma cells reveals a role for perimeter topology in promoting a stem-like state with enhanced tumorigenicity. We show that this putative melanoma-initiating cell (MIC) demonstrates significant enhancement in the secretion of proangiogenic molecules. This finding suggests the possibility of an “invasive niche” at the perimeter of a growing tumor that promotes a MIC state with angiogenic activity. Using several in vitro and in vivo models of tumor angiogenesis, we see concurrent stem-like characteristics with initiation of neovascularization. In the absence of hypoxia, precise topological cues induce signaling through integrin α5β1 and downstream extracellular signal–regulated kinase (ERK) signaling to regulate the MIC secretome through the signal transducer and activator of transcription (STAT) and hypoxia-inducible factor 1α (HIF1α) pathways. Inhibiting integrin α5β1 and ERK signaling attenuates both the MIC phenotype and proangiogenic signaling. These results suggest that topological cues in the periphery of malignant melanoma promote the MIC state—using mechanotransduction in lieu of low oxygen—to facilitate the formation of new vasculature for progression and invasion.
INTRODUCTION
Malignant melanoma is a tumor of the pigment-producing melanocytes and is responsible for most of the skin cancer–related deaths. Cutaneous melanoma can be treated through surgical excision at early stages, with survival rates of ~98%; however, once the disease has disseminated through metastatic spread, the survival rate is <17% (1). Melanoma incidence and progression are influenced by environmental factors and genetic susceptibility, involving several mutations (CDKN2A on chromosome 9p213, NRAS, and BRAF4) (2, 3), but with clear roles for epigenetics in guiding progression (4–6). The putative steps of malignant melanoma progression and metastasis involve (i) radial growth, (ii) invasion of dermal stroma, (iii) intravasation into lymphatic or blood vessels, and (iv) extravasation at a target tissue. Whereas the stages underlying pathogenesis are well defined, the cues that initiate melanoma metastasis, particularly during the vertical growth phase, remain poorly defined.
There is compelling evidence in numerous cancers that the cells responsible for recurrence and metastasis have the characteristics of stem cells (7), that is, the ability to self-renew and differentiate into all the cells of the tumor mass. Evidence to support this hypothesis comes from the enhanced tumorigenicity of these cells (8) and their enrichment in the circulating tumor cell population (9). Early characterization of the cancer stem cell niche in solid tumors has indicated that these cells reside within the hypoxic core, where the stem-like characteristics facilitate the repopulation of the heterogeneous assortment of tumor cells (10). However, recent evidence in glioblastoma has suggested that the microenvironment at the leading edge of a growing tumor can orchestrate the emergence of the cancer stem cell state that is capable of invasion and dissemination (11). There is now evidence that cells at the tumor margin and within the tumor interior show stem cell characteristics, albeit with different stem cell marker expression profiles (12). A recent report showed how very soft fibrin gels will promote the selection of a highly metastatic malignant melanoma-initiating cell (MIC) with stem cell characteristics (13, 14). In our laboratory, we have revealed a role for interfacial geometry, where the constraints imposed by perimeter geometric features in a tumor can guide melanoma cells toward a MIC state with distinctly unique stem-like characteristics compared to cells enriched on soft fibrin matrices (15). We have shown that this coordination can foster a unique microenvironment where integrin-mediated adhesion and mechanotransduction activate the MIC phenotype. In contrast to the classical view of cancer stem cell niche residing in the hypoxic tumor core, these new studies support an emerging paradigm associated with interfacial extracellular matrix properties promoting a stem-like state that is primed for metastasis.
In order for invasive cells to metastasize, they need to intravasate into blood or lymphatic vasculature (16). Angiogenesis, the formation of new blood vessels, is essential for melanoma development, growth, and progression (17–19). This process is regulated by the balance of signals that are both positive, such as vascular endothelial growth factor (VEGF) (20), and negative, such as tissue inhibitors of metalloproteinases (TIMPs) (21). Most studies have focused on how hypoxia, or low oxygen tension, plays a critical role in promoting vessel growth via up-regulating multiple proangiogenic pathways including hypoxia-inducible factors (HIFs) (22–24). For instance, studies report that hypoxia activates signal transducer and activator of transcription 3 (STAT3), a VEGF promoter, which induces the up-regulation of HIF1α and the enhancement of VEGF expression and angiogenesis (25, 26). However, recent work suggests that hypoxia may not be the sole contributor to HIF signaling (27, 28). For cancer cells at the periphery of the tumor in normoxia, an increased level of VEGF production was observed in several cancers (29, 30). In addition, even single cells or small-sized aggregates have the capacity to induce microvessel formation (31, 32).
Although there has been significant progress in the development of combination therapies that disrupt the progression of malignant melanoma (33), most of the therapies do not target the process of metastasis, and a high incidence of recurrence remains (34). Current paradigms in melanoma suggest that cell populations that show resistance (7) or phenotypic plasticity (15) may be a root cause of metastasis and recurrence. Malignant melanoma is known to be an angiogenic tumor, with new vessel formation being a critical step in progression and dissemination (35). Thus, it is critical to explore the regulation of distinct cell states, which may show enhanced tumorigenicity or survival advantages for dissemination, and the regulation of peripheral angiogenesis in a growing tumor.
Here, we report a self-regulating feedback loop between tumor-induced angiogenesis and a putative MIC state residing in regions of defined topology at the border of microengineered melanoma tumor mimics. We use several hydrogel patterning approaches to define variable regions of curvature at the perimeter of growing melanoma cells and explore the relationship between topology-directed stem fraction and associated hallmarks of angiogenesis in vitro and in vivo. These studies indicate roles for integrin-mediated adhesion, cytoskeletal tension, epithelial-to-mesenchymal transition, and HIF signaling under normoxic conditions in contributing to an “angiogenic” switch phenotype in melanoma. The platforms described here may prove useful in establishing experimental models of tumor cell invasiveness and angiogenesis to guide clinical grading and margin selection during resection. Furthermore, the role of mechanochemical signaling at distinct topologies may reveal new strategies for therapeutic intervention that targets biophysical parameters in the tumor microenvironment.
RESULTS
Malignant MICs display increased angiogenic activity in vitro
We fabricated polyacrylamide (PA) hydrogels and modified the hydrogel surface chemistry by treatment with hydrazine hydrate, and soft lithography was used to conjugate matrix proteins in various patterns on the surface (fig. S1) (36). Because we have previously shown that the effect of matrix stiffness on the MIC phenotype was negligible compared to interfacial effects (15), the Young’s modulus of gels was fixed at 10 kPa. As a model system, we selected the murine B16 melanoma cells (B16F0s) and used a representative putative MIC molecular marker, CD271. To assess whether MIC phenotypes enriched at perimeter features might influence the process of vessel formation of endothelial cells, we selected a spiral pattern with evolving perimeter curvatures that we showed previously would enrich a putative CD271+ MIC (15). B16F0s were grown on spiral-patterned PA gels, nonpatterned PA gels, and glass substrates for 5 days. Following culture, conditioned medium from B16F0s in different conditions was collected and added to human microvascular endothelial cells (hMVECs) in three-dimensional (3D) Matrigel culture. After 8 hours, hMVECs were fixed and the degree of tubulogenesis was imaged, and the tube areas were analyzed after normalizing cell number across conditions. Relative cell numbers were obtained after culturing B16F0s for 5 days in different geometries, nonpatterned substrates, or glass controls by counting cells in each condition from 12 identical substrates (fig. S2). First, we compared the tube formation of hMVECs with conditioned medium from spiral-patterned B16F0s or control medium, such as positive control containing an empirically derived cocktail of angiogenic growth factors, negative control containing regular endothelial cell growth medium (EGM), or normal B16F0 medium. Unlike the tube formation of hMVECs cultured in regular EGM (negative control), those cultured in the same medium with supplemented growth factors (positive control) had significantly higher (approximately twofold) tube formation (fig. S3). Tubulogenesis with conditioned medium collected from B16F0s cultured on spiral-patterned gels exhibited a more elongated morphology and higher hMVEC tube area relative to that with conditioned medium collected from B16F0s cultured on nonpatterned gels and glass substrates. Conditions that promoted the highest expression of CD271 in tumor cells also led to the highest degree of hMVEC tubulogenesis (R2 = 0.99; Fig. 1A). Because the conditioned medium from the B16F0s promoted endothelial tube formation in Matrigel, we next cocultured B16F0s and hMVECs in Matrigel to investigate direct heterotypic interactions between the cell populations. B16F0s cultured on spiral-patterned or nonpatterned PA gels for 5 days were trypsinized, and the same number of cells was recultured with hMVECs in Matrigel for 8 hours without conditioned medium. A similar trend was observed in the degree of tubulogenesis to that observed with conditioned medium (Fig. 1B). To deconstruct the effect of interfacial geometry on this enhancement of tubulogenesis, we used straight-line and ring geometries, where the curvature and perimeter/area ratio can be systematically varied. Curvature is inversely associated with the radius of shapes [line: infinite, large: 300 μm, medium: 150 μm, and small: 75 μm (radius of ring shapes was determined by outer circles)], and thus, curvatures of each shape are 0.0033, 0.0066, and 0.013 μm−1, respectively. Three different widths (20, 40, and 60 μm) represent different perimeter/area ratios (0.100, 0.050, and 0.033 μm−1, respectively). Curvature and perimeter/area terms are independent and increase with decreasing radius and width of shapes, respectively. B16F0s cultured in microconfinement with higher perimeter curvature and smaller width displayed higher expression of CD271 (Fig. 1C and fig. S4A). The degree of tubulogenesis with conditioned medium collected from B16F0s cultured on these straight-line and ring geometries (Fig. 1D and fig. S4B) corresponds to the expression of the CD271 marker. To investigate the relation between the degree of tubulogenesis and the expression of the MIC marker CD271, we obtained the Pearson correlation coefficient, which is the covariance of the two variables divided by the value of their SDs. When the correlation between tubulogenesis and expression of CD271 is analyzed with shape widths, cells cultured in 20-μm-wide shapes show the highest correlation (~0.94) relative to those cultured on wider shapes (40 μm, 0.77; 60 μm, 0.91) (Fig. 1E). In addition, when cocultured with hMVECs in Matrigel, B16F0s cultured on small (20-μm-wide) ring shapes displayed higher tubulogenesis than those cultured on 60-μm-wide ring shapes (fig. S5).
Fig. 1. Perimeter topology promotes stemness and angiogenic potential.
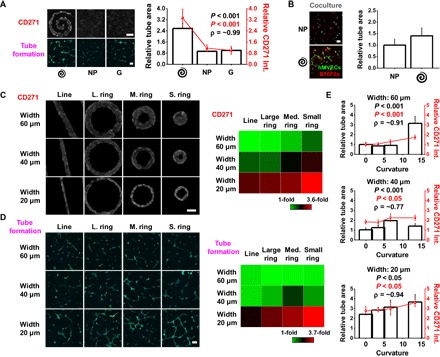
(A) CD271 marker expression in B16F0s cultured on spiral-patterned gels, nonpatterned gels, or glass substrates, and tube area formed by hMVECs after being treated with conditioned medium from the B16F0s. Representative immunofluorescence images of B16F0s for CD271 and hMVECs for tube formation (green). Correlation coefficient (ρ) is around 0.99. Scale bars, 100 μm (n = 5) [P value from analysis of variance (ANOVA) analysis]. (B) Quantitation of relative tube area of hMVECs cocultured with B16F0s precultured on spiral-patterned or nonpatterned gels. Representative immunofluorescence images of hMVECs showing tube formation (green) and B16F0s (red) when cocultured on Matrigel for 8 hours. Scale bar, 100 μm (n = 5) (P value from ANOVA analysis). (C) Representative immunofluorescence images of patterned B16F0s showing CD271 expression in line and ring geometries with different curvature and width. Heat map comparing the CD271 marker expressions across the shapes. Scale bar, 50 μm (n = 5). (D) Representative immunofluorescence images of hMVECs showing tube formation (green) after being treated with conditioned medium from patterned B16F0s. Heat map comparing tube area of hMVECs across the shapes of B16F0s. Scale bar, 100 μm (n = 5). (E) Curvature with different widths of ring topology influences both CD271 marker expression in B16F0s and tube formation of hMVECs cultured in Matrigel for 8 hours with conditioned medium. Correlation coefficients (ρ) are around 0.91 (60 μm width), 0.77 (40 μm width), and 0.94 (20 μm width) (P value from ANOVA analysis). Spiral, spiral-patterned; NP, nonpatterned; G, glass substrates. Error bars represent SD for CD271 expression and SEM for tube area.
Integrin-mediated adhesion and cytoskeletal tension at the interface promote an angiogenic phenotype
We previously showed how B16F0s cultured in a spiral shape containing a high perimeter/area express higher levels of MIC markers at both convex and concave perimeter features (15). To compare angiogenesis-related gene expression for B16F0s cultured in spiral-patterned or nonpatterned gels or glass substrates, we analyzed a panel of VEGF signaling genes and genes regulated by HIF1 (Fig. 2A). The results show higher levels of expression in cells cultured on spiral-patterned gels relative to those cultured on nonpatterned gels and glass substrates. Previously, we revealed that integrin α5β1, mitogen-activated protein kinase (MAPK) pathways, and STAT activity play an important role in melanoma cancer cell plasticity, influencing their metastatic and tumorigenic characteristics when cultured in interfacial regions (15). To explore possible mechanotransduction pathways that enhance the MIC phenotype and angiogenic potential at perimeter features, we treated B16F0s with blocking antibodies to integrins α5β1 and αvβ3 and inhibitors for cytoskeletal tension (blebbistatin and Y27632), MAPK [p38, extracellular signal–regulated kinase (ERK), and c-Jun N-terminal kinase (JNK)], bone morphogenetic proteins (BMPs) (Noggin), or glycogen synthase kinase-3 (GSK-3) (CHIR). To prevent these blocking antibodies or inhibitors from influencing hMVEC tubulogenesis, we treated B16F0s for an initial 3 days of culture, added fresh medium after washing twice with phosphate-buffered saline (PBS), and then collected the fresh conditioned medium after the remaining 2 days of culture (fig. S6A). After B16F0 conditioned medium was added to these treatments, tube formation significantly decreased with blocking antibodies to integrin α5β1 (~0.45-fold) or αvβ3 (~0.59-fold) and treatment of patterned cells with Y27632 (~0.60-fold) or ERK (~0.64-fold) (Fig. 2B). On the basis of these results, we speculate that integrin-mediated adhesion and cytoskeletal tension may augment the emergence of a MIC state and angiogenic potential. Thus, we cultured cells for 5 days on patterned gels with or without treatments (α5β1, αvβ3, Y27632, and ERK) for flow cytometric analysis to compare the expression of putative MIC markers CD271 and STAT3. Similar to the tubulogenesis results, treated cells cultured in spiral patterns show lower levels of CD271 and STAT3 compared to untreated cells (Fig. 2C). To confirm the effect of Jarid1B, which is known as a marker of MICs, we used short interfering RNA (siRNA) to silence gene expression (fig. S6B). The results show that cells cultured with Jarid1B siRNAs lead to decreased tubulogenesis as a measure of angiogenic potential (Fig. 2D). Because genes regulated by HIF1 were up-regulated for cells cultured on patterned gels, we used a HIF1α inhibitor to explore its effect on the angiogenic potential of B16F0s. Moreover, hydrocortisone and heparin sodium salt (HSS) were used because they were previously used as angiogenesis inhibitors and inducers of endothelial character. Patterned cells treated with the HIF1α inhibitor (~0.55-fold) or hydrocortisone (~0.61-fold), but not with HSS (~0.75-fold), showed a significantly reduced angiogenic potential (Fig. 2E). Together, these results confirm a role for topology at the interface of melanoma cells in promoting the MIC state and a proangiogenic secretome that promotes tubulogenesis of endothelial cells in Matrigel.
Fig. 2. Topology guides integrin-mediated adhesion and mechanotransduction to direct angiogenic activity through HIF1.
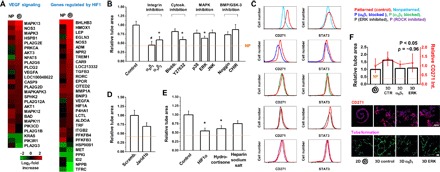
(A) Gene expression analysis of transcripts associated with VEGF signaling and genes regulated by HIF1 for cells cultured on nonpatterned and spiral-patterned gels. Heat maps for fold changes over glass in gene expression. Log2 fold increase. (B) Effect of treatment of spiral-patterned B16F0s with blocking antibodies to integrins α5β1 and αvβ3 or inhibiting cytoskeletal tension (blebbistatin and Y27632), MAPK pathways (p38, ERK, and JNK), BMP pathway (Noggin), or GSK-3 (CHIR) to B16F0 conditioned medium on tube formation of hMVECs. Error bars represent SEM (n = 5) (*P < 0.05 and #P < 0.01, Student’s t test). (C) Flow cytometric characterization of CD271 or STAT3 in B16F0s when treated with α5β1 or αvβ3 blocking antibodies, an ERK inhibitor, or a ROCK inhibitor (Y27632). (D) Effect of Jarid1b knockdown with siRNA on tube formation of hMVECs. Error bars represent SEM (n = 5). (E) Effect of HIF1α inhibition, hydrocortisone, or HSS treatment on B16F0 ability to promote tube formation in hMVECs. Error bars represent SEM (n = 5) (*P < 0.05, Student’s t test). (F) CD271 marker expression for B16F0s cultured in spiral-patterned gels (2D) or incorporated in PEG gels (3D) with or without α5β1 blocking or ERK inhibition, and tube area formed by hMVECs after being treated with conditioned medium from the B16F0s. Representative immunofluorescence images of B16F0s (blue, nuclei) for CD271 (red) and hMVECs for tube formation (green). Correlation coefficient (ρ) is around 0.96. Error bars represent SEM. Scale bars, 100 μm (n = 5) (P value from ANOVA analysis).
Thus far, we have cultured melanoma cells as a monolayer on micropatterned PA hydrogels. To explore whether our observations hold for tumor cell aggregates in 3D, which more closely mimic the tumor microenvironment, we encapsulated groups of cells in biocompatible 3D poly(ethylene glycol) (PEG) hydrogels. PEG gels were fabricated to show comparable stiffness (10 kPa) and composition (fibronectin) to our micropatterned 2D PA system. After 5 days in culture, B16F0s cultured in 3D PEG gels express higher levels of CD271 marker relative to those cultured in 2D spiral-patterned PA gels, and conditioned medium collected from those cultured in 3D PEG gels promote tubulogenesis in hMVECs cultured in Matrigel (Fig. 2F). Tube formation decreases when B16F0s are cultured in 3D PEG gels with inhibitors of integrin α5β1 adhesion or ERK1/2-MAPK signaling, which corresponds to a decrease in expression of CD271 with a correlation coefficient of 0.96. These results suggest that perimeter topology is not an artifact of our 2D microengineered system and will exert an influence on the MIC state and angiogenic potential in 3D tumor mimics.
Interfacial topology guides the angiogenic secretome from malignant melanoma
We investigated the influence of perimeter topological cues on the proangiogenic secretory profile of B16F0s by using cytokine arrays. These arrays consist of both angiogenesis activators [ranging from VEGF to bFGF (basic fibroblast growth factor)] and inhibitors [varying from TIMP to interferon-γ (IFN-γ)], which are molecules that activate and inhibit the growth of new blood vessels, respectively. We investigated the relative concentration of a panel of 24 different angiogenic cytokines in the conditioned medium of B16F0s cultured on nonpatterned or spiral-patterned PA gels with and without integrin α5β1 and ERK1/2 inhibitors (Fig. 3A). We normalized a heat map of protein expression to cell number and found an increase in expression of proangiogenic proteins secreted from spiral-patterned cells across the broad spectrum of cytokines compared to molecules secreted from nonpatterned cells, especially from interleukin-1β (IL-1β) to leptin [arranged in descending order (left to right) of fold change for patterned cells over nonpatterned cells]. However, when patterned cells are supplemented with inhibitors of α5β1 and ERK1/2, we see an attenuation of topology-related proangiogenic secretion; when cells were cultured with α5β1 blocking antibodies or ERK1/2 inhibitors, the molecules that showed higher secretion from patterned cells (IL-1β to leptin for activators; IL-12p70 and IL-12p40/70 for inhibitors) showed decreased expression levels, whereas those that showed higher secretion from nonpatterned cells [G-CSF (granulocyte colony-stimulating factor) to IGF-2 (insulin-like growth factor 2) for activators; IFN-γ to TNF-α (tumor necrosis factor–α) for inhibitors] displayed elevated expression levels. Although there is a clear decrease in secretion with integrin blocking, ERK inhibition appears more complicated with modulation of both pro- and anti-angiogenesis cytokines. Together, these results demonstrate that topological cues augment mesenchymal phenotypes at perimeter features to promote the secretion of proangiogenic cytokines (Fig. 3B).
Fig. 3. Topology promotes secretion of proangiogenic cytokines.
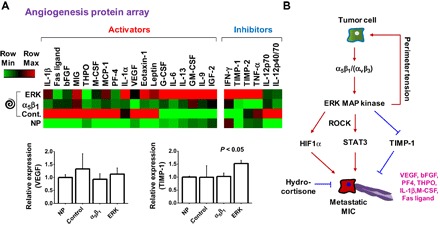
(A) Heat map of cytokine expression (24 proteins) in conditioned medium of B16F0s cultured in nonpatterned or spiral-patterned PA gels with or without α5β1 blocking or ERK inhibition. Activators and inhibitors are defined as molecules that activate and inhibit the growth of new blood vessels, respectively. Error bars represent SD (n = 4) (P value from ANOVA analysis). (B) Proposed pathway for perimeter topology regulating the MIC state and angiogenic activity in melanoma.
Topology-activated MICs show in vivo tumorigenicity and enhanced angiogenesis
Next, we sought to confirm enhanced angiogenesis from putative MIC population through several in vivo approaches. First, we used a chick chorioallantoic membrane (CAM) assay (fig. S7A). We placed B16F0s cultured on nonpatterned or spiral-patterned gels with or without blocking integrin α5β1 or inhibiting ERK signaling on the CAMs of 10-day-old chick embryos (hydrogels directly applied cell-side down). After 5 days in culture, we analyzed the formation of new vessels by calculating the vessel area, and the results reveal enhanced vessel formation in CAMs, which are much bigger and more mature after exposure to spiral-patterned B16F0s, when compared to untreated (~3.78-fold) or B16F0s cultured on nonpatterned gels (~1.80-fold) or spiral patterns with α5β1 blocking (~1.68-fold) or ERK inhibition (~1.48-fold) (Fig. 4A). This demonstrates that perimeter topology will promote proangiogenic secretion from cultured B16F0s in vitro and in vivo.
Fig. 4. Perimeter topology promotes neovascularization in vivo.

(A) Relative tube area (normalized to cell number) on CAMs with implanted PA hydrogels with nonpatterned or spiral-patterned B16F0s with or without α5β1 blocking or ERK inhibition. Representative images of CAMs under different conditions. Error bars represent SEM. Scale bar, 2 mm (*P < 0.05, Student’s t test). (B) Tumor growth characteristics of subcutaneous implanted cells (patterned or nonpatterned) in C57BL/6 mice. Error bars represent SEM. (C) Representative images of tumors and angiogenesis after culturing of the subcutaneous implanted cells cultured for 3 weeks. Scale bar, 2 mm. (D) Percent of injected dose per gram of tissue (% ID/g) (αvβ3 integrin targeting using 64Cu-NOTA-PEG4-cRGD2) for subcutaneous implanted cells (*P < 0.05, Student’s t test). Error bars represent SEM. (E) 3D color map from a PET-CT scan of a representative mouse for 64Cu-NOTA-PEG4-cRGD2 signals (targeting αvβ3) 3 weeks after subcutaneously implanted with patterned (top) and nonpatterned (bottom) cells. Scale bar, 2 mm. (F) Histopathology of tumor sections after subcutaneous injection and immunolabeling of excised sections of tumors tissue (with Matrigel) stained for factor VIII after subcutaneous implantation of B16F0s cultured in the spiral geometry or nonpatterned substrates. Scale bar, 50 μm. H&E, hematoxylin and eosin. (G) Vessel density per gram tissue of C57BL/6 mice after experimental tumorigenicity (factor VIII). n is the number of tumor sections used. Boxes represent 25th to 75th percentile (50th for center line), and whiskers represent minimum-maximum.
To further verify the tumorigenicity and angiogenic potential of our engineered cells in vivo, we cultured B16F0s for 5 days on spiral-patterned or nonpatterned gels, followed by subcutaneous injection into 6- to 8-week-old C57BL/6 mice (fig. S7B). Primary tumor growth (monitored every week with calipers) was enhanced (~5.95-fold at 1 week, ~11.88-fold at 2 weeks, and ~3.51-fold at 3 weeks) for the B16F0s cultured on spiral-patterned gels relative to those cultured on nonpatterned gels (Fig. 4B). The tumors derived from patterned cells had improved neovascularization, with enhanced formation of tumor-feeding vessels (Fig. 4C). With the observed differences for primary tumor growth and neovascularization, we sought to confirm whether these activated cells would likewise give rise to a higher degree of angiogenic signaling in vivo. To assess the activity of αvβ3 integrin (known to be highly expressed in activated endothelial cells during angiogenesis) (37, 38), we quantified the positron emission tomography–computed tomography (PET-CT) signal of 64Cu-NOTA-PEG4-cRGD2 targeted at the αvβ3 integrin. We found higher levels of 64Cu-NOTA-PEG4-cRGD2 uptake (~1.26-fold at 1 week, ~1.35-fold at 2 weeks, and ~1.37-fold at 3 weeks) on the periphery of patterned cells, where the new microvascular network was formed (Fig. 4, D and E).
Next, we encapsulated B16F0s cultured for 5 days on spiral-patterned or nonpatterned gels in Matrigel when subcutaneously injected into mice. We chose to use Matrigel as an injection medium because tumor cells will grow more quickly and angiogenesis will occur throughout the inner matrix, allowing quantitative analysis of vessel density after sectioning. After 7 days in culture, we confirmed primary tumor establishment under both conditions and analyzed the blood vessel formation by staining for endothelial cells around the tumor for mice injected with B16F0s in Matrigel (Fig. 4F). The vessel density per tumor mass was enhanced for the B16F0s cultured on spiral-patterned gels compared to those cultured on nonpatterned gels (~4.6-fold) (Fig. 4G). Overall, our in vivo results are consistent with our observations in vitro and suggest that topology promotes a stem-like MIC phenotype that displays enhanced angiogenic activity.
DISCUSSION
Here, we provide evidence that topology at the perimeter of malignant melanoma populations will promote a MIC state that activates angiogenesis. We show that the MIC phenotype at the interface has elevated levels of CD271, which corresponds to enhanced angiogenic signaling relative to control melanoma phenotypes. Furthermore, we found that adhesion through integrin α5β1 and downstream ERK signaling promotes HIF activity to regulate the proangiogenic secretome, resulting in improved vessel formation in vitro and in vivo.
Tumor angiogenesis is a necessary condition for tumor growth, progression, and dissemination, and most research has maintained a primary focus on the hypoxic microenvironment (23). In general, HIF1, which is one of the most important angiogenic transcriptional factors, responds to low oxygen to regulate a host of genes involved in cancer metabolism, differentiation, and invasion (22, 24). HIF1 mainly consists of an oxygen-regulated subunit (HIF1α) and a constitutively expressed subunit (HIF1β) (39). HIF1α can be degraded by cells under normoxic conditions through ubiquitin-proteasome pathways, whereas those under hypoxic conditions stabilize the HIF1α subunit, which interacts with coactivators and regulates the expression of target genes, promoting angiogenesis (24). However, recent studies have shown some evidence of hypoxia-independent mechanisms of tumor angiogenesis (27, 28). The regulation of HIF1α by cytokines (40), growth factors (41), environmental stimuli (42), and other signaling molecules (43) suggests that a hypoxic environment is not necessary for the induction of this cascade. In melanoma, BRAF/MAPK kinase (MEK)/ERK (44) and phosphatidylinositol 3-kinase (PI3K) (45) have been demonstrated to stabilize and activate HIF1α protein levels under normoxic conditions. Furthermore, MAPK signaling can stimulate HIF1 activation regardless of oxygen tension (46). Here, we found that the mechanotransduction-related MAPK pathway (ERK1/2) is significantly involved in melanoma angiogenic potential under nonhypoxic conditions, and thus, we questioned whether HIF1α would be highly associated with angiogenic activity and the recruitment and stabilization of vasculature. When we treated B16F0s with inhibitors of HIF1α signaling, the degree of hMVEC tubulogenesis in response to conditioned medium was significantly suppressed relative to untreated cells. This suggests that HIF1α, which may be activated by ERK-MAPK signaling in normoxia (46), is modulated by mechanotransduction through topological cues at the tumor interface.
VEGF is one of the most potent endothelial-specific mitogens to regulate angiogenesis and is regulated by HIF1 and STAT3 (25, 26). For instance, VEGF expression is enhanced by hypoxia via HIF1α induced by increased STAT3 activities (25). In addition, a previous report showed that STAT3 directly contributes to the overexpression of VEGF (47). Here, we found that genes related to VEGF signaling or regulated by HIF1 are up-regulated for B16F0s cultured on spiral-patterned gels compared to those cultured on nonpatterned gels or glass substrates. Previously, we showed that STAT3 activity is up-regulated downstream of integrin α5β1 and MAPK signaling when cells are exposed to interfacial tension (15). Here, we found that STAT3 activity and VEGF signaling are attenuated by blocking integrins α5β1 and αvβ3 or by inhibiting ERK signaling and cytoskeletal tension. TIMP-1, which can inhibit the activities of matrix metalloproteinases (MMPs), is known as a suppressor of melanoma growth, invasion, metastasis, tumorigenesis, and angiogenesis (21). Here, B16F0s cultured on spiral-patterned gels with an ERK inhibitor show elevated levels of TIMP-1 expression compared to those cultured on nonpatterned gels or spiral-patterned gels (untreated or blocking integrin α5β1), suggesting that ERK may also play a role in promoting melanoma malignant activity via suppression of TIMP-1. Unlike the traditional concept of tumor angiogenesis requiring hypoxic conditions, oxygen-independent drivers, such as ERK activity, may promote tumor angiogenesis through STAT3 signaling and down-regulation of antagonists such as TIMP-1. Targeting integrin α5β1 adhesion and ERK signaling at the tumor periphery may prove a novel therapeutic approach to inhibiting both the tumorigenic MIC and associated proangiogenesis signals.
We used an in ovo CAM assay and murine models of primary tumor growth to investigate the role of MICs at the periphery in promoting angiogenesis. Similar to previous studies where stem-like phenotypes in glioma (48) and renal cell carcinoma (49) would promote tumor angiogenesis in vivo, our putative MIC promotes a higher degree of angiogenesis in ovo and in vivo. For the in ovo CAM studies, we applied the microengineered hydrogels directly to the membrane; the vessel area was higher for B16F0s in spiral geometries than those without geometric constraints, and blocking α5β1 and inhibiting ERK corresponded to our in vitro results. After implantation in mice, we saw higher levels of angiogenesis around tumors derived from cells cultured in spiral geometries, with 64Cu-NOTA-PEG4-cRGD2 retention indicating the formation of new vascular networks and increased vessel density, which supports the hypothesis that melanoma cells are transformed to a MIC state at specific topological sites to promote enhanced angiogenesis.
We have shown how a MIC state can be coordinated through mechanotransduction at the tumor periphery by integrin engagement and ERK/STAT pathways, which augments HIF1α-mediated proangiogenic signaling under normoxic conditions. This MIC phenotype, revealed through both microengineered 2D and 3D tumor models, promotes higher degrees of tubulogenesis in Matrigel cultures of hMVECs in vitro and angiogenesis in several in vivo models relative to non-MIC phenotypes. Unlike the traditional concept that the MIC niche and tumor angiogenesis occur under hypoxic conditions, our results present an alternative concept that topology at the interface of a growing tumor may initiate both the MIC state and angiogenesis to facilitate growth and dissemination. Targeting of adhesion through α5β1 and the ERK pathway to reduce HIF1α and STAT3 activities, and enhance TIMP-1 levels, may represent a novel approach to controlling stem fraction and attenuating associated angiogenesis in melanoma. In addition, these results may also serve to guide prognosis during radial and vertical growth phases, and to select margins before surgery, by imaging tumor topology and angiogenesis in tandem.
MATERIALS AND METHODS
PA hydrogel fabrication
PA hydrogels (10 kPa) were fabricated as described previously (50). Briefly, a glass coverslip (18 mm; Thermo Fisher Scientific) was functionalized with 3-aminopropyltriethoxysilane for 3 min, followed by washing and glutaraldehyde treatment for 30 min (Sigma). A 10% (w/v) acrylamide and 0.1% (w/v) bis-acrylamide (Sigma) prepolymer solution was prepared, and 0.01% ammonium persulfate (Sigma) and tetramethylethylenediamine (Sigma) were added to initiate gelation. Twenty microliters of the mixture was sandwiched between a hydrophobically treated glass slide and the activated coverslip to form the gel. After 25 min of gelation, the gel-coated coverslips were gently detached. Hydrazine hydrate (55%) was added to the gels for 2 hours, with rocking to modify the surface chemistry, followed by washing with 5% glacial acetic acid for 1 hour and distilled water for 1 hour and stored for later use. Patterned or nonpatterned polydimethylsiloxane (Polysciences) stamps of desired shapes were fabricated from silicon masters fabricated by conventional photolithography. To conjugate matrix protein (fibronectin; Sigma) to gel surfaces, sodium periodate (~3.5 mg/ml; Sigma) was added to oxidize sugar groups in matrix proteins into aldehydes, and then the oxidized protein solution was pooled onto patterned or nonpatterned (flat) stamps for 30 min and then dried with air. Microcontact printing technique was used to transfer protein residues on stamps onto gel surfaces.
PEG hydrogel fabrication
To fabricate PEG gels for the culture of B16F0s, PEG (molecular weight, 10,000; Sigma) was modified to PEG diacrylate (PEGDA) by the addition of acryloyl chloride, as reported previously (15). To generate activated coverslips, coverslips were covered with a 2% 3-(trimethoxysilyl)propyl methacrylate solution in ethanol with 0.3% added glacial acetic acid for 10 min, followed by baking at 95°C for 1 hour. Fibronectin was acrylated by the addition of 10× excess of N-hydroxysuccinimide–acrylate (Sigma) in carbonate buffer (pH 9; 1 M NaCl) for 4 hours. MMP-cleavable peptides (sequence: CGPQGIAGQGCR) were synthesized using solid-phase peptide synthesis and reacted with PEGDA via Michael addition with terminal cysteine residues of MMPs to generate 30% (w/v) PEGDA-MMP. B16F0s were mixed into this solution, and an ultraviolet-activated initiator (0.05% Irgacure 2959; Sigma) was added. Gelation was performed under ultraviolet light (5 mW/cm2) for 10 min between an activated coverslip and a hydrophobically treated glass slide. Encapsulated cells were detached and placed in cell culture medium for further culture.
Cell source and culture
B16F0 cell lines were obtained from the American Type Culture Collection (ATCC) and cultured according to the recommended protocols [high-glucose Dulbecco’s modified Eagle’s medium supplemented with 10% fetal bovine serum (Gibco) and 1% penicillin/streptomycin (Lonza)]. hMVECs (Cell Systems) were cultured in EGM-2 (Lonza). For cell culture, medium was changed every 3 days, and cells were passaged at nearly 90% confluence using 0.25% trypsin (for B16F0s) or 0.05% trypsin (for hMVECs) (Gibco). B16F0s were tested for Mycoplasma contamination at Charles River Laboratories for cell line testing before in vivo inoculation.
In vitro tubulogenesis assay
The in vitro tubulogenesis assay was performed as described previously (51). Briefly, 25 μl of thawed reduced growth factor Matrigel (Trevigen) was added to the bottoms of 48-well plates and then allowed to gel for 30 min at 37°C. After gelation, 15,000 hMVECs were seeded per well in 100 μl of unsupplemented EBM-2 (Lonza), and 200 μl of B16F0 conditioned medium (conditioned from days 3 to 5; see fig. S4) was added to each well. Negative and positive controls were generated with unsupplemented or fully supplemented EBM-2, respectively. After 8 hours, hMVECs were imaged using a Rebel T3 Camera (Canon) at a ×25 magnification, and tube area was quantified using ImageJ. For coculture experiments, precultured B16F0s were additionally seeded at 5000 cells per well in addition to hMVECs.
Angiogenic cytokine arrays
For cytokine analysis in the conditioned medium, we used a mouse antibody angiogenesis array membrane (24 target proteins; ab139697, Abcam) as per the manufacturer’s instructions. Conditioned medium samples were incubated with blocked membranes overnight with the membranes at 4°C. Prepared membranes were exposed to an x-ray film and developed for the protein detection. Films were scanned and analyzed using the ImageJ plug-in “Protein array analyzer” (written by G. Carpentier, 2010; http://rsb.info.nih.gov/ij/macros/toolsets/Protein%20Array%20Analyzer.txt).
Immunofluorescence
Cells (B16F0s and hMVECs) were fixed using 4% paraformaldehyde for 20 min and permeabilized with 0.1% Triton X-100 for 30 min at room temperature. Bovine serum albumin (BSA; 1%) was used to block cells for 15 min, and then cells were stained with the appropriate primary and secondary antibodies (table S2). Before every step, cells were rinsed at least twice with PBS. Imaging was done using an LSM 700 (Carl Zeiss Inc.) four-laser point-scanning confocal microscope with a single pinhole for confocal imaging or an IN Cell Analyzer 2000 (GE Healthcare) for fluorescence imaging. Red and green cell trackers (Invitrogen) were used for coculture experiments on precultured B16F0s and hMVECs, respectively, as per the manufacturer’s instructions. Cells with cell trackers were fixed as described previously.
Inhibition assay and siRNA
Integrin-blocking antibodies α5β1 (Millipore) and αvβ3 (Santa Cruz Biotechnology) were added to cells at 1 μg/ml in medium before seeding and after changing the medium at 1 μg/ml. MAPK inhibitors [FR180204 (ERK1/2), SP600125 (JNK), and SB202190 (p38); 6 μM; Calbiochem], cytoskeletal inhibitor [blebbistatin (1 μM) and Y27632 (2 μM); Calbiochem], BMP inhibitor (Noggin; 5 ng/ml; ProSpec), GSK-3 inhibitor (CHIR; 10 nM; Calbiochem), HIF1 inhibitor (methyl 3-[[2-[4-(2-adamantyl)phenoxy]acetyl]amino]-4-hydroxybenzoate; 10 nM; Santa Cruz Biotechnology), hydrocortisone (0.5 mM; Tocris), and HSS (0.1 mg/ml; Tocris) were added to the medium after cell seeding with the first medium change. For inhibition assays, B16F0s were cultured for 3 days with the inhibitors, washed twice with PBS, and then cultured with fresh medium without the inhibitors to prevent the addition of the drugs in the conditioned medium to hMVECs.
siRNAs for Jarid1B (ID: 75605; Trilencer-27 Mouse siRNA) or scrambled siRNAs were purchased from OriGene. Transfection was performed according to the vendor’s instructions. Lipofectamine 2000 was used for transfection (100 nM). As with inhibition assays, cells were washed twice with PBS at day 3 and cultured with fresh medium to be conditioned.
Cell labeling and flow cytometry
B16F0s cultured for 5 days on spiral-patterned or nonpatterned gels (12 identical substrates) were detached from the substrates by trypsin and broken down into a single-cell suspension. Cells were fixed in paraformaldehyde for 20 min. Cells were permeabilized in 0.1% Triton X-100 in PBS for 30 min and blocked in 1% BSA in PBS for 1 hour. Cells were incubated with primary antibodies in 1% BSA in PBS overnight at 4°C. Cells were then stained with secondary antibodies in 2% goat serum and 1% BSA in PBS for 20 min in a humid chamber (5% CO2 and 37°C). Before every step, cells were washed at least three times with PBS. Flow cytometric analysis was performed with a BD LSR Fortessa flow cytometer. For negative controls to set the baseline, cells stained without primary antibodies were used.
Chick chorioallantoic assay
Embryonated chicken eggs at day 10 were obtained from the University of Illinois poultry farm (Urbana, IL). A rectangle-shaped hole with a width of ~20 mm and a length of ~10 mm was drilled, and B16F0s cultured on nonpatterned or spiral-patterned PA gels with or without an α5β1 integrin–blocking antibody or ERK inhibitor were placed facedown on the CAM. The hole was completely covered with a Scotch tape, and the eggs were incubated for 5 days (37°C and ~50% humidity). After 5 days in culture, embryos were fixed with 4% paraformaldehyde overnight. CAMs containing hydrogels with cells were excised and washed with distilled water for at least three times. The explants were imaged, and the area covered with blood vessels over the gels was quantified using ImageJ, as described for the in vitro tubulogenesis assays above.
Ethics statement
All experiments using live animals (mice) were in compliance with animal welfare ethical regulations and approved by the Institute Animal Care and Use Committee before experimentation, following the principles outlined by the American Physiological Society on research animal use.
B16F0 melanoma in vivo models
For the in vivo study, around 6- to 8-week-old female C57BL/6 mice were purchased from Charles River Laboratories for the animal experiment. To form primary localized tumors, B16F0s (5 × 10⁵ cells in 100 μl of Hanks’ balanced salt solution) cultured on spiral-patterned or nonpatterned PA gels were trypsinized and subcutaneously injected with or without Matrigel (50% v/v) into the right lateral flank (n, specified in each figure). Experiments were stopped after 7 days in culture.
In vivo molecular imaging of angiogenesis
One to 3 weeks after xenograft initiation, all animals were anesthetized with 1 to 3% isoflurane, the neck area was shaved, and the left jugular vein was isolated for placement of a PE-10 polyurethane catheter to facilitate the injection of the radiotracer. The animals were injected with 80 μCi of 64Cu-NOTA-PEG4-cRGD2 targeted to αvβ3 (a well-characterized marker of angiogenesis). Imaging was performed using a hybrid small-animal microPET-CT scanner (Inveon, Siemens Healthcare). The animals were placed on the animal bed, and 60 min after radiotracer injection, a 15-min microPET imaging session was performed. This was followed by a high-resolution anatomical microCT imaging (360 projections; energy, 80 keV/500 μA). The microPET and microCT images were reconstructed using OSEM (ordered subset expectation maximization)/3D algorithm (Siemens Healthcare) and cone beam technique (COBRA, Exxim), respectively.
PET-CT image analysis
PET-CT images of tumor-bearing animals were analyzed using the Inveon Research Workplace (Siemens Healthcare). Volumes of interest (VOIs) were created by manually tracing tumors on CT, which were visible, with numerous 2D axial regions of interest, followed by the interpolation of those 2D regions to yield the tumor VOIs. Percent injected dose per gram tissue (% ID/g) was then calculated for each tumor.
Immunohistochemistry
Formalin-fixed melanoma tumors from patterned and nonpatterned groups were trimmed and processed into paraffin-embedded tissue blocks. Tissue sections cut from the blocks for immunohistochemistry were mounted onto glass slides, deparaffinized in xylene, and rehydrated in ethanol. Trypsin (0.1%) was used as a pretreatment, followed by blocking of the endogenous peroxidase activity with Peroxidazed 1 (PX968) for 5 min and blocking of nonspecific background staining with Background Punisher (BP974) for 10 min. Blocked slides were incubated with polyclonal rabbit anti-human von Willebrand factor antibody (A0082, Dako) at 1:1000 for 30 min. The slides were then incubated with a rabbit-on-canine horseradish peroxidase secondary antibody (RC542) for 30 min. The chromogen ImmPACT NovaRED (SK-4805, Vector Laboratories) was applied for 10 min to develop slides, followed by nuclear counterstaining with CAT hematoxylin for 5 min. Individual steps were followed by washing in either wash buffer or deionized water, if necessary. Negative controls were processed identically, as above, but in the absence of primary antibody. Mouse spleen was used a positive control.
Quantification of microvessel density
Single tumor tissue sections stained for von Willebrand factor (factor VIII) were evaluated for both patterned and nonpatterned groups. For each tumor, microvessel density was quantified microscopically by averaging the number of individualized, intratumoral vascular elements enumerated within three separate vascular “hotspots” at ×200 magnification. Vascular hotspots were identified visually by scanning the entire tumor tissue section at ×100 magnification. All tissue sections were evaluated by a single veterinary pathologist (K.L.W.).
Microarray data analysis
Microarray data were obtained from a previous study (accession number: GSE79085). Genes in VEGF signaling were selected on the basis of the DAVID (Database for Annotation, Visualization and Integrated Discovery) Bioinformatics Database (http://david.abcc.ncifcrf.gov). A panel of genes regulated by HIF1 was selected from a previous report by Hirota and Semenza (52). Genes with negligible expression (below 10) and low fold change between conditions (below 1.5-fold) were excluded from analysis. Heat maps for fold changes over glass in gene expression were generated by using the Gene-E (www.broadinstitute.org/cancer/software/GENE-E) software package. A log2 fold increase was used to compare global changes in the expression analysis of transcripts associated with VEGF signaling and genes regulated by HIF1 for cells cultured on nonpatterned and spiral-patterned gels.
Statistical analysis
Data were obtained from at least three independent experiments. Error bars represent SD (immunofluorescence study of B16F0s) or SEM (angiogenesis assays in hMVECs). Student’s t test was used for statistical comparisons between two groups, and ANOVA with Tukey’s post hoc testing was used for multiple comparisons. Differences were considered significant at P < 0.05.
Supplementary Material
Acknowledgments
We thank the Beckman Institute Imaging Technology Group facilities, Institute of Genomic Biology Imaging facilities, Micro and Nanotechnology Laboratory facilities, and the Roy J. Carver Biotechnology Center. Funding: This research was supported with funding from the NSF (grant 1454616 CAR). Graduate student support was provided by the Morris Animal Foundation (to K.L.W.) and the Beckman Foundation (to J.H.). Author contributions: J.L., A.A.A., and K.A.K. conceived the ideas and designed the experiments. J.L., A.A.A., I.T.D., J.H., K.L.W., and T.M.F. conducted the experiments. J.L., A.A.A., K.L.W., T.M.F., J.H., L.W.D., and K.A.K. analyzed the data. All authors interpreted the data and wrote the manuscript. Competing interests: The authors declare that they have no competing interests. Data and materials availability: All data needed to evaluate the conclusions in the paper are present in the paper and/or the Supplementary Materials. Any additional data sets, analysis details, and materials recipes are available upon request. Correspondence and requests for materials should be addressed to K.A.K.
SUPPLEMENTARY MATERIALS
Supplementary material for this article is available at http://advances.sciencemag.org/cgi/content/full/3/10/e1701350/DC1
fig. S1. Schematic of the process used to pattern cells on surface-modified PA hydrogels.
fig. S2. Relative cell number of B16F0s cultured for 5 days in different conditions.
fig. S3. Relative tube area of hMVECs with conditioned medium from patterned B16F0s compared to those cultured with control medium.
fig. S4. Relative numbers and immunofluorescence intensity (CD271) of B16F0s and tube area of hMVECs cultured with different conditioned medium.
fig. S5. Quantitation of relative tube area of hMVECs cocultured with B16F0s precultured on torus-patterned and representative immunofluorescence images for each condition.
fig. S6. Medium conditions for normal, inhibition, or siRNA transfection.
fig. S7. Schematic of the processes used for in ovo and in vivo studies.
table S1. Normalized values for angiogenic cytokines relative to nonpatterned B16F0s in culture for spiral shapes with or without blocking integrin α5β1 or inhibiting ERK.
table S2. Cell culture reagent information.
table S3. Antibody information for immunostaining, flow cytometry, and immunohistochemistry.
REFERENCES AND NOTES
- 1.American Cancer Society, Cancer Facts & Figures 2016 (American Cancer Society, 2016), pp. 1–9. [Google Scholar]
- 2.Yang G., Rajadurai A., Tsao H., Recurrent patterns of dual RB and p53 pathway inactivation in melanoma. J. Invest. Dermatol. 125, 1242–1251 (2005). [DOI] [PubMed] [Google Scholar]
- 3.Tsao H., Goel V., Wu H., Yang G., Haluska F. G., Genetic interaction between NRAS and BRAF mutations and PTEN/MMAC1 inactivation in melanoma. J. Invest. Dermatol. 122, 337–341 (2004). [DOI] [PMC free article] [PubMed] [Google Scholar]
- 4.Burgess D. J., Epigenetics: Melanoma insights written in the DNA. Nat. Rev. Cancer 12, 738–739 (2012). [DOI] [PubMed] [Google Scholar]
- 5.de Unamuno B., Palanca S., Botella R., Update on melanoma epigenetics. Curr. Opin. Oncol. 27, 420–426 (2015). [DOI] [PubMed] [Google Scholar]
- 6.Kaufman C. K., Mosimann C., Fan Z. P., Yang S., Thomas A. J., Ablain J., Tan J. L., Fogley R. D., Rooijen E. V., Hagedorn E. J., Ciarlo C., White R. M., Matos D. A., Puller A.-C., Santoriello C., Liao E. C., Young R. A., Zon L. I., A zebrafish melanoma model reveals emergence of neural crest identity during melanoma initiation. Science 351, aad2197 (2016). [DOI] [PMC free article] [PubMed] [Google Scholar]
- 7.Schatton T., Frank M. H., Cancer stem cells and human malignant melanoma. Pigment Cell Melanoma Res. 21, 39–55 (2008). [DOI] [PMC free article] [PubMed] [Google Scholar]
- 8.Boiko A. D., Razorenova O. V., van de Rijn M., Swetter S. M., Johnson D. L., Ly D. P., Butler P. D., Yang G. P., Joshua B., Kaplan M. J., Longaker M. T., Weissman I. L., Human melanoma-initiating cells express neural crest nerve growth factor receptor CD271. Nature 466, 133–137 (2010). [DOI] [PMC free article] [PubMed] [Google Scholar]
- 9.Ma J., Lin J. Y., Alloo A., Wilson B. J., Schatton T., Zhan Q., Murphy G. F., Waaga-Gasser A.-M., Gasser M., Stephen Hodi F., Frank N. Y., Frank M. H., Isolation of tumorigenic circulating melanoma cells. Biochem. Biophys. Res. Commun. 402, 711–717 (2010). [DOI] [PMC free article] [PubMed] [Google Scholar]
- 10.Schonberg D. L., Lubelski D., Miller T. E., Rich J. N., Brain tumor stem cells: Molecular characteristics and their impact on therapy. Mol. Aspects Med. 39, 82–101 (2013). [DOI] [PMC free article] [PubMed] [Google Scholar]
- 11.Meacham C. E., Morrison S. J., Tumour heterogeneity and cancer cell plasticity. Nature 501, 328–337 (2013). [DOI] [PMC free article] [PubMed] [Google Scholar]
- 12.Piccirillo S. G. M., Combi R., Cajola L., Patrizi A., Redaelli S., Bentivegna A., Baronchelli S., Maira G., Pollo B., Mangiola A., DiMeco F., Dalprà L., Vescovi A. L., Distinct pools of cancer stem-like cells coexist within human glioblastomas and display different tumorigenicity and independent genomic evolution. Oncogene 28, 1807–1811 (2009). [DOI] [PubMed] [Google Scholar]
- 13.Liu J., Tan Y., Zhang H., Zhang Y., Xu P., Chen J., Poh Y.-C., Tang K., Wang N., Huang B., Soft fibrin gels promote selection and growth of tumorigenic cells. Nat. Mater. 11, 734–741 (2012). [DOI] [PMC free article] [PubMed] [Google Scholar]
- 14.Tan Y., Tajik A., Chen J., Jia Q., Chowdhury F., Wang L., Chen J., Zhang S., Hong Y., Yi H., Wu D. C., Zhang Y., Wei F., Poh Y.-C., Seong J., Singh R., Lin L.-J., Doğanay S., Li Y., Jia H., Ha T., Wang Y., Huang B., Wang N., Matrix softness regulates plasticity of tumour-repopulating cells via H3K9 demethylation and Sox2 expression. Nat. Commun. 5, 4619 (2014). [DOI] [PMC free article] [PubMed] [Google Scholar]
- 15.Lee J., Abdeen A. A., Wycislo K. L., Fan T. M., Kilian K. A., Interfacial geometry dictates cancer cell tumorigenicity. Nat. Mater. 15, 856–862 (2016). [DOI] [PubMed] [Google Scholar]
- 16.Weidner N., Carroll P. R., Flax J., Blumenfeld W., Folkman J., Tumor angiogenesis correlates with metastasis in invasive prostate carcinoma. Am. J. Pathol. 143, 401–409 (1993). [PMC free article] [PubMed] [Google Scholar]
- 17.Folkman J., Tumor angiogenesis: Therapeutic implications. N. Engl. J. Med. 285, 1182–1186 (1971). [DOI] [PubMed] [Google Scholar]
- 18.Ingber D. E., Folkman J., Mechanochemical switching between growth and differentiation during fibroblast growth factor-stimulated angiogenesis in vitro: Role of extracellular matrix. J. Cell Biol. 109, 317–330 (1989). [DOI] [PMC free article] [PubMed] [Google Scholar]
- 19.Kerbel R. S., Tumor angiogenesis. N. Engl. J. Med. 358, 2039–2049 (2008). [DOI] [PMC free article] [PubMed] [Google Scholar]
- 20.Ferrara N., Gerber H.-P., LeCouter J., The biology of VEGF and its receptors. Nat. Med. 9, 669–676 (2003). [DOI] [PubMed] [Google Scholar]
- 21.John A., Tuszynski G., The role of matrix metalloproteinases in tumor angiogenesis and tumor metastasis. Pathol. Oncol. Res. 7, 14–23 (2001). [DOI] [PubMed] [Google Scholar]
- 22.Pugh C. W., Ratcliffe P. J., Regulation of angiogenesis by hypoxia: Role of the HIF system. Nat. Med. 9, 677–684 (2003). [DOI] [PubMed] [Google Scholar]
- 23.Liao D., Johnson R. S., Hypoxia: A key regulator of angiogenesis in cancer. Cancer Metastasis Rev. 26, 281–290 (2007). [DOI] [PubMed] [Google Scholar]
- 24.Ke Q., Costa M., Hypoxia-inducible factor-1 (HIF-1). Mol. Pharmacol. 70, 1469–1480 (2006). [DOI] [PubMed] [Google Scholar]
- 25.Xu Q., Briggs J., Park S., Niu G., Kortylewski M., Zhang S., Gritsko T., Turkson J., Kay H., Semenza G. L., Cheng J. Q., Jove R., Yu H., Targeting Stat3 blocks both HIF-1 and VEGF expression induced by multiple oncogenic growth signaling pathways. Oncogene 24, 5552–5560 (2005). [DOI] [PubMed] [Google Scholar]
- 26.Carbajo-Pescador S., Ordoñez R., Benet M., Jover R., García-Palomo A., Mauriz J. L., González-Gallego J., Inhibition of VEGF expression through blockade of Hif1α and STAT3 signalling mediates the anti-angiogenic effect of melatonin in HepG2 liver cancer cells. Br. J. Cancer 109, 83–91 (2013). [DOI] [PMC free article] [PubMed] [Google Scholar]
- 27.Cao Y., Li C.-Y., Moeller B. J., Yu D., Zhao Y., Dreher M. R., Shan S., Dewhirst M. W., Observation of incipient tumor angiogenesis that is independent of hypoxia and hypoxia inducible factor-1 activation. Cancer Res. 65, 5498–5505 (2005). [DOI] [PubMed] [Google Scholar]
- 28.Meierjohann S., Hypoxia-independent drivers of melanoma angiogenesis. Front. Oncol. 5, 102 (2015). [DOI] [PMC free article] [PubMed] [Google Scholar]
- 29.Zhang Y., Zhang N., Dai B., Liu M., Sawaya R., Xie K., Huang S., FoxM1B transcriptionally regulates vascular endothelial growth factor expression and promotes the angiogenesis and growth of glioma cells. Cancer Res. 68, 8733–8742 (2008). [DOI] [PMC free article] [PubMed] [Google Scholar]
- 30.Breier G., Blum S., Peli J., Groot M., Wild C., Risau W., Reichmann E., Transforming growth factor-β and Ras regulate the VEGF/VEGF-receptor system during tumor angiogenesis. Int. J. Cancer 97, 142–148 (2002). [DOI] [PubMed] [Google Scholar]
- 31.Schaafhausen M. K., Yang W.-J., Centanin L., Wittbrodt J., Bosserhoff A., Fischer A., Schartl M., Meierjohann S., Tumor angiogenesis is caused by single melanoma cells in a manner dependent on reactive oxygen species and NF-κB. J. Cell Sci. 126, 3862–3872 (2013). [DOI] [PubMed] [Google Scholar]
- 32.Barnhill R. L., Levy M. A., Regressing thin cutaneous malignant melanomas (< or = 1.0 mm) are associated with angiogenesis. Am. J. Pathol. 143, 99–104 (1993). [PMC free article] [PubMed] [Google Scholar]
- 33.Gray-Schopfer V., Wellbrock C., Marais R., Melanoma biology and new targeted therapy. Nature 445, 851–857 (2007). [DOI] [PubMed] [Google Scholar]
- 34.Bhatia S., Tykodi S. S., Thompson J. A., Treatment of metastatic melanoma: An overview. Oncology 23, 488–496 (2009). [PMC free article] [PubMed] [Google Scholar]
- 35.Streit M., Detmar M., Angiogenesis, lymphanoangiogenesis, and melanoma metastasis. Oncogene 22, 3172–3179 (2003). [DOI] [PubMed] [Google Scholar]
- 36.Lee J., Abdeen A. A., Zhang D., Kilian K. A., Directing stem cell fate on hydrogel substrates by controlling cell geometry, matrix mechanics and adhesion ligand composition. Biomaterials 34, 8140–8148 (2013). [DOI] [PubMed] [Google Scholar]
- 37.Brooks P. C., Clark R. A., Cheresh D. A., Requirement of vascular integrin alpha v beta 3 for angiogenesis. Science 264, 569–571 (1994). [DOI] [PubMed] [Google Scholar]
- 38.Brooks P. C., Montgomery A. M. P., Rosenfeld M., Reisfeld R. A., Hu T., Klier G., Cheresh D. A., Integrin αvβ3 antagonists promote tumor regression by inducing apoptosis of angiogenic blood vessels. Cell 79, 1157–1164 (1994). [DOI] [PubMed] [Google Scholar]
- 39.Wang G. L., Jiang B. H., Rue E. A., Semenza G. L., Hypoxia-inducible factor 1 is a basic-helix-loop-helix-PAS heterodimer regulated by cellular O2 tension. Proc. Natl. Acad. Sci. U.S.A. 92, 5510–5514 (1995). [DOI] [PMC free article] [PubMed] [Google Scholar]
- 40.Hellwig-Bürgel T., Rutkowski K., Metzen E., Fandrey J., Jelkmann W., Interleukin-1β and tumor necrosis factor-α stimulate DNA binding of hypoxia-inducible factor-1. Blood 94, 1561–1567 (1999). [PubMed] [Google Scholar]
- 41.Feldser D., Agani F., Iyer N. V., Pak B., Ferreira G., Semenza G. L., Reciprocal positive regulation of hypoxia-inducible factor 1α and insulin-like growth factor 2. Cancer Res. 59, 3915–3918 (1999). [PubMed] [Google Scholar]
- 42.Salnikow K., Blagosklonny M. V., Ryan H., Johnson R., Costa M., Carcinogenic nickel induces genes involved with hypoxic stress. Cancer Res. 60, 38–41 (2000). [PubMed] [Google Scholar]
- 43.Haddad J. J., Land S. C., A non-hypoxic, ROS-sensitive pathway mediates TNF-α-dependent regulation of HIF-1α. FEBS Lett. 505, 269–274 (2001). [DOI] [PubMed] [Google Scholar]
- 44.Kumar S. M., Yu H., Edwards R., Chen L., Kazianis S., Brafford P., Acs G., Herlyn M., Xu X., Mutant V600E BRAF increases hypoxia inducible factor-1α expression in melanoma. Cancer Res. 67, 3177–3184 (2007). [DOI] [PubMed] [Google Scholar]
- 45.Li Y. M., Zhou B. P., Deng J., Pan Y., Hay N., Hung M.-C., A hypoxia-independent hypoxia-inducible factor-1 activation pathway induced by phosphatidylinositol-3 kinase/Akt in HER2 overexpressing cells. Cancer Res. 65, 3257–3263 (2005). [DOI] [PubMed] [Google Scholar]
- 46.Sang N., Stiehl D. P., Bohensky J., Leshchinsky I., Srinivas V., Caro J., MAPK signaling up-regulates the activity of hypoxia-inducible factors by its effects on p300. J. Biol. Chem. 278, 14013–14019 (2003). [DOI] [PMC free article] [PubMed] [Google Scholar]
- 47.Niu G., Wright K. L., Huang M., Song L., Haura E., Turkson J., Zhang S., Wang T., Sinibaldi D., Coppola D., Heller R., Ellis L. M., Karras J., Bromberg J., Pardoll D., Jove R., Yu H., Constitutive Stat3 activity up-regulates VEGF expression and tumor angiogenesis. Oncogene 21, 2000–2008 (2002). [DOI] [PubMed] [Google Scholar]
- 48.Bao S., Wu Q., Sathornsumetee S., Hao Y., Li Z., Hjelmeland A. B., Shi Q., McLendon R. E., Bigner D. D., Rich J. N., Stem cell–like glioma cells promote tumor angiogenesis through vascular endothelial growth factor. Cancer Res. 66, 7843–7848 (2006). [DOI] [PubMed] [Google Scholar]
- 49.Grange C., Tapparo M., Collino F., Vitillo L., Damasco C., Deregibus M. C., Tetta C., Bussolati B., Camussi G., Microvesicles released from human renal cancer stem cells stimulate angiogenesis and formation of lung premetastatic niche. Cancer Res. 71, 5346–5356 (2011). [DOI] [PubMed] [Google Scholar]
- 50.Lee J., Abdeen A. A., Huang T. H., Kilian K. A., Controlling cell geometry on substrates of variable stiffness can tune the degree of osteogenesis in human mesenchymal stem cells. J. Mech. Behav. Biomed. Mater. 38, 209–218 (2014). [DOI] [PubMed] [Google Scholar]
- 51.Abdeen A. A., Weiss J. B., Lee J., Kilian K. A., Matrix composition and mechanics direct proangiogenic signaling from mesenchymal stem cells. Tissue Eng. Part A 20, 2737–2745 (2014). [DOI] [PMC free article] [PubMed] [Google Scholar]
- 52.Hirota K., Semenza G. L., Regulation of angiogenesis by hypoxia-inducible factor 1. Crit. Rev. Oncol. Hematol. 59, 15–26 (2006). [DOI] [PubMed] [Google Scholar]
Associated Data
This section collects any data citations, data availability statements, or supplementary materials included in this article.
Supplementary Materials
Supplementary material for this article is available at http://advances.sciencemag.org/cgi/content/full/3/10/e1701350/DC1
fig. S1. Schematic of the process used to pattern cells on surface-modified PA hydrogels.
fig. S2. Relative cell number of B16F0s cultured for 5 days in different conditions.
fig. S3. Relative tube area of hMVECs with conditioned medium from patterned B16F0s compared to those cultured with control medium.
fig. S4. Relative numbers and immunofluorescence intensity (CD271) of B16F0s and tube area of hMVECs cultured with different conditioned medium.
fig. S5. Quantitation of relative tube area of hMVECs cocultured with B16F0s precultured on torus-patterned and representative immunofluorescence images for each condition.
fig. S6. Medium conditions for normal, inhibition, or siRNA transfection.
fig. S7. Schematic of the processes used for in ovo and in vivo studies.
table S1. Normalized values for angiogenic cytokines relative to nonpatterned B16F0s in culture for spiral shapes with or without blocking integrin α5β1 or inhibiting ERK.
table S2. Cell culture reagent information.
table S3. Antibody information for immunostaining, flow cytometry, and immunohistochemistry.