Abstract
We report atomically detailed molecular dynamics simulations of the permeation of the lethal factor (LF) N-terminal segment through the anthrax channel. The N-terminal chain is unstructured and leads the permeation process for the LF protein. The simulations are conducted in explicit solvent with Milestoning theory, making it possible to extract kinetic information from nanoseconds to milliseconds time scales. We illustrate that the initial event is strongly influenced by the protonation states of the permeating amino acids. While the N-terminal segment passes easily at high protonation state through the anthrax channel (and the ϕ clamp), the initial permeation represents a critical step, which can be irreversible and establishes a hook in the channel mouth.
Graphical Abstract
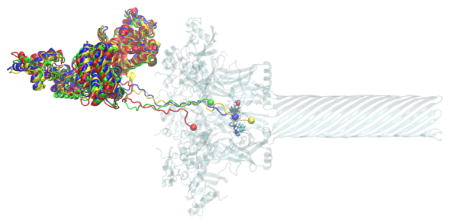
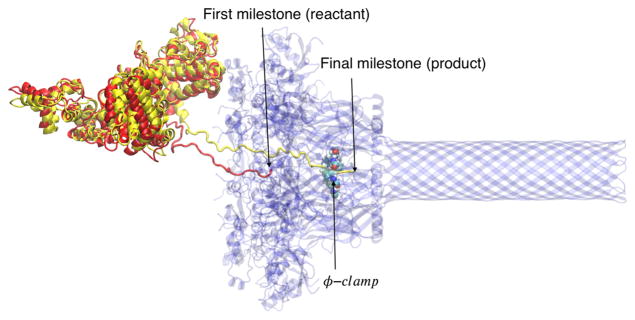
Anthrax is a serious infectious disease caused by a gram-positive, rod-shaped bacterium known as Bacillus Anthracis1. The toxin consists of three proteins: lethal factor (LF), edema factor (EF), and protective antigen (PA). A review of anthrax activity at the protein level is provided in Ref. [1]. In brief, PA is cleaved by a furin-related protease to generate PA63. Upon heptamerization, PA63 binds LF or EF competitively to form the pre-pore complex before being endocytosed. Endosome acidification then leads to the formation of the PA channel (Fig. 1). The PA channel translocates the proteins LF and EF into the cytosol. EF is a Ca2+- and calmodulin-dependent adenylate cyclase. LF acts as a Zn2+-dependent protease that specifically cleaves mitogen-activated protein kinase kinases (MAPKKs). The channel is divided into two parts: the cap, which is located at the endosome, and the β-barrel stem, which is inserted through the endosomal membrane. The length of the cap is about 75 Å, and the length of the stem is around 105 Å2. A narrower channel domain, called the ϕ-clamp, is located near the boundary of the cap and the stem. The ϕ-clamp includes seven phenylalanine residues (in the heptameric state) that restrict the channel width. That clamp was suggested to act as a gate for LF translocation3.
Figure 1.
The initial insertion of the lethal factor (in yellow or red) through the anthrax PA channel (blue). In red, we show the initial state of the LF N-terminal chain before permeating the channel2. In yellow, we show the final state of the N-terminal chain after passing the ϕ-clamp. In this work, we model the kinetics and thermodynamics of this early event of the translocation process. See text for definition of a milestone.
The permeating N-terminal part of LF (LFN) consists of 30 residues, of which 28 are not observed in the crystal structure4. As a result, the LF N-terminus is assumed unstructured. The disordered segment contains several acidic and basic residues4. Its sequence is AGGHGDVGMHVKEKEKNKDENKRKDEERNK. It contains eight negatively and nine positively charged residues at physiological conditions. With the high charge content of opposite signs, the protonation state of the LF peptide can be manipulated by high or low pH values. Importantly, experiments suggest that acidic conditions support the translocation process of LF 5–6.
The truncation of 27 or 36 residues at the LF N-terminus impairs acid-induced translocation of LFB (the binding domain of LF) across plasmatic membrane without significantly affecting the binding to the PA channel7. Our studies, which are restricted to early events of the process, do not examine unfolding of the rest of the protein. Therefore, our studies cannot capture the pH-dependence of the unfolding step. However, the N-terminal segment is unstructured and its permeation does not require unfolding. Interestingly, the protonation state of the N-terminal residues affects the rate of permeation of the leading peptide. Previously5 protonation was suggested to assist the unfolding event. Here, we propose that protonation also increases permeation of a chain that is already unstructured.
Ion conductance monitors the translocation of LFB across planar lipid bilayers7–8. Experiments suggest that the translocation across the endosomal membrane is driven by a proton gradient and electric field5 and a Brownian ratchet mechanism has been proposed.5,9 The narrow width observed in the cryo-EM structure2 suggests that the channel accommodates only unfolded structures. Another recent model addressing translocation through the narrow channel is of helix compression10. However, detailed molecular mechanisms are still uncertain. Using all-atom molecular dynamics (MD) simulations and the Milestoning theory to investigate the kinetics, we provide a comprehensive picture of early events in the translocation process. In our study, the starting position finds the LF N-terminal segment at the endosomal side of the membrane. The final state is when that segment passes the ϕ-clamp (Fig. 1).
An atomically detailed model of the complex of LF and the channel is required as a starting point for simulations of the transport process. The LF protein and the channel were docked to match the experimental structure of LF binding to the PA channel (PDB: 3KWV11). The parallel version of the NAMD program was used in the calculations12. More details on the simulation conditions are in Supporting Information.
The detailed theory and algorithm of Milestoning were discussed elsewhere13. Here we provide a brief outline, which we further elaborate on in Supporting Information. A Milestoning simulation is typically conducted in three steps. In the first step, anchors or centers of Voronoi cells in coarse space are generated14. Here we use configurations along a reaction coordinate, which is obtained by steered molecular dynamics (SMD). The simulation starts from the reactant (Fig. 1), and is biased toward the product. The biasing coordinate is the Cartesian displacement along the channel of the center of mass of the first residue of LFN. The origin is near the ϕ-clamp. The configurations of the SMD define centers of Voronoi cells. The boundaries of the Voronoi cells are the milestones. In the second step, initial conditions for the short trajectories are constructed at the milestones. These initial conditions are obtained by sampling from the canonical ensemble at the milestone15. In the third step, short trajectories are run between the interfaces of the Voronoi cells. 100 or 250 trajectories of picosecond length were used per milestone. From the short trajectories, we estimate the transition kernel, Kij, which is the probability that a trajectory that starts at milestone i will reach milestone j before any other milestone. We also extract the lifetime of a milestone, ti. The lifetime is the average time of a trajectory from initiation at a milestone i to termination at another milestone. The eigenvector with eigenvalue one of the matrix K is the vector of flux q or the number of trajectories that pass a milestone per unit time under steady state conditions. Milestoning theory provides the free energy of milestone i as Fi = −kBT log(qi·ti) and the overall mean first passage time (MFPT) to reach the product from the reactant , where qf is the flux to the product state. The free energy and the MFPT are the major outputs of the Milestoning calculations.
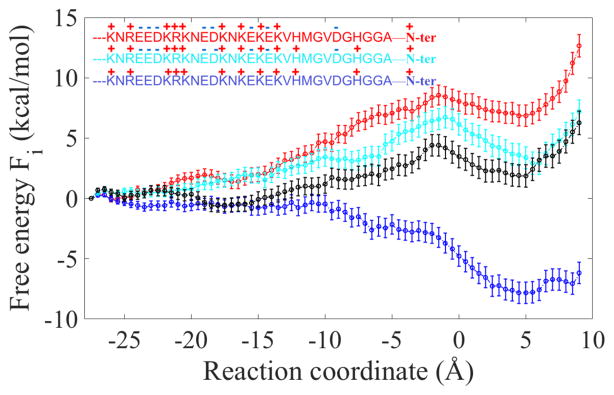
In Fig. 2, we show the free energy profile for the translocation of the LF N-terminus from the channel mouth to slightly beyond the ϕ-clamp. The reaction coordinate is the distance along the channel axis of the N-terminus from the ϕ-clamp. The calculation of the error bars is explained in Supporting Information.
Figure 2.
Free energy profiles for permeation of the N-terminal segment of anthrax lethal factor. Four protonation states are considered. The light blue curve is the free energy profile when the histidine residues of the N-terminus are protonated. The dark blue curve includes protonation of the acids as well. The insets on the left show the amino acids and their corresponding charges in the assumed protonation state. The zero is the position of the ϕ-clamp and negative values indicate the entry to the channel. The total charges of the red, light blue, and blue curves are +2, +4, and +12 respectively, including the charge at the N terminus. The black curve is for protonation states along the reaction coordinate sampled according to pKa calculations at pH=5. The black curve is similar to the curve of histidine protonation (light blue). See text and Supporting Information for more details.
Figure 2 illustrates the profound impact of protonation state on the free energy profile. We show four curves to span a maximum range of conditions; the mildly acidic conditions of pH=5 for biological activity are within this range. In the extreme case in which the histidine, the glutamic and the aspartic acids of LF are protonated (the dark blue curve), the permeation has no free energy barrier forward and the system glides down to a stable minimum. The barrier backwards, however, is significant (~8 kcal/mol), making the process highly favorable on the permeation side and mimicking the setup of a ratchet9. When the system is not protonated (red curve), permeation of the N-terminus is metastable. The neighborhood that follows the ϕ-clamp indicates a local minimum, but this minimum is higher in free energy compared to the state in which the N-terminal segment did not permeate (reactant). Protonation of the histidines produces an intermediate result (light blue curve) in which a metastable state is still observed that is only slightly less stable compared to the reactants. Metastable states have been detected in a recent experiment of peptide permeation through the anthrax channel16. The black curve was calculated with variable protonation conditions. For every milestone, we computed the pKa of the LFN residues using PROPKA317, as implemented in PDB2PQR18, and sampled protonation states for configurations that initiate milestone trajectories at pH=5. An alternative approach is to use constant pH MD calculations19. The results are similar to the light blue curve, in which only histidine residues are protonated, and are described in detailed in Supporting Information.
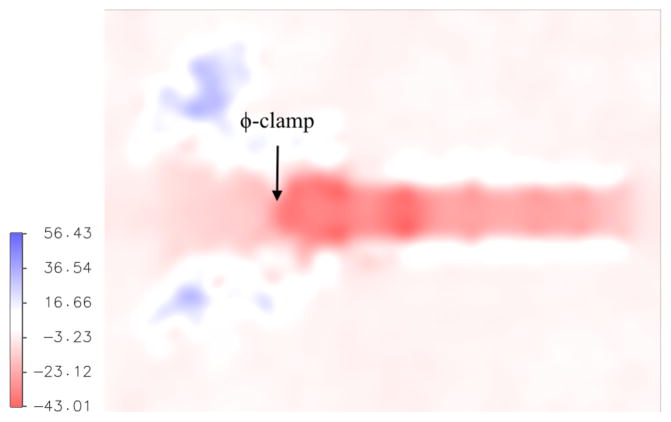
The electric potential is a strong driving force for translocation of protonated peptides. That potential is highly negative inside the channel, as shown in Figure 3. Hence the channel is “ready” to support positively charged groups that are obtained at low pH. The field is computed as an average over atomically detailed configurations saved in a 4.5 nanosecond trajectory of the channel in 100 mM NaCl aqueous solution, using the particle mesh Ewald technique.20–21
Figure 3.
The electric potential (units of kT/e where T=300 K) in the anthrax channel computed from structures sampled in explicit solvent molecular dynamics trajectories. The orientation of the channel is the same as in Fig. 1.
As the permeation process occurs at non-equilibrium conditions in the presence of a pH gradient, it is important to extend the investigation beyond equilibrium and free energy to kinetics. Kinetic considerations are particularly relevant to the function of the channel. Models for irreversible biological machines (ratchets) were proposed in the past for the anthrax transport machinery5,9.
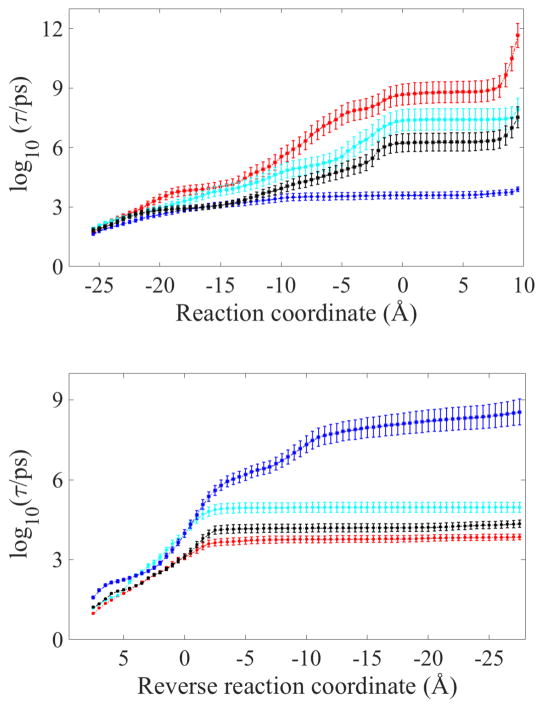
A useful measure of kinetics in complex systems is the mean first passage time (MFPT), or the average time that it takes a trajectory initiated at the reactant to reach the product state for the first time. MFPT is a well-defined entity for diverse rate laws; for example, first order or diffusive reactions. It is straightforward to compute the MFPT in Milestoning22 and an explicit equation was given above. In Figure 4, we show the MFPT as a function of the position along the reaction coordinate. In other words, given a trajectory that starts at the channel mouth, what is the average time to reach a particular distance between the LF N-terminus and the ϕ-clamp?
Figure 4.
The mean first passage time as a function of the reaction coordinate: the distance from the LF N-terminus along the channel axis to the ϕ-clamp in Angstroms. The color code is the same as in Fig. 2. The time is provided in a logarithmic scale. The top panel is the MFPT toward the ϕ-clamp from the channel mouth. The lower panel is the reverse process, from the ϕ-clamp to the mouth of the channel.
If the glutamic and aspartic acids of the LF N-terminus segment are protonated, the time scale to pass the ϕ-clamp is tens of nanoseconds (dark blue curves in Fig. 4 top). The process is a straightforward downhill diffusion and within reach of straightforward molecular dynamics. This protonation condition is suggested to act as an effective barrierless ratchet.
In neutral conditions (red curves in Fig. 4), the time scale forward and into the channel is on the millisecond time scale. The millisecond rate cannot be predicted with straightforward MD, but can be estimated with Milestoning. When the N-terminal segment is fully stretched and unfolding of the rest of the protein is required for further translocation, a steep increase in the MFPT is observed. This increase is consistent with the rise in the free energy profile in Figure 2. Hence the event of protein unfolding is a separate and a distinct step of LF permeation that is not investigated in the present study. Under the same neutral conditions, the reverse reaction is fast and occurs in the nanosecond time scale. Hence, it is difficult for the N-terminal segment to hold onto its position inside the channel mouth under minimal protonation. The LF N-terminus remains hooked at the ϕ-clamp only under low pH conditions. The existence of a minimum in the free energy (Fig. 2) is reflected in more curved MFPT plots of the neutral and intermediate states. In our simulations, the new metastable state is obtained after LFN passes the ϕ-clamp.
We identify channel residues that have significant interactions with the permeating LF N-terminal segment. Examples from acidic conditions are R470, T473, G474, E465, and F427 of the ϕ-clamp. More examples are provided in Supporting Information. We compare these mutations to experiments23–24. However, we consider only LFN translocation while experiments considered a more complete process.
Using the Milestoning theory, we computed the free energy profile and time scales of the initial translocation process of LFN through the anthrax PA channel in explicit solvent. We illustrate profound differences in the permeating free energy profiles when the protonation states of the N-terminal segment residues are modified to mimic acidic, minimal charge, and moderate protonation in biological systems1. The limit of high protonation supports a mechanism proposed earlier of a ratchet9. As the protonation level is reduced, an intermediate is observed in the neighborhood of the ϕ clamp and the free energy profile is less favorable for the product state. More detailed representation of protonation conditions is obtained by explicit pKa calculations that switch the protonation states as a function of the milestone for pH=5. Here the free energy and MFPT resemble the results of a model in which only the histidine residues are protonated.
Supplementary Material
Acknowledgments
Sandia National Laboratories (SNL) is a multi-mission laboratory managed and operated by National Technology and Engineering Solutions of Sandia, LLC. a wholly owned subsidiary of Honeywell International, Inc., for the U.S. DOE’s NNSA under contract DE-NA0003525. The financial support of the Defense Threat Reduction Agency is greatly appreciated. The work was performed, in part, at the Center for Integrated Nanotechnologies, an Office of Science User Facility operated for the U.S. DOE’s Office of Science by Los Alamos National Laboratory (Contract DE-AC52-06NA25396) and SNL. The work at University of Texas was supported by grants from the Welch Foundation F-1896, the NIH GM059796 and by an allocation from the Texas Advances Computing Center (TACC).
Footnotes
Supporting Information provides more details on the computational method and additional analyses of the permeation pathway.
References
- 1.Young JAT, Collier RJ. Ann Rev Biochem. 2007;76:243–265. doi: 10.1146/annurev.biochem.75.103004.142728. [DOI] [PubMed] [Google Scholar]
- 2.Jiang J, Penrellute BL, Collier JR, Zhou H. Nature. 2015;521:545–549. doi: 10.1038/nature14247. [DOI] [PMC free article] [PubMed] [Google Scholar]
- 3.Krantz BA, Melnyk RA, Zhang S, Juris SJ, Lacy DB, Wu ZY, Finkelstein A, Collier RJ. Science. 2005;309(5735):777–781. doi: 10.1126/science.1113380. [DOI] [PMC free article] [PubMed] [Google Scholar]
- 4.Pannifer AB, Wong TY, Schwarzenbacher R, Renatues M, Petosa C, Bienkowska J, Lacy DB, Collier RJ, Park S, Leppla SH, Hanna P, Liddington RC. Nature. 2001;414:229–233. doi: 10.1038/n35101998. [DOI] [PubMed] [Google Scholar]
- 5.Krantz BA, Finkelstein A, Collier RJ. J Mol Biol. 2006;355:968–979. doi: 10.1016/j.jmb.2005.11.030. [DOI] [PubMed] [Google Scholar]
- 6.Thoren KL, Worden EJ, Yassif JM, Krantz BA. Proc Natl Acad Sci USA. 2009;106:21555–21560. doi: 10.1073/pnas.0905880106. [DOI] [PMC free article] [PubMed] [Google Scholar]
- 7.Zhang S, Udho E, Wu ZY, Collier RJ, Finkelstein A. Biophys J. 2004;87:3842–3849. doi: 10.1529/biophysj.104.050864. [DOI] [PMC free article] [PubMed] [Google Scholar]
- 8.Zhang S, Finkelstein A, Collier RJ. Proc Natl Acad Sci USA. 2004;101:16756–16761. doi: 10.1073/pnas.0405754101. [DOI] [PMC free article] [PubMed] [Google Scholar]
- 9.Feld GK, Brown MJ, Krantz BA. Protein Sci. 2012;21:606–624. doi: 10.1002/pro.2052. [DOI] [PMC free article] [PubMed] [Google Scholar]
- 10.Das D, Krantz BA. Proc Natl Acad Sci USA. 2016;113:9611–9616. doi: 10.1073/pnas.1600624113. [DOI] [PMC free article] [PubMed] [Google Scholar]
- 11.Feld GK, Thoren KL, Kintzer AF, Sterling HJ, Tang II, Greenberg SG, Williams ER, Krantz BA. Nat Struct Mol Biol. 2010;17:1383–U245. doi: 10.1038/nsmb.1923. [DOI] [PMC free article] [PubMed] [Google Scholar]
- 12.Phillips JC, Braun R, Wang W, Gumbart J, Tajkhorshid E, Villa E, Chipot C, Skeel RD, Kale L, Schulten K. J Comput Chem. 2005;26:1781–1802. doi: 10.1002/jcc.20289. [DOI] [PMC free article] [PubMed] [Google Scholar]
- 13.Elber R. Q Rev Biophys. 2017;50:1–15. doi: 10.1017/S0033583517000063. [DOI] [PubMed] [Google Scholar]
- 14.Vanden-Eijnden E, Venturoli M. J Chem Phys. 2009;130:194101. doi: 10.1063/1.3129843. [DOI] [PubMed] [Google Scholar]
- 15.Majek P, Elber R. J Chem Theory Comput. 2010;6:1805–1817. doi: 10.1021/ct100114j. [DOI] [PMC free article] [PubMed] [Google Scholar]
- 16.Ghosai K, Colby JM, Das D, Joy ST, Arora PJ, Krantz BA. J Mol Biol. 2017;429:900–910. doi: 10.1016/j.jmb.2017.02.005. [DOI] [PMC free article] [PubMed] [Google Scholar]
- 17.Olsson MH, Sondergaard CR, Rostkowski M, Jensen JH. J Chem Theory Comput. 2011;8:525–537. doi: 10.1021/ct100578z. [DOI] [PubMed] [Google Scholar]
- 18.Dolinsky TJ, Nielsen JE, McCammon JA, Baker JA, Baker NA. Nucleic Acids Res. 2004;32:W665–W667. doi: 10.1093/nar/gkh381. [DOI] [PMC free article] [PubMed] [Google Scholar]
- 19.Chen W, Guang Y, Shen J. J Phys Chem Lett. 2016;7:3961–3966. doi: 10.1021/acs.jpclett.6b01853. [DOI] [PMC free article] [PubMed] [Google Scholar]
- 20.Essman U, Perera L, Berkowitz ML, Darden T, Lee H, Pedersen LG. J Chem Phys. 1995;103:8577–8593. [Google Scholar]
- 21.Aksimentiev A, Schulten K. Biophys J. 2005;88:3745–3761. doi: 10.1529/biophysj.104.058727. [DOI] [PMC free article] [PubMed] [Google Scholar]
- 22.Bello-Rivas JM, Elber R. J Chem Phys. 2015;142:094102. doi: 10.1063/1.4913399. [DOI] [PMC free article] [PubMed] [Google Scholar]
- 23.Sellman BR, Mourez M, Collier RJ. Science. 2001;292(5517):695–697. doi: 10.1126/science.109563. [DOI] [PubMed] [Google Scholar]
- 24.Sellman BR, Nassi S, Collier RJ. J Biol Chem. 2001;276:8371–8376. doi: 10.1074/jbc.M008309200. [DOI] [PubMed] [Google Scholar]
Associated Data
This section collects any data citations, data availability statements, or supplementary materials included in this article.


