

Abstract
Severe hypoglycemia has a detrimental impact on the cerebrovasculature, but the molecular events that lead to the disruption of the integrity of the tight junctions remain unclear. Here, we report that the microvessel integrity was dramatically compromised (59.41% of wild‐type mice) in TP53‐induced glycolysis and apoptosis regulator (TIGAR) transgenic mice stressed by hypoglycemia. Melatonin, a potent antioxidant, protects against hypoglycemic stress‐induced brain endothelial tight junction injury in the dosage of 400 nmol/L in vitro. FRET (fluorescence resonance energy transfer) imaging data of endothelial cells stressed by low glucose revealed that TIGAR couples with calmodulin to promote TIGAR tyrosine nitration. A tyrosine 92 mutation interferes with the TIGAR‐dependent NADPH generation (55.60% decreased) and abolishes its protective effect on tight junctions in human brain microvascular endothelial cells. We further demonstrate that the low‐glucose‐induced disruption of occludin and Caludin5 as well as activation of autophagy was abrogated by melatonin‐mediated blockade of nitrosative stress in vitro. Collectively, we provide information on the detailed molecular mechanisms for the protective actions of melatonin on brain endothelial tight junctions and suggest that this indole has translational potential for severe hypoglycemia‐induced neurovascular damage.
Keywords: autophagy, hypoglycemic stress, melatonin, neurovascular, tight junctions, TP53‐induced glycolysis and apoptosis regulator
1. INTRODUCTION
Brain microvascular endothelial cells form a barrier between the blood and the central nervous system that is critical for normal brain function.1, 2 This blood‐brain barrier (BBB) integrity is achieved primarily through the presence of tight and adherent junctions between astrocyte end‐feet encircling endothelial cells in cerebrovascular capillaries that maintaining the central nervous system homeostasis.3, 4 Hypoglycemia is a medical emergency that occurs frequently in over‐treated patients with diabetes mellitus. Patients can lose consciousness from hypoglycemia and may develop cerebral edema or even irreversible brain damage.5, 6 Hypoglycemic disruption of cerebral capillary tight junction integrity can worsen cerebrovascular diseases.7, 8 Despite its importance and relatively frequent occurrence in diabetes, the mechanisms behind endothelial cell junction disruption during hypoglycemia remain poorly understood.
TP53‐induced glycolysis and apoptosis regulator (TIGAR) is expressed in endothelial cells where it activates phosphofructokinase‐2 to inhibit glycolysis by hydrolyzing fructose‐2,6‐bisphosphate and fructose‐1,6‐bisphosphate, thereby promoting flux through the pentose phosphate pathway (PPP).9, 10 TIGAR also activates the mitochondrial respiratory chain and decreases redox stress.11, 12 TIGAR protects cerebral function by increasing levels of NADPH and reducing reactive oxygen species (ROS), thus limiting the effects of oxidative stress that drive apoptosis and autophagy.11, 13, 14, 15, 16
Brain function can be stressed by hypoxia, glucose deprivation, and reactive oxygen or nitrogen species, all of which cause human vascular endothelial cell dysfunction or injury.17, 18 Autophagy is a catabolic mechanism that involves the lysosomal degradation of cytoplasmic constituents that provides energy and structural building blocks to maintain cellular function.19, 20 However, how TIGAR regulates the brain endothelial barrier and autophagy remains unclear. Various reports have proposed that endothelial autophagy induces signaling by pro‐survival or pro‐death pathways. Thus, autophagy promotes oxidative21 and nitrosative stress17 that targets endothelial cells and impairs their protective functions.22, 23, 24 Moreover, nitrosative stress impairs autophagy during ischemia,17, 22 thereby suggesting a positive, self‐sustaining interaction. Autophagy is protective against damage caused by hypoxia to endothelial progenitor cells.25 TIGAR is expressed in endothelial cells where it mediates PPP flux, oxidation‐reduction balance and cell signaling and may thereby be an important protective mechanism for the BBB in neurovascular disease. Nevertheless, no study to date has documented a positive or negative role for TIGAR in neurovascular injury during autophagy triggered by metabolic stress.
Melatonin is an endogenously produced molecule with multiple beneficial functions in vertebrates, including in the human.26 Among its many actions, melatonin and metabolites are powerful antioxidative and antinitrosative agents.27, 28 In other experimental reports, melatonin has been shown to protect against cerebrovascular endothelial cell damage and reduce the accumulation of edema in the central nervous system.29, 30, 31 Based on these studies, we anticipated that melatonin may also prevent endothelial cell tight junction damage induced by hypoglycemic stress.
The human brain microvascular endothelial cells (HBMECs) were used to investigate whether melatonin could protect hypoglycemic stress‐induced brain endothelial tight junction injury. We also elucidate the molecular mechanisms of melatonin's protective actions by focusing on the role of nitrosative stress in regulating the cross talk between autophagy and TIGAR during disturbance of tight junction integrity.
2. MATERIALS AND METHODS
2.1. Hypoglycemic stress induction and experimental treatments of cell cultures
Human brain microvascular endothelial cells (HBMECs)22 were purchased from ScienCell Research Laboratories, Carlsbad, CA, and used for Western blot or immunocytochemistry. Endothelial cells were cultured in RPMI medium 1640 (31800022; Gibco) with fetal bovine serum (10099‐141; Gibco, Waltham, MA, USA) supplementation at 37°C in humidified conditions containing 5% CO2. For hypoglycemic stress, the endothelial cells were plated at 60%‐70% confluence in low‐glucose (1 mmol/L) medium for 24 hours. Control brain endothelial cells were cultured in normal glucose medium. For studies of autophagy and pharmacological inhibition, the endothelial cells were cultured with 3‐(3‐pyridinyl)‐1‐(4‐pyridinyl)‐2‐propen‐1‐one, 3PO (525330‐25MG; Calbiochem, Novabiochem, Boston, MA, USA), bafilomycin A1 (B1793; Sigma‐Aldrich, St. Louis, MO, USA) or wortmannin (35441‐1 ML; Sigma‐Aldrich) for 24 hours prior to lysis for Western blotting or immunofluorescence staining.
2.2. Plasmid construction and transfection
Claudin‐5 was modified by PCR and subcloned into pEGFPC1 between the XhoI and HindIII restriction sites. TIGAR and TIGAR (Y92A) were subcloned into p3*Flag‐CMV‐1 and pEYFPC1 between the EcoRI and KpnI restriction sites. Calmodulin was subcloned into pECFPC1 between the BglII and KpnI restriction sites. HBMEC or HEK293 cells were cultured in six‐well plates in growth medium and transiently transfected with plasmids using Lipofectamine 3000 (L3000015; Invitrogen, Carlsbad, CA, USA) in accordance with the manufacturer instructions. All the constructs were confirmed by sequencing.
2.3. Lentiviral transfection
Human brain microvascular endothelial cells were subcultured in growth medium at 18‐20 × 104 cells/well in 6‐well plates. The lentivirus encoding TIGAR was purchased from Shanghai GenePharma Co. Ltd (Shanghai, China). After growth to 50% confluence, cells were transfected with TIGAR‐lentivirus at MOI of 50. Cells were harvested after infection 72 hours.
2.4. TIGAR overexpression by TAT induction
HBMECs were cultured in RPMI 1640 medium at 37°C and 5% CO2, in 1 mmol/L glucose for hypoglycemic injury. TIGAR (C12ORF5) Human Recombinant, TAT (PRO‐1580; Prospec, Ness‐Ziona, Israel), was transfected into endothelial cells as instructed by the manufacturer with empty vector cells as control. After 48 hours, the cells were collected for experiments. Western blot confirmed TIGAR overexpression at 48 hours.
2.5. Fluorescence resonance energy transfer
YFP‐labeled TIGAR (TIGAR‐pEYFPC1) and CFP‐labeled calmodulin (CaM‐pECFPC1) plasmids were co‐transfected into HEK‐293 cells for Fluorescence Resonance Energy Transfer (FRET) assay.32 Acceptor photobleaching experiments were completed using a Nikon A1 confocal microscope (FV1000‐fluoview) with a 40 mW argon laser. CFP (donor) was excited with the 405 nm line of the argon laser and YFP (acceptor) with the 515 nm line. The cells were examined with 60× oil‐immersion objectives and bleached in the YFP channel to scan a region of interest using the 515 nm argon laser line at 100% intensity (95 Mw laser power). Bleaching lasted from 2 to 4 seconds, depending on the locations of bleached ROIs. Before and after YFP photobleaching, CFP images were acquired to evaluate variations in donor fluorescence. Percent fluorescence was calculated as average fluorescence intensity (AI) of postbleach/AI of prebleach.
2.6. RNA interference
Atg5 siRNAs or nontarget control siRNAs were introduced into human brain endothelial cells with the Lipofectamine RNAiMAX Reagent (13778‐150; Life Technologies, Carlsbad, CA, USA) in accordance with the manufacturer's instructions. Cells were collected after 72 hours for Western blot analysis of whole cell lysates to confirm the knockdown. siATG5 (sc‐41446) and a scrambled negative control (sc‐37007) were obtained from Santa Cruz Biotechnology (Santa Cruz, CA, USA).
2.7. In vitro protein nitration and mass spectrometric assay
Recombinant human TIGAR (10 μg) produced in Escherichia Coli (7217‐10; Biovision, Milpitas, CA, USA) was incubated for 1 hours with 100 μmol/L ONOO− or vehicle in 50 mmol/L phosphate buffer (pH 7.4) containing 0.1% lauryl‐b‐D‐maltoside,33 reacted with 9% of ethanol at 40°C for 15 minutes and centrifuged at 75 000 g for 35 minutes. The ONOO−‐treated TIGAR (10 μg/lane) was subjected to SDS‐PAGE. The bands of silver staining that corresponded with recombinant TIGAR were excised for mass spectrometry. Nano‐LC/MS/MS was performed using a Thermo Finnigan LTQ mass spectrometer with a nanospray source in the positive ion mode. Sequence information from the data was processed using the Mascot 2.0 active perl script with standard data‐processing parameters. The data were analyzed by MASCOT 2.0 (Matrix Science, Boston, MA, USA). A nitrated peptide was identified from a mass shift with ONOO− with an addition to the matching y and b ions compared to the untreated protein.
2.8. Measurement of NADPH levels
Brain endothelial cells were cultured in six‐well plates in the growth medium, transfected with plasmid DNAs encoding TIGAR and TIGAR (Y92A) or empty plasmid controls using Lipofectamine 3000 (L3000015; Invitrogen) and subjected to hypoglycemia‐induced stress as maintained in control medium. Intracellular NADPH levels were measured after 24 hours using the EnzyChrom assay kit (ECNP‐048; BioAssay Systems, Hayward, CA, USA) according to the manufacturer's instructions.
2.9. Cell fractionation, immunoprecipitation, and immunoblot assay
The human brain endothelial cells were washed with PBS and lysed in NaCl 150 mmol/L, TRIS‐HCl (pH 7.4) 10 mmol/L, 1% Triton X‐100, 0.1% SDS, 1% sodium deoxycholate, edetic acid 5 mmol/L, 1 protease inhibitor cocktail tablet (sc‐29130; Santa Cruz Biotechnology)/10 mL and 1 mmol/L phenyl methylsulfonyl fluoride (PMSF) (P7626; Sigma‐Aldrich), centrifuged for 30 minutes at 15 000 g, and immunoblotted in endothelial cell lysates using the Bradford's solution. Cell lysates with equal amounts of protein were applied to 10%‐13.5% acrylamide denaturing gels (SDS‐polyacrylamide gel electrophoresis [PAGE]).22 The proteins were shifted to the PVDF membrane (IPVH00010; Millipore, Darmstadt, Germany) for 1 hour at 50 V. Membranes were blocked in 20 mmol/L Tris‐HCl (PH 7.4), 0.1% Tween 20 (TBS‐T) and 150 mmol/L NaCl containing 5% fat‐free milk for 1 hour and immunodetected with specific antibodies against TIGAR (1:2000, ab37910; Abcam, Cambridge, UK), LC3 (1:1000, 2775; Cell Signaling, Danvers, MA, USA), occludin (1:1000, 71‐1500; Invitrogen), nitrotyrosine (1:1000, 05‐233; Millipore) and β‐actin (1:5000, A5316; Sigma‐Aldrich). After incubation for 12 hours, membranes were incubated with HRP‐conjugated secondary antibodies (1:5000, anti‐mouse GAM‐007; anti‐rabbit GAR‐007; MultiSciences, Hangzhou, China) at room temperature for 1 hour, and visualized by enhanced chemiluminescence kit (1520301; Biological Industries, Kibbutz Beit‐Haemek, Israel). The signal intensity of primary antibody binding was quantified and was normalized to a loading control ACTB (β‐actin).
2.10. Experimental animals
Male C57BL/6 TIGAR‐transgenic (tg‐TIGAR)15 and wild‐type (WT) mice, weighing 20‐23 g, were obtained from the Zhejiang Medical Animal Centre (Hangzhou, China) and housed under controlled atmospheric conditions with 12‐h light/dark cycles and standard diet and water. After 1 week of acclimation, the animals were used for the experiments. All experimental procedures and animal handling protocols were conducted according to the National Institutes of Health (NIH) guidelines for the care and use of laboratory animals. These procedures were approved by the Committee for Ethics of Animal Experiments at the Zhejiang University, China.
2.11. Mouse model of insulin‐induced hypoglycemia
Insulin‐induced hypoglycemia was achieved as described.34 Hypoglycemia was induced by 2 units/kg body weight insulin (Humulin 70/30, 0002‐8715‐01, ip; Eli Lilly, Indianapolis, IN, USA) at night in animals fasted for 48 hours. The control group was injected 0.9% saline. Mice with blood glucose levels higher than 2.0 mmol/L at 60 minutes after the initial insulin injection received an additional dose of insulin (0.5 units/kg). A blood glucose level below 2.0 mmol/L was achieved after 12 hours and until euthanasia without producing unconsciousness, seizures, or death. Following the blood glucose measurement at 12 hours after insulin postinjection, mice were injected Evans blue solution (2% in saline) for the neurovascular permeability analysis. The mice were separated into the following 4 groups: WT and tg‐TIGAR mice in normal and hypoglycemic stress conditions.
2.12. Confocal immunofluorescence staining and analysis
The confocal immunofluorescence staining and analysis were performed double‐blindly for the treatment status of the examined slides. To analyze the autophagy induction and detection in brain endothelial cells, the cells were planted on cover slips that had been retained in 24‐well plates for mRFP‐GFP‐LC3 transfection, followed by treatment with: chloroquine (BCBK7067V; Sigma‐Aldrich); 3‐PO (525330‐25MG; Calbiochem) and melatonin (M5250; Sigma‐Aldrich) under hypoglycemic stress for 24 hours or with SIN‐1(342‐06831; Wako, Osaka, Japan) in normal conditions. Cultured cells on the cover slips were washed in PBS and postfixed in 4% formaldehyde for immunostaining and confocal microscope with a Zeiss LSM image examiner. For each condition, at least 100 mRFP‐GFP‐LC3‐transfected cells were subjected to fluorescence analysis, and the percentage of transfected cells showing puncta mRFP‐GFP‐LC3 were used to indicate the accumulation of autophagosomes.
For immunofluorescence analysis of endothelial tight junctions, cells were transfected with GFP‐claudin‐5, TIGAR‐3*Flag, and TIGAR(Y92A)‐3*Flag plasmids followed by various treatments and fixed in 4% formaldehyde.22 Cells were labeled with TIGAR (1:250, ab37910; Abcam), Claudin‐5 (1:200, 35‐2500; Invitrogen) and Occludin (1:200, 71‐1500; Invitrogen), following immunofluorescence using the manufacturer's protocol (2013799; PerkinElmer Life Sciences, Boston, MA, USA). Nuclei were stained with 0.5 mg/mL DAPI (4,6‐diamidino‐2‐phenylindole) (D9564; Sigma‐Aldrich). Immunolocalization and changes in TIGAR and claudin‐5 in endothelial cell tight junctions were visualized by a Zeiss LSM 510 confocal microscope.
A fluorescent probe (NP3) was used to examine the ONOO− formation as previously described.35 Brain endothelial cells were cultured on glass‐bottom six‐well plates overnight, incubated with NP3 (5 μmol/L) at 37°C for 30 minutes, and nuclei were stained with PI (propidium iodide) (81845; Sigma‐Aldrich). Then, the dynamic changes of fluorescence in cultured endothelial cells with or without low‐glucose treatment (1 mmol/L) stimulation were captured by time‐lapse confocal microscopy for 100 minutes.
For immunohistochemistry, mice were anesthetized and transcardially perfused with 4% paraformaldehyde in PBS as previously described.17 The brains were removed and postfixed overnight at 4°C, cut into 40‐μm‐thick sections with vibratome, and incubated in PBS with 0.01% Triton X‐100 for 30 minutes at room temperature and in 3% BSA in PBS for 1 hour. For immunolabeling, the slices were incubated with antibodies for laminin (1:200, ab11575; Abcam), Claudin‐5 (1:200, 35‐2500; Invitrogen) overnight at 4°C. The sections were washed and then incubated with Alexa fluor 488‐conjugated anti‐rabbit IgG (1:400, A21206; Life Technologies) and Alexa fluor 594‐conjugated anti‐mouse IgG (1:400, A21203; Life Technologies) in TNB buffer (1:400). Immunofluorescence was visualized with a confocal microscope (Zeiss LSM 510).
2.13. Transmission electron microscopy
Transmission electron microscopy was performed according to the previous methodology to observe tight junction integrity in endothelial cells.36 The cells were subjected to hypoglycemic exposure followed by LV‐TIGAR transfection for 24 hours. Briefly, control cells under hypoglycemic stress for 24 hours and LV‐TIGAR treatment were collected and centrifuged at 1000‐1200 g for 5 minutes. The solid pellets were prefixed in 2.5% glutaraldehyde and postfixed in 1% osmium tetroxide, embedded in epoxy resins (Fluka, Buchs, Switzerland) and Ultrathin sections cut, processed with uranyl acetate and lead citrate. The ultrastructural examination was performed with a transmission electron microscope (Hitachi 7100; Nikon, Melville, NY, USA).
For animal hypoglycemic model, mice were anesthetized with choral hydrate and perfused with cold PBS (pH 7.4) following treatment with 0.25% glutaraldehyde and 4% paraformaldehyde in PBS solution. Brains were removed and placed overnight in 2% paraformaldehyde and 2.5% glutaraldehyde in 0.1 mol/L PBS. Target tissues were cut into 45‐μm sections using a vibratome (Leica VT100; Leica Microsystems, Buffalo Grove, IL, USA). Selected areas of parietal lobe cortex were postfixed in 1% osmium tetroxide for 1 hour, dehydrated in ethanol, and embedded in epoxy resin. After polymerization, blocks were excised with ultramicrotome into ultrathin sections, stained with uranyl acetate and lead citrate, and viewed under the electron microscope (Hitachi 7100, Nikon).
2.14. Analysis of BBB permeability
The loss of BBB integrity was assessed by examining the extent of Evans blue solution leakage from the microvessels in the brain 12 hours after hypoglycemia.37 Briefly, Evans blue solution (2% in saline) was intravenously administered via the tail vein at 12 hours after the onset of hypoglycemia. The animals were subjected to deep anesthesia and sacrificed 3 hours after Evans blue injection, following by intracardial perfusion with phosphate‐buffered saline (PBS) in both wild‐type and tg‐TIGAR mice.37 Brain cortex specimens were weighed, homogenized in PBS, and centrifuged at 15 000 g for 30 minutes. Then, 0.5 mL of the resultant supernatant was added to an equal volume of 50% trichloroacetic acid. After 1 hour incubation, the supernatant was taken for further examination. The absorbance of Evans blue (μg/g brain tissue) was measured at 620 nm using a spectrophotometer37.
2.15. Statistical analysis
The statistical significance for intergroup comparisons was determined using one‐way ANOVA (for 3 or more samples or conditions) followed by Tukey's multiple comparison tests. The data distribution was assumed to be normal. Equality of variances of all data was tested by the Brown‐Forsythe test before using one‐way ANOVA for further statistics. The results are shown as the mean ± SEM, and values of P < .05 were considered to be statistically significant.
3. RESULTS
3.1. TIGAR elicits neurovascular protection in vivo in mice during hypoglycemic insult
A tg‐TIGAR mouse was used to assess the protective role of TIGAR in vivo during insulin‐induced hypoglycemia, in which blood glucose levels were reduced to 2 mmol/L over 12 hours after injection. TIGAR can prevent brain microvessel hypoglycemic injury (Figure 1A‐C). Immunoreactivity for laminin and claudin‐5 was used to identify the tight junctions in the microvascular endothelium.38 After 12 hours of hypoglycemia in control C57Bl/6 mice, weak or scattered expression of claudin‐5 immunoreactivity was observed (Figure 1B). By contrast, a continuous interendothelial appearance of claudin‐5 was observed in brain microvessels of tg‐TIGAR‐mice (Figure 1C). We further examined whether TIGAR plays an important role in the regulation of neurovascular permeability following hypoglycemic insult. Our studies demonstrated that there was a large increase in BBB permeability in the hypoglycemia model in WT animals by 12 hours after insulin injection (1.43 ± 0.052 vs 0.36 ± 0.005, P < .01). This increased permeability was dramatically reduced in TIGAR‐transgenic mice (0.85 ± 0.002 vs hypoglycemia model in WT mice, P < .05), suggesting an association between TIGAR and BBB opening during hypoglycemic insult (Figure 1D).
Figure 1.
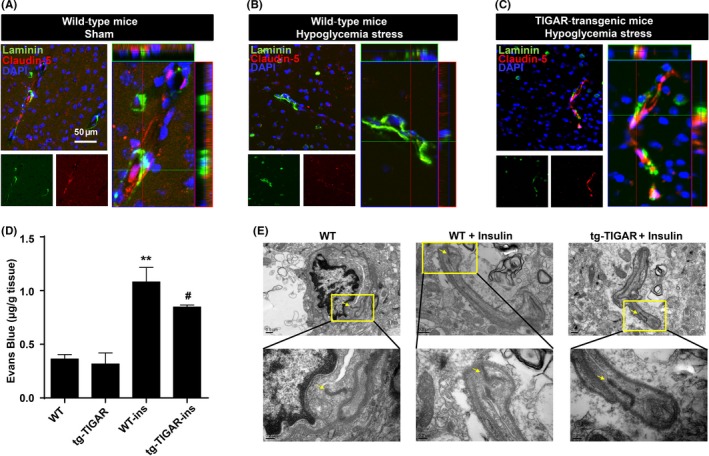
Vasoprotective role of TP53‐induced glycolysis and apoptosis regulator (TIGAR) during hypoglycemia stress in mice. (A‐C) Double immunohistochemical staining for laminin and claudin‐5 in the brain cortex after insulin‐induced hypoglycemia in wild‐type and tg‐TIGAR mice. Fluorescence staining for laminin (green) and claudin‐5 (red) was performed in the brain cortex 12 h after hypoglycemia‐induced brain injury in mice. Representative Z‐stack images were presented to confirm the co‐localization of laminin and claudin‐5 throughout the microvessels. Each image shown is representative of 5 independent mice. Scale bar: 50 μm. (D) Effect of TIGAR on BBB integrity upon hypoglycemic injury. Evans blue (μg/g brain tissue) levels in the brain cortex were examined by spectrophotometry in both WT and tg‐TIGAR mice 12 h after hypoglycemia‐induced brain injury. The data are expressed as the mean ± SEM.; n = 5 mice/group. **P < .01 vs wild‐type mice; # P < .05 vs wild‐type mice under hypoglycemic stress. (E) Ultrastructural changes in endothelial tight junctions in the brain cortex after hypoglycemic injury. Tight junction structures flanked by arrowheads in the images are shown at a larger magnification in lower panel. Hypoglycemia was induced by a single injection of insulin (2 units/kg body weight) in wild‐type and tg‐TIGAR mice. The mice were perfused with 4% paraformaldehyde and 0.25% glutaraldehyde and then processed for electron microscopic examination. The photomicrographs represent samples taken from 3 mice in each group
Transmission electron microscopy of microvessels in the brain cortexes of hypoglycemic C57BL/6 mice revealed ultrastructural abnormalities in microvessels and the endothelial basal lamina (Figure 1E, arrows), whereas hypoglycemia caused only mild microvascular damage in tg‐TIGAR mice (Figure 1E, arrows). Taken together, these findings suggest that the integrity of brain vessels during hypoglycemia depends on protection of the endothelial tight junction proteins by TIGAR to prevent vascular injury.
3.2. Localization of TIGAR in tight junction and response to low‐glucose stress
We further investigated the role of TIGAR in low‐glucose‐induced stress in human brain microvascular endothelial cells (HBMECs). Western blot studies demonstrated that elevation of TIGAR protein levels in endothelial cells was closely correlated with the glucose concentration (0~10 mmol/L) of the medium (Figure 2A,B). Representative blots presented in Fig. S1A show that TIGAR protein levels were elevated following low‐glucose (1 mmol/L) exposure over 1 to 12 hours, followed by a significant decline at 24 hours (Fig. S1A,B), indicating TIGAR was a sensitive monitor for low‐glucose stress conditions in HBMECs. As this work focuses on a protective role for TIGAR, our studies were performed after 24 hours of low‐glucose culture when cells were severely stressed and TIGAR expression was greatly reduced.
Figure 2.
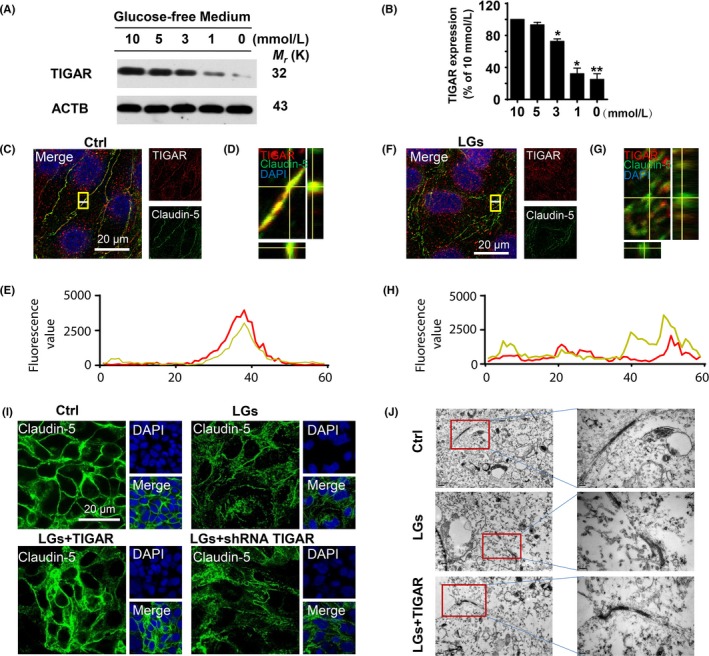
TP53‐induced glycolysis and apoptosis regulator (TIGAR) is dysregulated during low‐glucose stimulation. (A) Changes in TIGAR protein levels in cell lysates of human brain microvascular endothelial cells in glucose‐free medium conditions. (B) Quantitative analysis of TIGAR protein levels in (A). Data are expressed as the mean ± SEM from 3 independent experiments. *P < .05 and **P < .01 vs percentage of 10 mmol/L glucose cultured group. (C‐E) Subcellular localization of TIGAR and claudin‐5 was determined by laser confocal microscopy. Immunostaining of endothelial TIGAR (red) and claudin‐5 (green) in control conditions. (D) Representative Z‐stack images shown in (C). (E) Florescence value of the white line in (C). (F‐H) Immunostaining of TIGAR (red) and claudin‐5 (green) after 24 h in the low‐glucose‐stressed conditions. (G) Representative Z‐stack images shown in (F). (H) Florescence value of the white line in (F). Scale bar, 20 μm. (I) Effect of TIGAR transfection on expression of claudin‐5 following low‐glucose stimulation. Inhibition of TIGAR by shRNA resulted in the disturbance of claudin‐5 expression (green), whereas overexpression of TIGAR preserved the tight junction proteins in HBMECs following 24‐h low‐glucose stimulation. (J) Representative electron micrograph images shows damage to tight junctions after 24‐h low‐glucose stress, whereas lentivirus‐TIGAR transfection preserved their integrity
Immunocytochemical experiments with an anti‐TIGAR antibody (red fluorescence) were used to study the subcellular localization of TIGAR (Figure 2C,D). The immunocytochemical and Z‐stack image analyses showed co‐localization of TIGAR and claudin‐5 in the brain endothelial cell tight junctions (Figure 2C‐E). The data were confirmed by co‐localization of a GFP vector encoding claudin‐5 (GFP‐Claudin‐5) and TIGAR in HBMECs (Fig. S2). Moreover, an immunocytochemical assay demonstrated the breakdown of the tight junction protein claudin‐5 along with reduced TIGAR expression in low‐glucose‐stressed HBMECs (Figure 2F‐H). We next investigated the role of TIGAR on low‐glucose stress‐induced tight junction injury. In contrast to the TIGAR overexpression (93.90 ± 1.21%) that protected the endothelial tight junctions upon low‐glucose insult (57.28 ± 0.40%) for 24 hours, shRNA‐mediated TIGAR inhibition exaggerated the claudin‐5 damage (38.20 ± 0.24%) (Figure 2I, Fig. S3A). Consistently, similar results observed in occludin expression in same context (Fig. S3B). Electron microscopy revealed that endothelial junctions appeared at the cell–cell contact regions in control cells as contact points for the tight junctions, whereas their architecture was disturbed following low‐glucose stress.39 As shown in Figure 2J, lentiviral‐TIGAR transfection prevented the architectural abnormalities in cell tight junctions.
3.3. Protective effect of melatonin on low‐glucose stress‐induced tight junction injury
The expression of tight junction proteins in endothelial cells is crucial for preserving their barrier function.40, 41, 42 The accumulating evidence suggest vasoprotective role of melatonin during brain injury.17, 43 The immunocytochemical analysis demonstrated a prominent decrease in claudin‐5 fluorescence values in the brain endothelial cells in low‐glucose condition (47.65 ± 1.03% vs control) (Figure 3A). By contrast, treatment of the endothelial cell culture with melatonin inhibited the breakdown of claudin‐5 during low‐glucose stress (91.07 ± 1.69%) (Figure 3A,B and Fig. S4). Consistently, similar down‐regulation of another tight junction protein occludin was observed following low‐glucose exposure but significantly restored in the presence of melatonin (400 nmol/L) (31.33 ± 0.73% in low‐glucose group; 83.88 ± 0.58% in melatonin group) (Figure 3C,D). These findings merit further investigations on the possible mechanisms of beneficial effect of melatonin on tight junction injury during hypoglycemic stress.
Figure 3.
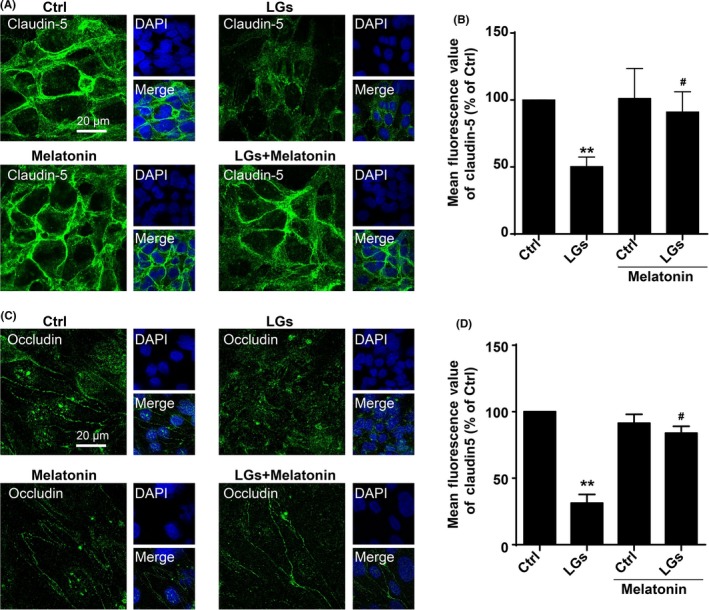
Protective effect of melatonin on low‐glucose stress‐induced tight junction injury. (A) Representative images of claudin‐5 staining of brain endothelial cells in low‐glucose conditions with or without melatonin treatment. The cells were seeded on glass‐bottom 24‐well plates overnight and then followed by treatment with or without melatonin (400 nmol/L) in low‐glucose cultures for 24 hours. The nuclei were stained with DAPI (blue). Scale bar, 20 μm. (B) Melatonin treatment rescued tight junction injury in HBMECs, as assessed using the fluorescence intensity of tight junction marker claudin‐5. Florescence value is representative of 3 independent experiments expressed as mean ± SEM. **P < .01 vs percentage of control; # P < .05 vs percentage of low‐glucose‐treated group. (C) Confocal images stained for occludin in brain endothelial cells upon low‐glucose conditions. The cells were seeded on glass‐bottom 24‐well plates overnight and then followed by treatment with or without melatonin (400 nmol/L) in low‐glucose cultures for 24 h. The nuclei were stained with DAPI (blue). Scale bar, 20 μm. Quantification of the fluorescence intensity of occludin is presented on (D). Florescence value is representative of 3 independent experiments expressed as mean ± SEM. **P < .01 vs percentage of control; # P < .05 vs percentage of low‐glucose‐treated group
3.4. Melatonin reduced hypoglycemic stress‐induced nitrosative stress
Peroxynitrite (ONOO−) is generated by the reaction of nitric oxide (·NO) with superoxide (O2 ·−) radicals24 and is a reactive nitrogen species that can induce cellular stress and inflammation. Thus, we next investigated whether nitrosative stress was implicated by TIGAR dysfunction in brain endothelial cells during hypoglycemia. Increases in nitrotyrosine levels induced by low‐glucose conditions were confirmed by Western blots (Figure 4A,B). To elaborate our finding, the melatonin was used to further clarify the role of nitrosative stress during endothelial injury. Low‐glucose stress induced a pronounced increase in formation of ONOO− as reflected by a sensitive NP3 probe for detecting nitrosative stress (Figure 4C; Fig. S5). While a pronounced decrease in NP3 probe, fluorescence was detected in low‐glucose‐exposed cells treated with melatonin (Figure 4C). Therefore, we postulated that there is a requirement for nitrosative stress signaling in engagement of the TIGAR dysfunction and tight junction injury during low‐glucose injury.
Figure 4.
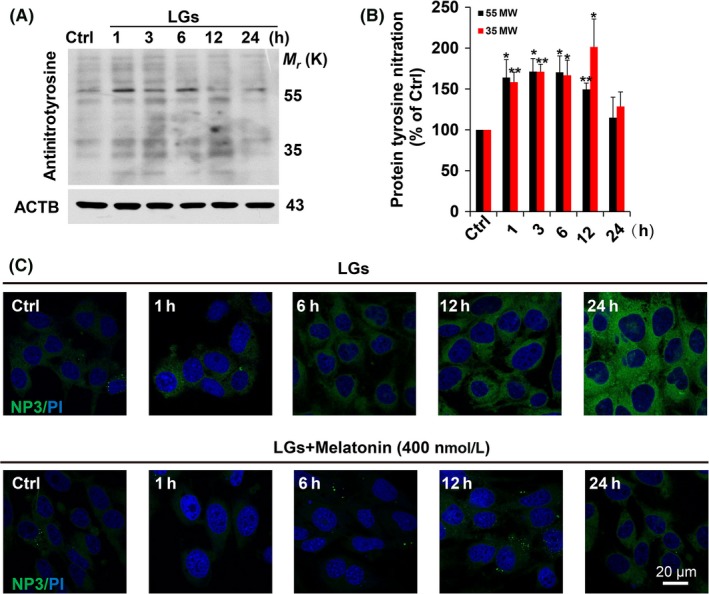
Melatonin treatment inhibits low‐glucose‐induced protein tyrosine nitration. (A) Intracellular 3‐nitrotyrosine (NT) was measured by Western blot analysis. The cultured HBMECs were subjected to low‐glucose stress (1 mmol/L) at the indicated times. Immunodetection of ACTB was used as a loading control. (B) Quantitative analysis of protein levels for (A) was performed by densitometry. The immunoblots are representative of 3 independent experiments and expressed as percentage of values of the control (mean ± SEM). *P < .05; **P < .01 vs percentage of control. (C) Melatonin treatment reduced the formation of ONOO− during low‐glucose stimulation. Characterization of ONOO− formation by NP3 fluorescence probe in cultured HBMECs upon low‐glucose stimulation. The cells were seeded on glass‐bottom 24‐well plates overnight and then followed by treatment with or without melatonin (400 nmol/L) in low‐glucose cultures from 1 to 24 hours, then incubated with NP3 (5.0 μmol/L) for 15 min
3.5. Calmodulin‐dependent TIGAR nitration and tight junction injury
Coupling of mass spectrometry with co‐immunoprecipitation allows for the identification of discrete proteins.44 Following immunoprecipitation of TIGAR, the candidate binding proteins were identified by MALDI/TOF mass spectrometry. Twenty‐nine different proteins were identified with high confidence (CI % ranging from 97.5% to 100%) and classified into functional groups (Figure 5). As calmodulin participates in regulating of the nitroso‐redox balance,45, 46 it was studied as a potential inhibitor of TIGAR‐induced autophagy. To monitor the kinetics of calmodulin binding to TIGAR in real‐time, we developed a FRET‐based assay using CFP‐labeled calmodulin (CaM‐pECFPC1) and YFP‐labeled TIGAR (TIGAR‐pEYFPC1) (Figure 5A). CFP images taken before and after YFP photobleaching26 demonstrated that the groups were similar with regard to the fluorescence of the acceptor (Figure 5B) Images in HEK‐293 cells co‐expressing CaM‐pECFPC1 with TIGAR‐pEYFPC1 for 48 hours demonstrated an 18% increase in fluorescence caused by bleaching of YFP (acceptor) (Figure 5C). Here, TIGAR has no binding association with HKII in the present context (Fig. S6).
Figure 5.
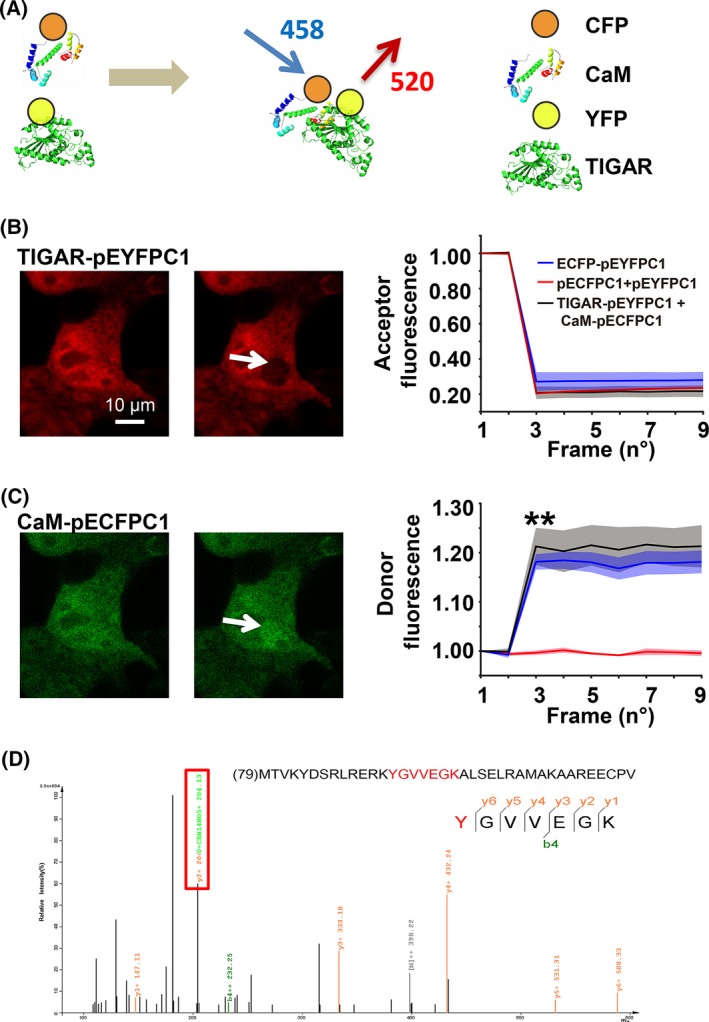
Identification of a binding partner for TP53‐induced glycolysis and apoptosis regulator (TIGAR) during low‐glucose stress. (A) CFP‐labeled calmodulin (CaM‐pECFPC1) and YFP‐tagged TIGAR (TIGAR‐pEYFPC1) constructs were used for FRET analysis. (B) Acceptor fluorescence was recorded before and after photobleaching of the cell. There were no significant differences among the groups with respect to the acceptor fluorescence. (C) The percentage of donor fluorescence was recorded frame by frame before and after laser‐induced acceptor photobleaching. HEK293 cells were transfected with CaM‐pECFPC1/TIGAR‐pEYFPC1, and the emission signals of excited calmodulin‐pECFPC1 (FRET donor) were recorded. Data are expressed as the mean ± SEM values from 3 independent experiments. **P < .01 vs control. (D) Identification of tyrosine 92 as TIGAR nitrated site. Tandem mass spectra of the nitrated peptide 92YGVVEGK98 from the TIGAR protein. The protein was digested with 20 ng/μL trypsin and then subjected to nano‐LC/MS/MS analysis. The modified peptide was manually verified. The sequence‐specific ions are labeled as y and b ions on the spectra. The peptide contained 3‐nitrotyrosine at the residue of Y92. Fragmentation of ions showed the diagnostic mass shift
The active site of TIGAR contains 3 amino acids (2 histidines and 1 glutamic acid) referred to as the “catalytic triad,” which is implicated in its phosphatase reaction.9, 10 To investigate whether nitrosative stress caused the TIGAR dysfunction during low‐glucose conditions, recombinant TIGAR protein was treated with ONOO−,27 and SDS/PAGE gel spots after silver staining were excised, processed by in‐gel digestion with trypsin and chymotrypsin, and analyzed by nano‐LC/MS/MS assay. Nitration caused a mass shift on 3‐nitrotyrosine‐bearing peptides. Thus, the TIGAR protein can be nitrated at tyrosine residue at Y92 (92YGVVEGK98) (Figure 5D). Consistently, low‐glucose stress‐induced tyrosine nitration of TIGAR was further confirmed by the immunoprecipitation of nitrotyrosine followed by immunoblotting with an anti‐TIGAR antibody (Fig. S7).
3.6. Tyrosine 92 in TIGAR is critical for its protective function of tight junctions
The active site of TIGAR is open and positively charged, with a bifunctional activity for 6‐phosphofructo‐2‐kinase/fructose‐2,6‐bisphosphatase.9, 10 To assess whether the 3 amino acids in TIGAR that form the catalytic triad compromise TIGAR activity, a mutant TIGAR was constructed by a point mutation in the nitrated site of tyrosine 92 (Y92A). The ribbon diagrams showed the substrate binding site (PDB entry: 3DCY) of TIGAR‐wild type and its mutant Y92A (Figure 6A and Fig. S8). The mutation in the TIGAR nitrated site abolished the protection of occludin breakdown after exposure of HBMECs to low‐glucose conditions (Figure 6B). Furthermore, the tight junction breakdown and preservation were confirmed by immunocytochemistry (Figure 6C). The plasmid encoding TIGAR preserved claudin‐5 protein expression (green florescence) in hypoglycemic endothelial cells (41.00 ± 0.45% in low‐glucose group; 91.15 ± 1.52% in TIGAR overexpression group). Interestingly, transfection of cultured HBMECs with the inactive TIGAR‐mutant exaggerated the degradation of claudin‐5 (39.99 ± 0.61%, Figure 6C). As shown in Fig. S9, similar results were observed in occludin expression during low‐glucose insult.
Figure 6.
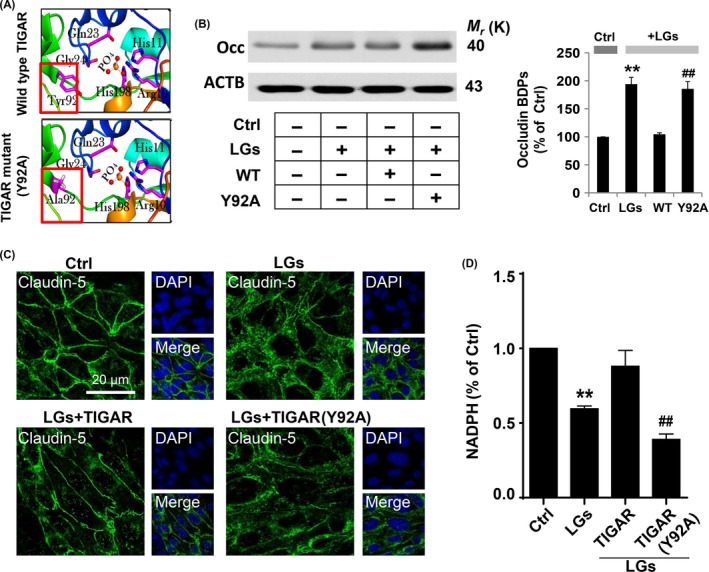
Mutation of tyrosine 92 abolished the protective effect of TIGAR. (A) Ribbon diagrams for the active site in crystal structure (PDB entry: 3DCY) of TIGAR‐wild type and residues engaged in hydrogen bonds with the phosphate molecule in the Y92A mutant. (B) Mutation of tyrosine 92 abolished the protective effect of TIGAR on tight junctions. The brain endothelial cells were transfected with wild‐type TIGAR and mutant TIGAR (Y92A) following low‐glucose stress for 24 h. The protein lysates from brain endothelial cells were processed for Western blotting to detect occludin breakdown products (BDPs). Immunoblotting with ACTB antibody demonstrated equal protein loading in each lane. The histograms represent summaries of the mean currents after TIGAR (Y92A) transfection. The data are expressed as the densitometry ratio of the control (mean ± SEM) from 3 independent experiments. **P < .01 vs control; ## P < .01 vs WT transfection group. (C) Fluorescence immunocytochemical staining of claudin‐5 (green) showed hypoglycemia‐induced brain endothelial tight junction protein degradation. Mutation in the tyrosine 92 site in TIGAR protein abrogated its protective role compared to that of wild‐type TIGAR. DAPI counterstaining indicated nuclear localization (blue). Scale bar, 20 μm. (D) Plasmid‐mediated TIGAR overexpression increased NADPH levels in endothelial cells 24 h after low‐glucose stimulation, whereas mutant TIGAR (Y92A) have little effect. Data are expressed as the mean ± SEM values from 3 independent experiments. **P < .01 vs control; ## P < .01 vs WT transfection group
If the excessive autophagy in endothelial cells during hypoglycemia was caused by decreased TIGAR function, it should be prevented by maintaining PPP flux and enhancing TIGAR expression. Overexpression of TIGAR further enhanced NADPH levels (59.55 ± 0.35% in low‐glucose group; 88.07 ± 2.03% in TIGAR transfection group), which implied an increased PPP flux, whereas this was reversed by mutant TIGAR (Y92A) (39.08 ± 0.68%, Figure 6D). Thus, TIGAR tyrosine 92 is critical for its normal function, and a mutation in the TIGAR nitrated site is sufficient to block increased PPP flux and abolish the protection of tight junction integrity by TIGAR.
3.7. Inhibitory effect of TIGAR on autophagy during low‐glucose stress
We next probed the relationship between TIGAR and excessive autophagy during the disruption of endothelial tight junction proteins in endothelial cells. Increasing TIGAR activity by transfecting endothelial cells with a plasmid for TIGAR (Figure 7A) or recombinant human TAT‐TIGAR protein (trans‐activator of transcription‐TIGAR protein) (Figure 7B) reduced LC3‐II accumulation during low‐glucose exposure. The 3PO (3‐(3‐Pyridinyl)‐1‐(4‐pyridinyl)‐2‐propene‐1‐one) is a PFKFB3 (6‐phosphofructo‐2‐kinase/fructose‐2,6‐bisphosphatase‐3) inhibitor that also inhibits TIGAR activity.47 As shown in Figure 7C, further increases in LC3‐II were observed in 3PO‐treated HBMECs. Moreover, immunoblot data revealed that LC3‐II accumulation was further increased in the presence of bafilomycin A1 in low‐glucose medium (Figure 7D), confirming that TIGAR inhibition elicited an inhibitory effect on low‐glucose‐induced disturbance of autophagy flux. Consistently, immunofluorescence data also showed that the inhibition of PPP flux by 3PO resulted in enhanced accumulation of mRFP‐GFP‐LC3 puncta in HBMECs (Figure 7E,F).
Figure 7.
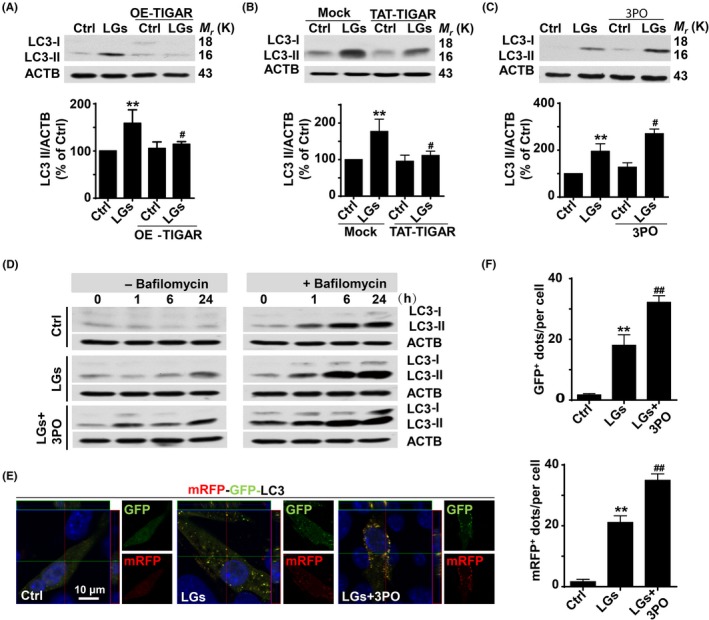
Inhibitory effect of TP53‐induced glycolysis and apoptosis regulator (TIGAR) on autophagy during low‐glucose stress. (A) TIGAR overexpression inhibited the autophagy activation in cells following low‐glucose stress. LC3‐II levels were markedly reduced, whereas immunoblotting with ACTB showed equal amounts of loaded protein. Data are expressed as the mean ± SEM from 3 independent experiments. **P < .01 vs percentage of control; # P < .05 vs percentage of low‐glucose‐treated group. (B) TAT‐TIGAR transfection against low‐glucose‐induced tight junction injury. Brain endothelial cells were transfected with recombinant human TAT‐TIGAR protein 24 h before low‐glucose mediated stress. ACTB served as a loading control. Data are expressed as the mean ± SEM from 3 independent experiments. **P < .01 vs percentage of control; # P < .05 vs percentage of low‐glucose‐treated group. (C) TIGAR inhibition amplifies the LC3‐II formation. Brain endothelial cells were subjected to low‐glucose stress for 24 h, and 3PO was added to the cell cultures. Representative Western blots showed that 3PO enhanced the LC3‐II accumulation. ACTB was used as the loading control. Data are expressed as the mean ± SEM from 3 independent experiments. **P < .01 vs percentage of control; # P < .05 vs percentage of low‐glucose‐treated group. (D) TIGAR inhibition exaggerates the LC3‐II accumulation. Brain endothelial cells were cultured for different time periods in low‐glucose conditions in the absence or presence of bafilomycin A1. Bafilomycin A1 treatment induced LC3‐II accumulation at 6 or 24 h following low‐glucose insult, which was further increased after 3PO treatment. (E) 3PO treatment exaggerated the formation of autophagosome and autolysosome in tandem fluorescent mRFP‐GFP‐LC3‐transfected HBMECs following 24‐h low‐glucose insult. The mRFP‐GFP‐LC3 puncta was amplified in endothelial cells incubated with 3PO vs punctate formation in cells under low‐glucose treatment alone. (F) Quantification of data from (E) was analyzed from the mean RFP‐LC3 and GFP‐LC3 dots per cell of 3 independent experiments. Data are expressed as mean ± SEM from 3 independent experiments in which at least 120 cells were analyzed. **P < .01 vs control group; ## P < .01 vs low‐glucose‐treated cells
3.8. Disturbance of autophagy induces tight junction injury during low‐glucose stress
Autophagy is a distinguishing feature of metabolic adaptation during stress.19, 20 Thus, we next assessed whether activation of autophagy by low‐glucose conditions promotes endothelial injury or survival. The lipidation of cytoplasmic LC3‐I to LC3‐II provides an index of autophagy.48, 49 LC3‐II protein levels in HBMECs increased, in a near proportion to the decrease in glucose levels (0~10 mmol/L) (Fig. S10A) or by increasing the exposure time to low glucose (Fig. S10B). These findings indicate that low‐glucose conditions induce autophagy in brain endothelial cells.
Endothelial cells were transfected with an adenoviral vector expressing mRFP‐GFP‐LC3 (Hanbio Biotechnology) to study autophagosome formation. Low‐glucose stress increased both green and red puncta (Fig. S11), suggesting that there was an increase in either autolysosomes or autophagosomes, which enhanced autophagic flux. Moreover, the involvement of lysosomes was apparent from the effects of a lysosomal protease inhibitor that increased LC3 fluorescent puncta (Fig. S11), which suggested that either autophagy induction or autophagic flux is increased in response to low‐glucose treatment.
We investigated whether autophagy in prolonged low‐glucose medium promotes cell survival or cell death. As shown in Figure 8A, Atg5 (autophagy‐related 5) silencing significantly reduced LC3‐II accumulation in HBMECs in low‐glucose medium. Moreover, the immunocytochemical assay showed that Atg5 silencing effectively reduced the low‐glucose‐induced degradation of claudin‐5 (54.41 ± 1.74% in low‐glucose group; 88.60 ± 0.09% in siAtg5 transfection group, Figure 8A,B). Similar results were observed in expression of occludin in same context (Figs S12 and S13). Consistently, wortmannin (100 nmol/L) treatment alone or co‐treatment with melatonin (400 nmol/L) markedly reduced occludin degradation following low‐glucose exposure (Figure 8C,D). Thus, the prolonged, low‐glucose‐induced disturbance of autophagy flux can lead to disruption of tight junctions.
Figure 8.
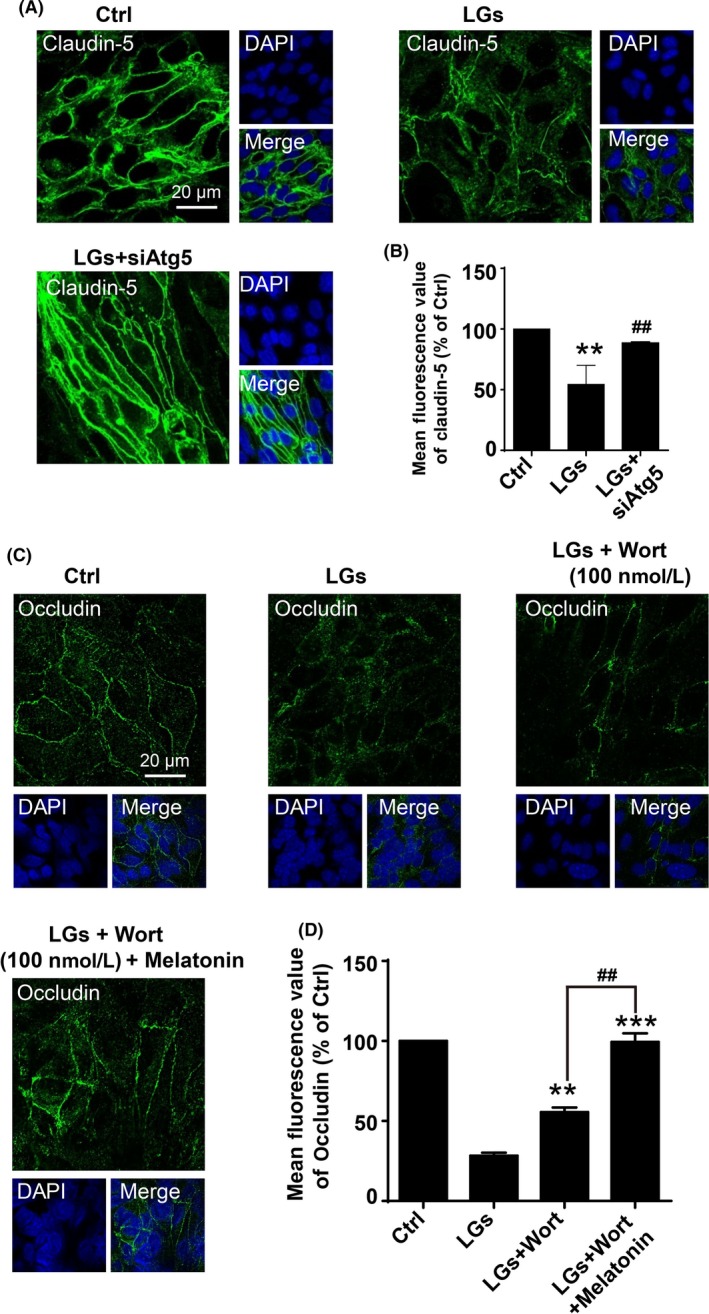
Inhibition of autophagy reduces tight junction injury during low‐glucose stress. (A) Representative immunofluorescence images of claudin‐5 staining of brain endothelial cells in the control and low‐glucose conditions. Cell cultures were transfected with siRNA‐Atg5, and Nuclei were stained with DAPI (blue). Scale bar, 20 μm. (B) Quantification of claudin‐5 expressions in (A). Data are expressed as the mean fluorescence intensity percentage ± SEM from 3 independent experiments. **P < .01 vs control; ## P < .01 vs low‐glucose‐treated cells. (C) Synergistically inhibitory effect of wortmannin and melatonin on degradation of occludin in brain endothelial cells upon low‐glucose insult. The cells were treatment with wortmannin (100 nmol/L) alone or co‐incubation with wortmannin (100 nmol/L) and melatonin (400 nmol/L) in low‐glucose cultures for 24 h. The nuclei were stained with DAPI (blue). Scale bar, 20 μm. Quantification of the fluorescence intensity of occludin is presented on (D). Florescence value is representative of 3 independent experiments expressed as mean ± SEM. **P < .01; ***P < .001 vs percentage of low‐glucose‐treated cells; ## P < .01 vs percentage of low‐glucose‐treated group with wortmannin alone
3.9. Inhibitory effect of melatonin on autophagy during low‐glucose stress
Low‐glucose exposure stimulated mRFP‐GFP‐LC3 fluorescent puncta formation in HBMECs, resulting in autophagosome formation that was blunted by TIGAR overexpression (Figure 9A,B). In contrast, transfection of endothelial cells with a plasmid encoding the inactive mutant TIGAR (Y92A) significantly increased mRFP‐GFP‐LC3 puncta (Figure 9A,B).
Figure 9.
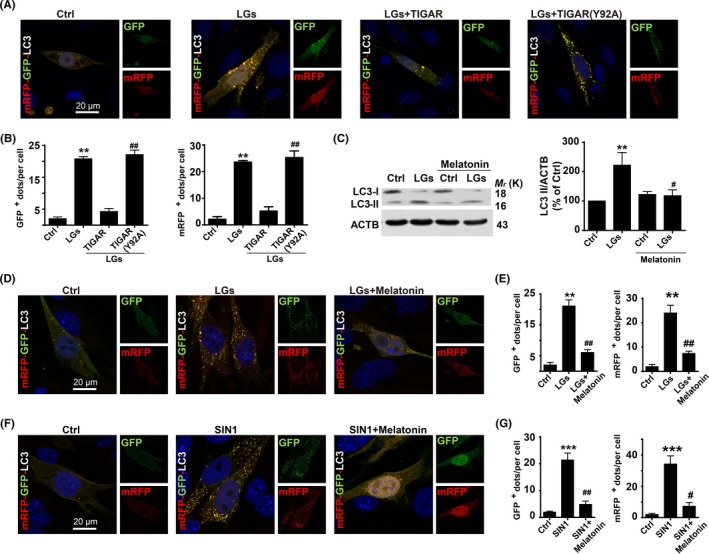
Inhibitory effect of melatonin on autophagy during low‐glucose stress. (A) TP53‐induced glycolysis and apoptosis regulator (TIGAR) mutation abolishes its inhibitory effect on low‐glucose stress‐induced autophagy. Endothelial cells transfected with mRFP‐GFP‐LC3 were subjected to low glucose for 24 h, and nuclei were stained with DAPI. (B) Quantification of data from (A) was analyzed by mean GFP‐LC3 and mRFP‐LC3 dots per cell from 3 independent experiments in which at least 120 cells were analyzed. The data are expressed as the mean ± SEM. **P < .01 vs control; ## P < .01 vs WT transfection group. (C) Western blot analysis showing the effects of melatonin treatment on LC3‐II formation. Human brain endothelial cells were treated with melatonin (400 nmol/L) for 24 h following low‐glucose stimulation. The data are expressed as the mean ± SEM from 3 independent experiments. **P < .01; vs control; # P < .05 vs low‐glucose group. Scale bar, 20 μm. (D) Melatonin treatment reduced the low‐glucose‐induced mRFP‐GFP‐LC3 puncta formation. Immunocytochemical analysis of mRFP‐GFP fluorescent puncta in brain endothelial cells after low‐glucose stimulation for 24 h. (E) Quantification of data from (D) was analyzed from the mean mRFP‐LC3 and GFP‐LC3 puncta per cell of 3 independent experiments in which at least 110 cells were analyzed. The data are expressed as the mean ± SEM. **P < .01; vs control; ## P < .01 vs low‐glucose group. (F) Melatonin treatment reduced the nitrosative stress‐induced mRFP‐GFP‐LC3 puncta formation. Melatonin (400 nmol/L) treatment reduced the formation of autophagosome and autolysosome in tandem fluorescent mRFP‐GFP‐LC3‐transfected HBMECs. Immunocytochemical analysis of the formation of autophagosome and autolysosome in tandem fluorescent mRFP‐GFP‐LC3‐transfected HBMECs in the presence of SIN1. DAPI counterstaining indicates nuclear localization (blue). Scale bar, 10 μm. (G) Quantification of data from (F) was analyzed by mean GFP‐LC3 and RFP‐LC3 dots per cell from 3 independent experiments in which at least 110 cells were analyzed. The data are expressed as mean ± SEM. ***P < .001 and ## P < .01 vs control group
Moreover, the HBMECs incubated with the melatonin (400 nmol/L) for 24 hours following low‐glucose exposure had a reduced accumulation of LC3‐II (Figure 9C) and punctate formation (Figure 9D,E). Paralleled with decreased ONOO− levels in the presence of melatonin in same context. As shown in Figure 9F, the ONOO− donor 3‐morpholinosydnonimine (SIN‐1)‐induced autophagosome formation was reduced by inhibition of ONOO− with melatonin (Figure 9F,G). These data implicate critical role of nitrosative stress in regulating the cross talk between autophagy and TIGAR during disturbance of tight junction integrity.
4. DISCUSSION
Metabolic processes within the brain microvascular endothelial cells are important regulators of BBB function.50, 51 Herein, we identified a previously unrecognized role for melatonin to protect the cerebral endothelial cell tight junction integrity during hypoglycemia by inhibiting excessive autophagy. This was attributed to a novel mechanism that disturbs autophagy by calmodulin‐dependent nitration of TIGAR protein during hypoglycemic endothelial injury.
Tight junctions associated with BBB cells are organized by a complex combination of transmembrane and cytoplasmic proteins.40, 42 The current results demonstrate a unique role for tight junction localization of TIGAR to the brain endothelial cells, where its expression was disturbed following prolonged low‐glucose stress. In line with our data, TIGAR can limit cellular metabolic stress during starvation and can modulate the energy balance of cardiac myocytes during hypoxia.52, 53 The present study extends our previous findings that TIGAR protects ischemic brain from injury by enhancing PPP flux.15 We have reported that a lentiviral vector encoding TIGAR reduced ischemic neuronal injury in mice, whereas TIGAR knockdown exaggerated this damage.15 TIGAR has phosphofructo‐2‐kinase activity to inhibit glycolysis and promote flux through the PPP pathway.9, 10 TIGAR limited metabolic stress and the breakdown of the tight junction proteins occludin and claudin‐5 during low‐glucose conditions. The dramatically improved microvessel integrity in hypoglycemic tg‐TIGAR mice provided in vivo confirmation of the involvement of TIGAR in tight junction preservation.
Brain microvessels can be primary targets for nitrosative stress in stroke and neurodegenerative disorders.54, 55 Sustained metabolic stimulation could initiate nitrosative stress via increased production of NO and/or O2 −. Thus, increased intracellular Ca2+ could induce calmodulin to trigger the activation of nitric oxide synthases,56, 57 or ONOO− could be derived from O2 − generated by an uncoupled nitric oxide synthase.23 Importantly, pharmacological inhibition of nitrosative stress by melatonin partially accounts for its ability to limit neurodegenerative disorders and hypoxic‐ischemic brain damage.24, 58, 59 Therefore, we hypothesize that melatonin may play a general yet critical role in maintaining tight junction integrity during hypoglycemic challenges that stress the brain. The functional importance of nitrosative stress signaling was shown by the inhibitory effect of melatonin, which reduced LC3‐II accumulation and tight junction injury during low‐glucose stimulation. Our findings reveal how hypoglycemic stress induces nitrosative inactivation of TIGAR to promote endothelial tight junction injury, whereas melatonin protects tight junction integrity by limiting excessive autophagy through its inhibitory effect on nitrosative stress.
In the present study, calmodulin was identified as a candidate bonding protein for TIGAR by immunoprecipitation and subsequent MALDI/TOF mass spectrometric analysis or using a FRET‐based assay. TIGAR has 3 amino acids within the region corresponding to the catalytic bisphosphatase domain of Fru‐2,6‐BPase.9, 10 Indeed, calmodulin signaling contributes to the ischemia‐induced degradation of tight junction proteins in endothelial cells.17, 24 The crystal structure of TIGAR protein revealed that the phosphate‐binding pocket is surrounded predominantly by residues Arg10, His11, Gln23, Gly24, Tyr92, and His198.9, 10 Nitrosative stress can nitrate tyrosine residues in target proteins.60 The interaction between TIGAR and calmodulin is interesting because calmodulin has the potential to regulate nitration of TIGAR, and ONOO− generated from a point source can nitrate surrounding target cells within a field of 20~50 μm.61 Mutation of Y92 (92YGVVEGK98) site implicated tyrosine 92 as critical for TIGAR function in protecting tight junctions from damage. We speculate that TIGAR inactivation by tyrosine 92 nitration represents a novel mechanism of TIGAR regulation that culminates in endothelial tight junction damage. Together, our results underline a unique role for TIGAR and its regulation by Ca2+/calmodulin as sensor of glucose deficits, to modulate autophagy and endothelial tight junction integrity.
Our study also demonstrates that autophagy is a critical link between TIGAR dysregulation and tight junction injury. In fact, the outcome of autophagy is highly dependent on the strength and duration of stress‐inducing signals.48, 62, 63 The present data show that prolonged low‐glucose induces autophagy that is detrimental to the integrity of tight junctions. Excessive activation of autophagy is a pathophysiological cellular mechanism that amplifies ischemic injury.17, 20, 22 Atg5 silencing significantly reduced autophagy in HBMECs during low‐glucose conditions, in parallel with a profound decrease in claudin‐5 expression. Hoshino et al14 reported that activation of the p53‐TIGAR axis during ischemia attenuates autophagy but exacerbates cardiac damage. This apparent dual action of TIGAR has been studied in cancer cell survival and is related to its ability to inhibit both apoptosis and autophagy.20, 64 Here, the manipulation of TIGAR by overexpression or loss‐of‐function demonstrated that TIGAR inhibits low‐glucose‐induced excessive autophagy in brain endothelial cells. In the current study, we extended this result and demonstrated that TIGAR regulates autophagy to protect endothelial tight junctions during hypoglycemic stress by increasing the NADPH yield. Hence, these findings provide mechanistic insight of how melatonin functions in the preservation of tight junctions by reducing protein nitration of TIGAR.
In summary, our data illustrate a novel pathway leading to autophagy regulation by TIGAR that provides neurovascular protection against nitrosative stress. We provide detailed molecular mechanisms for the protective effect of melatonin on brain endothelial tight junction and suggest this indole has translational potential for severe hypoglycemia‐induced neurovascular damage (Figure 10).
Figure 10.
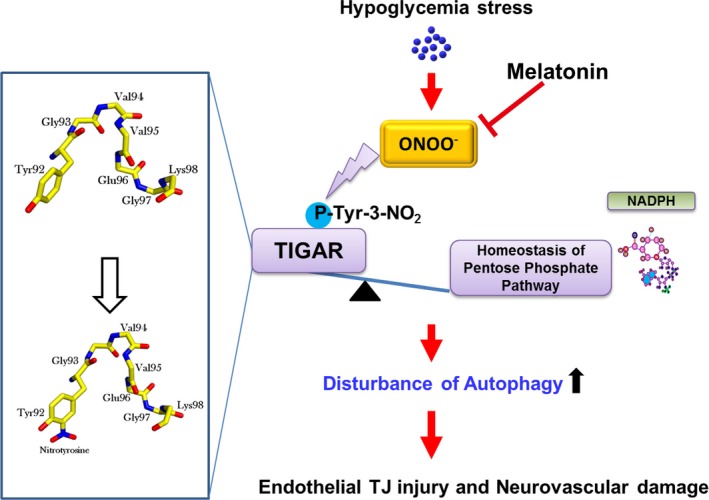
Melatonin ameliorates hypoglycemic stress‐induced brain endothelial tight junction injury by inhibiting protein nitration of TP53‐induced glycolysis and apoptosis regulator (TIGAR). TJ = tight junction; ONOO− = peroxynitrite anion
COMPETING INTERESTS
The authors have declared that no competing interests exist.
Supporting information
ACKNOWLEDGEMENTS
This work was supported by The National Key Research and Development Program of China (2016YFE0125400); National Natural Science Foundations of China (81673415, 81573411), the Zhejiang Province Program for Cultivation of High‐level Health Talents and New Century 151 Talent Project of Zhejiang Province, and Zhejiang Provincial Natural Science Foundation of China (Z16H310003).
Wang C‐K, Ahmed MM, Jiang Q, et al. Melatonin ameliorates hypoglycemic stress‐induced brain endothelial tight junction injury by inhibiting protein nitration of TP53‐induced glycolysis and apoptosis regulator. J Pineal Res. 2017;63:e12440 https://doi.org/10.1111/jpi.12440
Cheng‐kun Wang and Muhammad Masood Ahmed are contributed equally to this work.
Contributor Information
Ying‐mei Lu, Email: lufx@zju.edu.cn.
Zheng‐hong Qin, Email: qinzhenhong@suda.edu.cn.
Feng Han, Email: changhuahan@zju.edu.cn.
REFERENCES
- 1. Gu YH, Kanazawa M, Hung SY, et al. Cathepsin L acutely alters microvessel integrity within the neurovascular unit during focal cerebral ischemia. J Cereb Blood Flow Metab. 2015;35:1888‐1900. [DOI] [PMC free article] [PubMed] [Google Scholar]
- 2. Quaegebeur A, Lange C, Carmeliet P. The neurovascular link in health and disease: molecular mechanisms and therapeutic implications. Neuron. 2011;71:406‐424. [DOI] [PubMed] [Google Scholar]
- 3. Abbott NJ, Patabendige AA, Dolman DE, et al. Structure and function of the blood‐brain barrier. Neurobiol Dis. 2010;37:13‐25. [DOI] [PubMed] [Google Scholar]
- 4. Cardoso FL, Brites D, Brito MA. Looking at the blood‐brain barrier: molecular anatomy and possible investigation approaches. Brain Res Rev. 2010;64:328‐363. [DOI] [PubMed] [Google Scholar]
- 5. Cryer PE. Hypoglycemia, functional brain failure, and brain death. J Clin Invest. 2007;117:868‐870. [DOI] [PMC free article] [PubMed] [Google Scholar]
- 6. Mcnay EC, Williamson A, Mccrimmon RJ, et al. Cognitive and neural hippocampal effects of long‐term moderate recurrent hypoglycemia. Diabetes. 2006;55:1088‐1095. [DOI] [PubMed] [Google Scholar]
- 7. Zoungas S, Patel A, Chalmers J, et al. Severe hypoglycemia and risks of vascular events and death. N Engl J Med. 2010;363:1410‐1418. [DOI] [PubMed] [Google Scholar]
- 8. Dave KR, Tamariz J, Desai KM, et al. Recurrent hypoglycemia exacerbates cerebral ischemic damage in streptozotocin‐induced diabetic rats. Stroke. 2011;42:1404‐1411. [DOI] [PubMed] [Google Scholar]
- 9. Bensaad K, Tsuruta A, Selak MA, et al. TIGAR, a p53‐inducible regulator of glycolysis and apoptosis. Cell. 2006;126:107‐120. [DOI] [PubMed] [Google Scholar]
- 10. Li H, Jogl G. Structural and biochemical studies of TIGAR (TP53‐induced glycolysis and apoptosis regulator). J Biol Chem. 2009;284:1748‐1754. [DOI] [PMC free article] [PubMed] [Google Scholar]
- 11. Cheung EC, Ludwig RL, Vousden KH. Mitochondrial localization of TIGAR under hypoxia stimulates HK2 and lowers ROS and cell death. Proc Natl Acad Sci U S A. 2012;109:20491‐20496. [DOI] [PMC free article] [PubMed] [Google Scholar]
- 12. Wanka C, Steinbach JP. Rieger J Tp53‐induced glycolysis and apoptosis regulator (TIGAR) protects glioma cells from starvation‐induced cell death by up‐regulating respiration and improving cellular redox homeostasis. J Biol Chem. 2012;287:33436‐33446. [DOI] [PMC free article] [PubMed] [Google Scholar]
- 13. Bensaad K, Cheung EC, Vousden KH. Modulation of intracellular ROS levels by TIGAR controls autophagy. EMBO J. 2009;28:3015‐3026. [DOI] [PMC free article] [PubMed] [Google Scholar]
- 14. Hoshino A, Matoba S, Iwai‐Kanai E, et al. p53‐TIGAR axis attenuates mitophagy to exacerbate cardiac damage after ischemia. J Mol Cell Cardiol. 2012;52:175‐184. [DOI] [PubMed] [Google Scholar]
- 15. Li M, Sun M, Cao L, et al. A TIGAR‐regulated metabolic pathway is critical for protection of brain ischemia. J Neurosci. 2014;34:7458‐7471. [DOI] [PMC free article] [PubMed] [Google Scholar]
- 16. Cao L, Chen J, Li M, et al. Endogenous level of TIGAR in brain is associated with vulnerability of neurons to ischemic injury. Neurosci Bull. 2015;31:527‐540. [DOI] [PMC free article] [PubMed] [Google Scholar]
- 17. Han F, Chen YX, Lu YM, et al. Regulation of the ischemia‐induced autophagy‐lysosome processes by nitrosative stress in endothelial cells. J Pineal Res. 2011;51:124‐135. [DOI] [PubMed] [Google Scholar]
- 18. Qin AP, Liu CF, Qin YY, et al. Autophagy was activated in injured astrocytes and mildly decreased cell survival following glucose and oxygen deprivation and focal cerebral ischemia. Autophagy. 2010;6:738‐753. [DOI] [PubMed] [Google Scholar]
- 19. Klionsky DJ, Emr SD. Autophagy as a regulated pathway of cellular degradation. Science. 2000;290:1717‐1721. [DOI] [PMC free article] [PubMed] [Google Scholar]
- 20. Shintani T, Klionsky DJ. Autophagy in health and disease: a double‐edged sword. Science. 2004;306:990‐995. [DOI] [PMC free article] [PubMed] [Google Scholar]
- 21. Han J, Pan XY, Xu Y, et al. Curcumin induces autophagy to protect vascular endothelial cell survival from oxidative stress damage. Autophagy. 2012;8:812‐825. [DOI] [PubMed] [Google Scholar]
- 22. Tao RR, Wang H, Hong LJ, et al. Nitrosative stress induces peroxiredoxin 1 ubiquitination during ischemic insult via E6AP activation in endothelial cells both in vitro and in vivo. Antioxid Redox Signal. 2014;21:1‐16. [DOI] [PMC free article] [PubMed] [Google Scholar]
- 23. Zou MH, Shi C, Cohen RA. High glucose via peroxynitrite causes tyrosine nitration and inactivation of prostacyclin synthase that is associated with thromboxane/prostaglandin H(2) receptor‐mediated apoptosis and adhesion molecule expression in cultured human aortic endothelial cells. Diabetes. 2002;51:198‐203. [DOI] [PubMed] [Google Scholar]
- 24. Han F, Tao RR, Zhang GS, et al. Melatonin ameliorates ischemic‐like injury‐evoked nitrosative stress: involvement of HtrA2/PED pathways in endothelial cells. J Pineal Res. 2011;50:281‐291. [DOI] [PubMed] [Google Scholar]
- 25. Wang HJ, Zhang D, Tan YZ, et al. Autophagy in endothelial progenitor cells is cytoprotective in hypoxic conditions. Am J Physiol Cell Physiol. 2013;304:C617‐C626. [DOI] [PubMed] [Google Scholar]
- 26. Reiter RJ, Tan DX, Galano A. Melatonin exceeding expectations. Physiology (Bethesda). 2014;29:325‐333. [DOI] [PubMed] [Google Scholar]
- 27. Manchester LC, Coto‐Montes A, Boga JA, et al. Melatonin: an ancient molecule that makes oxygen metabolically tolerable. J Pineal Res. 2015;59:403‐419. [DOI] [PubMed] [Google Scholar]
- 28. Reiter RJ, Mayo JC, Tan DX, et al. Melatonin as an antioxidant: under promises but over delivers. J Pineal Res. 2016;61:253‐278. [DOI] [PubMed] [Google Scholar]
- 29. Torii K, Uneyama H, Nishino K, Kundoh T. Melatonin suppresses cerebral edema caused by middle cerebral artery occlusion/reperfusion in rats assessed by magnetic resonance imaging. J Pineal Res. 2004;36:18‐24. [DOI] [PubMed] [Google Scholar]
- 30. Zhao L, An R, Yang Y, et al. Melatonin alleviates brain injury in mice subjected to cecal ligation and puncture via attenuating inflammation, apoptosis, and oxidative stress: the role of SIRT1 signaling. J Pineal Res. 2015;15:230‐239. [DOI] [PubMed] [Google Scholar]
- 31. Deng Y, Fan C, Hu W, et al. Melatonin attenuated early brain injury induced by subarachnoid hemorrhage via regulating NLRP3 inflammasome and apoptosis signaling. J Pineal Res. 2016;60:253‐262. [DOI] [PubMed] [Google Scholar]
- 32. Hong LJ, Jiang Q, Long S, et al. Valproic acid influences MTNR1A intracellular trafficking and signaling in a beta‐arrestin 2‐dependent manner. Mol Neurobiol. 2016;53:1237‐1246. [DOI] [PubMed] [Google Scholar]
- 33. Tao RR, Huang JY, Shao XJ, et al. Ischemic injury promotes Keap1 nitration and disturbance of antioxidative responses in endothelial cells: a potential vasoprotective effect of melatonin. J Pineal Res. 2013;54:271‐281. [DOI] [PubMed] [Google Scholar]
- 34. Canada SE, Weaver SA, Sharpe SN, et al. Brain glycogen supercompensation in the mouse after recovery from insulin‐induced hypoglycemia. J Neurosci Res. 2011;89:585‐591. [DOI] [PMC free article] [PubMed] [Google Scholar]
- 35. Li X, Tao RR, Hong LJ, et al. Visualizing peroxynitrite fluxes in endothelial cells reveals the dynamic progression of brain vascular injury. J Am Chem Soc. 2015;137:12296‐12303. [DOI] [PubMed] [Google Scholar]
- 36. Sheng R, Liu XQ, Zhang LS, et al. Autophagy regulates endoplasmic reticulum stress in ischemic preconditioning. Autophagy. 2012;8:310‐325. [DOI] [PubMed] [Google Scholar]
- 37. Zhang GS, Tian Y, Huang JY, et al. The gamma‐secretase blocker DAPT reduces the permeability of the blood‐brain barrier by decreasing the ubiquitination and degradation of occludin during permanent brain ischemia. CNS Neurosci Ther. 2013;19:53‐60. [DOI] [PMC free article] [PubMed] [Google Scholar]
- 38. Nitta T, Hata M, Gotoh S, et al. Size‐selective loosening of the blood‐brain barrier in claudin‐5‐deficient mice. J Cell Biol. 2003;161:653‐660. [DOI] [PMC free article] [PubMed] [Google Scholar]
- 39. Kook SY, Hong HS, Moon M, et al. Abeta(1)(−)(4)(2)‐RAGE interaction disrupts tight junctions of the blood‐brain barrier via Ca(2)(+)‐calcineurin signaling. J Neurosci. 2012;32:8845‐8854. [DOI] [PMC free article] [PubMed] [Google Scholar]
- 40. Luissint AC, Artus C, Glacial F, et al. Tight junctions at the blood brain barrier: physiological architecture and disease‐associated dysregulation. Fluids Barriers CNS. 2012;9:23. [DOI] [PMC free article] [PubMed] [Google Scholar]
- 41. Ohtsuki S, Sato S, Yamaguchi H, et al. Exogenous expression of claudin‐5 induces barrier properties in cultured rat brain capillary endothelial cells. J Cell Physiol. 2007;210:81‐86. [DOI] [PubMed] [Google Scholar]
- 42. Hirase T, Staddon JM, Saitou M, et al. Occludin as a possible determinant of tight junction permeability in endothelial cells. J Cell Sci. 1997;110(Pt 14):1603‐1613. [DOI] [PubMed] [Google Scholar]
- 43. Chen J, Chen G, Li J, et al. Melatonin attenuates inflammatory response‐induced brain edema in early brain injury following a subarachnoid hemorrhage: a possible role for the regulation of pro‐inflammatory cytokines. J Pineal Res. 2014;57:340‐347. [DOI] [PubMed] [Google Scholar]
- 44. Free RB, Hazelwood LA, Sibley DR. Identifying novel protein‐protein interactions using co‐immunoprecipitation and mass spectroscopy. Curr Protoc Neurosci. 2009;Chapter 5:Unit 5.28. [DOI] [PMC free article] [PubMed] [Google Scholar]
- 45. Aracena P, Tang W, Hamilton SL, et al. Effects of S‐glutathionylation and S‐nitrosylation on calmodulin binding to triads and FKBP12 binding to type 1 calcium release channels. Antioxid Redox Signal. 2005;7:870‐881. [DOI] [PubMed] [Google Scholar]
- 46. Sun M, Li M, Huang Q, et al. Ischemia/reperfusion‐induced upregulation of TIGAR in brain is mediated by SP1 and modulated by ROS and hormones involved in glucose metabolism. Neurochem Int. 2015;80:99‐109. [DOI] [PubMed] [Google Scholar]
- 47. Schoors S, De Bock K, Cantelmo AR, et al. Partial and transient reduction of glycolysis by PFKFB3 blockade reduces pathological angiogenesis. Cell Metab. 2014;19:37‐48. [DOI] [PubMed] [Google Scholar]
- 48. Wang L, Dong Z, Huang B, et al. Distinct patterns of autophagy evoked by two benzoxazine derivatives in vascular endothelial cells. Autophagy. 2010;6:1115‐1124. [DOI] [PubMed] [Google Scholar]
- 49. Kouroku Y, Fujita E, Tanida I, et al. ER stress (PERK/eIF2alpha phosphorylation) mediates the polyglutamine‐induced LC3 conversion, an essential step for autophagy formation. Cell Death Differ. 2007;14:230‐239. [DOI] [PubMed] [Google Scholar]
- 50. Peters K, Kamp G, Berz A, et al. Changes in human endothelial cell energy metabolic capacities during in vitro cultivation. The role of “aerobic glycolysis” and proliferation. Cell Physiol Biochem. 2009;24:483‐492. [DOI] [PubMed] [Google Scholar]
- 51. Kago T, Takagi N, Date I, et al. Cerebral ischemia enhances tyrosine phosphorylation of occludin in brain capillaries. Biochem Biophys Res Commun. 2006;339:1197‐1203. [DOI] [PubMed] [Google Scholar]
- 52. Kimata M, Matoba S, Iwai‐Kanai E, et al. p53 and TIGAR regulate cardiac myocyte energy homeostasis under hypoxic stress. Am J Physiol Heart Circ Physiol. 2010;299:H1908‐H1916. [DOI] [PubMed] [Google Scholar]
- 53. Yin L, Kosugi M, Kufe D. Inhibition of the MUC1‐C oncoprotein induces multiple myeloma cell death by down‐regulating TIGAR expression and depleting NADPH. Blood. 2012;119:810‐816. [DOI] [PMC free article] [PubMed] [Google Scholar]
- 54. Han F, Shirasaki Y, Fukunaga K. Microsphere embolism‐induced endothelial nitric oxide synthase expression mediates disruption of the blood‐brain barrier in rat brain. J Neurochem. 2006;99:97‐106. [DOI] [PubMed] [Google Scholar]
- 55. Tan KH, Harrington S, Purcell WM, et al. Peroxynitrite mediates nitric oxide‐induced blood‐brain barrier damage. Neurochem Res. 2004;29:579‐587. [DOI] [PubMed] [Google Scholar]
- 56. Abu‐Soud HM, Stuehr DJ. Nitric oxide synthases reveal a role for calmodulin in controlling electron transfer. Proc Natl Acad Sci U S A. 1993;90:10769‐10772. [DOI] [PMC free article] [PubMed] [Google Scholar]
- 57. Kumar S, Kain V, Sitasawad SL. Cardiotoxicity of calmidazolium chloride is attributed to calcium aggravation, oxidative and nitrosative stress, and apoptosis. Free Radic Biol Med. 2009;47:699‐709. [DOI] [PubMed] [Google Scholar]
- 58. Anderson G, Maes M. Local melatonin regulates inflammation resolution: a common factor in neurodegenerative, psychiatric and systemic inflammatory disorders. CNS Neurol Disord Drug Targets. 2014;13:817‐827. [DOI] [PubMed] [Google Scholar]
- 59. Blanco S, Hernandez R, Franchelli G, et al. Melatonin influences NO/NOS pathway and reduces oxidative and nitrosative stress in a model of hypoxic‐ischemic brain damage. Nitric Oxide. 2017;62:32‐43. [DOI] [PubMed] [Google Scholar]
- 60. Ischiropoulos H, Zhu L, Chen J, et al. Peroxynitrite‐mediated tyrosine nitration catalyzed by superoxide dismutase. Arch Biochem Biophys. 1992;298:431‐437. [DOI] [PubMed] [Google Scholar]
- 61. Szabo C. Hydrogen sulphide and its therapeutic potential. Nat Rev Drug Discov. 2007;6:917‐935. [DOI] [PubMed] [Google Scholar]
- 62. Nguyen TM, Subramanian IV, Kelekar A, et al. Kringle 5 of human plasminogen, an angiogenesis inhibitor, induces both autophagy and apoptotic death in endothelial cells. Blood. 2007;109:4793‐4802. [DOI] [PubMed] [Google Scholar]
- 63. Torisu T, Torisu K, Lee IH, et al. Autophagy regulates endothelial cell processing, maturation and secretion of von Willebrand factor. Nat Med. 2013;19:1281‐1287. [DOI] [PMC free article] [PubMed] [Google Scholar]
- 64. Xie JM, Li B, Yu HP, et al. TIGAR has a dual role in cancer cell survival through regulating apoptosis and autophagy. Cancer Res. 2014;74:5127‐5138. [DOI] [PubMed] [Google Scholar]
Associated Data
This section collects any data citations, data availability statements, or supplementary materials included in this article.
Supplementary Materials